. 2022 May 5;5(1):420.
doi: 10.1038/s42003-022-03345-5.

A whole-ecosystem experiment reveals flow-induced shifts in a stream community

Affiliations

A whole-ecosystem experiment reveals flow-induced shifts in a stream community

Daniela Rosero-López et al. Commun Biol. .

Abstract

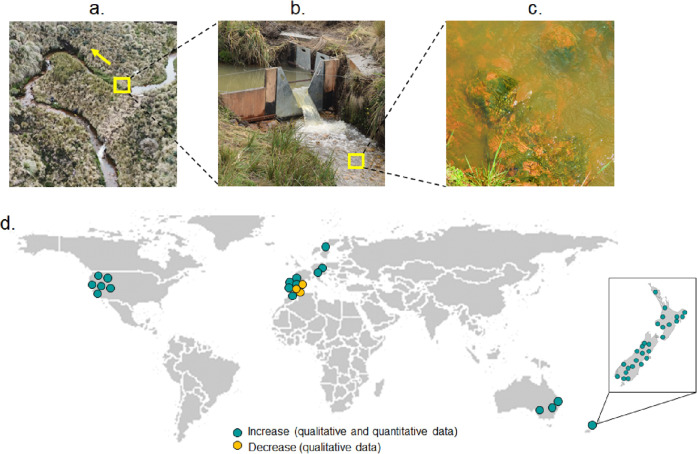
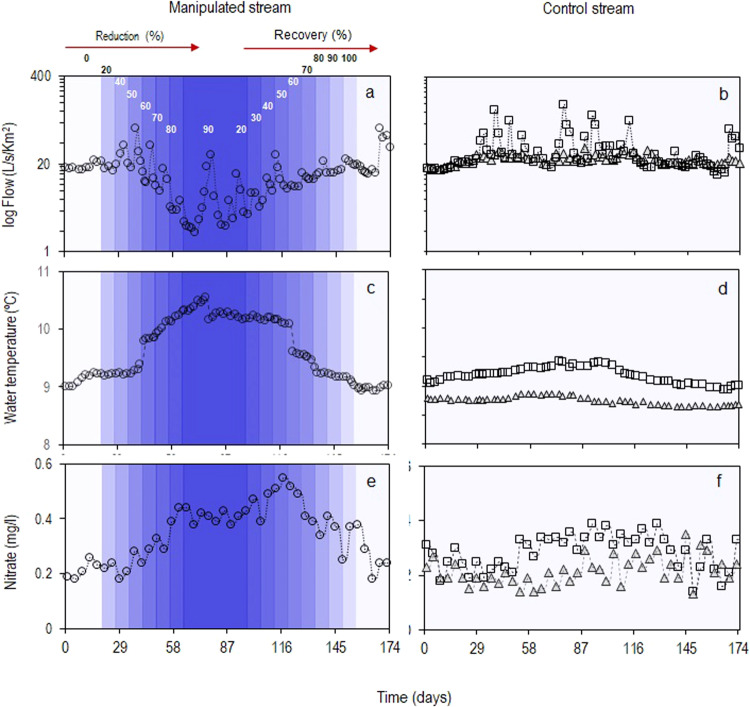
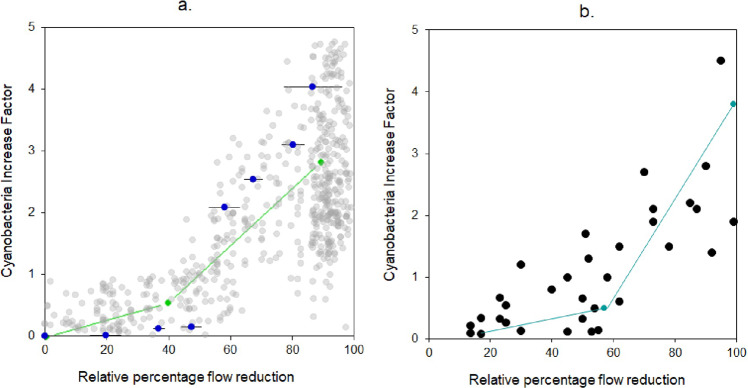
The growing threat of abrupt and irreversible changes to the functioning of freshwater ecosystems compels robust measures of tipping point thresholds. To determine benthic cyanobacteria regime shifts in a potable water supply system in the tropical Andes, we conducted a whole ecosystem-scale experiment in which we systematically diverted 20 to 90% of streamflow and measured ecological responses. Benthic cyanobacteria greatly increased with a 60% flow reduction and this tipping point was related to water temperature and nitrate concentration increases, both known to boost algal productivity. We supplemented our experiment with a regional survey collecting > 1450 flow-benthic algal measurements at streams varying in water abstraction levels. We confirmed the tipping point flow value, albeit at a slightly lower threshold (40-50%). A global literature review broadly confirmed our results with a mean tipping point at 58% of flow reduction. Our study provides robust in situ demonstrations of regime shift thresholds in running waters with potentially strong implications for environmental flows management.


Conflict of interest statement

The authors declare no competing interests.

Figures

Fig. 1
Fig. 1. Benthic cyanobacteria relations to flow in rivers.
a Experimental flow manipulations in a free-flowing high-altitude stream reach, b using a series of v-notch weirs to reduce natural flow in fixed percentages, c showed an increase in benthic cyanobacteria levels, d worldwide studies (circles, n = 53) reporting qualitative observations of benthic cyanobacteria biomass decreases (yellow) and qualitative and quantitative observations of biomass increases (teal-blue) with respect to flow reduction. Right-downside frame show data reported for New Zealand.
Fig. 2
Fig. 2. Environmental variables during experimental flow manipulations and natural flow.
a, c, e Time-series (open symbols) and smoothed-state estimates (dotted lines) for the manipulated stream (circles) during gradual flow reductions and recoveries of the 20, 40, 50, 60, 70, 80, 90%, and 20, 30, 40, 50, 60, 70, 80, 90, and 100% of upstream flow (blue shades), while maintaining daily fluctuation (b, d, f) natural flow conditions for the upstream reach of the experimental site (squares) and the upstream reach of the control site (triangles).
Fig. 3
Fig. 3. Benthic cyanobacteria biomass response to experimental manipulations and natural flow.
a Time-series and smoothed-state estimates (dotted lines) for the experimental site on the manipulated stream (open circles) undergoing reductions and recovery of flow (blue shades); b time-series of the upstream reach of the experimental site (squares) and the upstream reach of the control site (triangles) under natural flow conditions. Red curves in lower scale correspond to standardized smoothed-state residuals from state-space models for the experimental site and the upstream reach of the control site (the downstream reach shows a similar response to the upstream site as there is no alteration in the stream, see Table 1); dashed black lines are the upper and lower 95% confidence intervals, and stars indicate when standardized smoothed-state residuals are beyond the dashed line of confidence interval levels.
Fig. 4
Fig. 4. Benthic cyanobacteria increase factor according to the relative percentage of flow reduction.
a Measurements (gray circles) of paired cyanobacteria-flow monitoring data (n = 697) at the time of the sample in one location upstream of the water intake and two locations downstream water intakes in seven streams from the water supply system; experimental results (blue circles) of cyanobacteria increase with targeted flow reductions including variations ±SE from temporal replicates within flow reduction (black lines). Rammer–Douglas–Peucker model (RDP) (green line) fitted to monitoring data showing a breakpoint for cyanobacteria increase with a 40% flow reduction. b A global survey of benthic cyanobacteria-flow data (n = 33) showing a distribution fitted with RDP model: cyanobacteria increase after a breakpoint of 58% flow reduction (teal blue line).

References

    1. Burford MA, et al. Perspective: advancing the research agenda for improving understanding of cyanobacteria in a future of global change. Harmful Algae. 2020;91:101601. doi: 10.1016/j.hal.2019.04.004. - DOI - PubMed
    1. Scheffer M, Carpenter S, Foley JA, Folke C, Walker B. Catastrophic shifts in ecosystems. Nature. 2001;413:591–596. doi: 10.1038/35098000. - DOI - PubMed
    1. Mitrovic SM, Hardwick L, Dorani F. Use of flow management to mitigate cyanobacterial blooms in the Lower Darling River, Australia. J. Plankton Res. 2011;33:229–241. doi: 10.1093/plankt/fbq094. - DOI
    1. Bouma-Gregson K, Power ME, Bormans M. Rise and fall of toxic benthic freshwater cyanobacteria (Anabaena spp.) in the Eel river: Buoyancy and dispersal. Harmful Algae. 2017;66:79–87. doi: 10.1016/j.hal.2017.05.007. - DOI - PubMed
    1. Pace ML, et al. Reversal of a cyanobacterial bloom in response to early warnings. Proc. Natl Acad. Sci. USA. 2017;114:352–357. doi: 10.1073/pnas.1612424114. - DOI - PMC - PubMed

Publication types