. 2022 May;25(5):588-595.
doi: 10.1038/s41593-022-01061-1. Epub 2022 May 5.

Single-cell genomic profiling of human dopamine neurons identifies a population that selectively degenerates in Parkinson's disease

Affiliations

Single-cell genomic profiling of human dopamine neurons identifies a population that selectively degenerates in Parkinson's disease

Tushar Kamath et al. Nat Neurosci. 2022 May.

Abstract

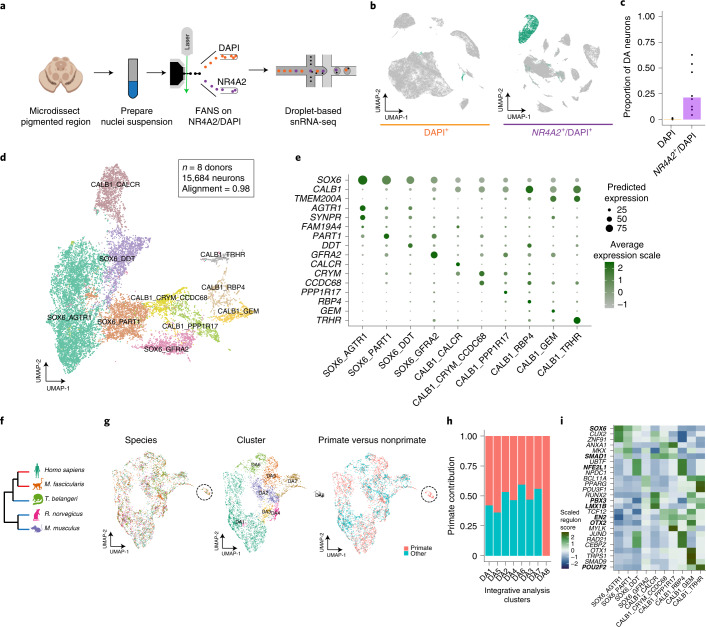
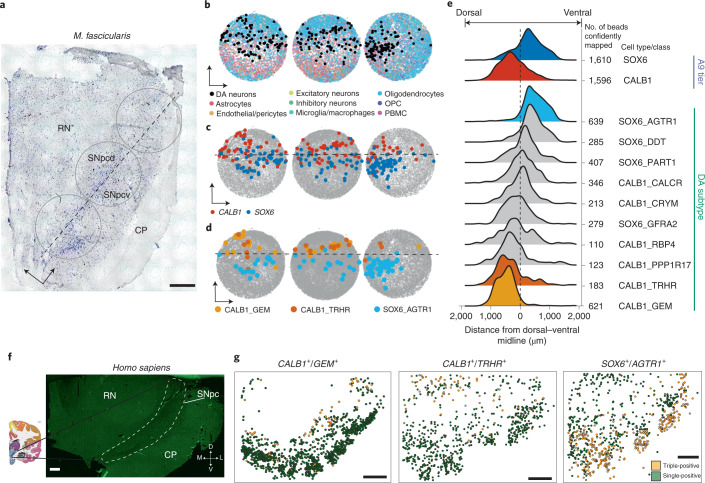
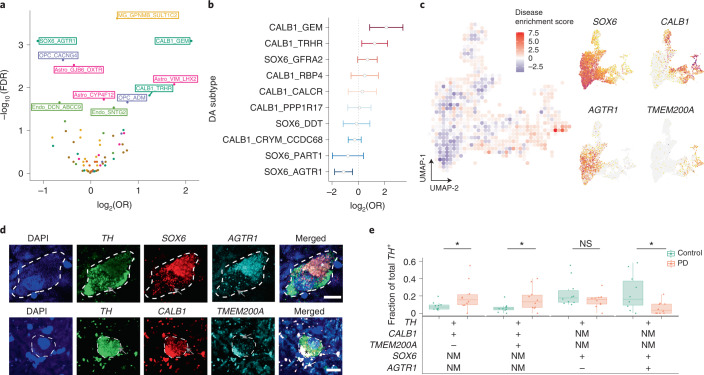
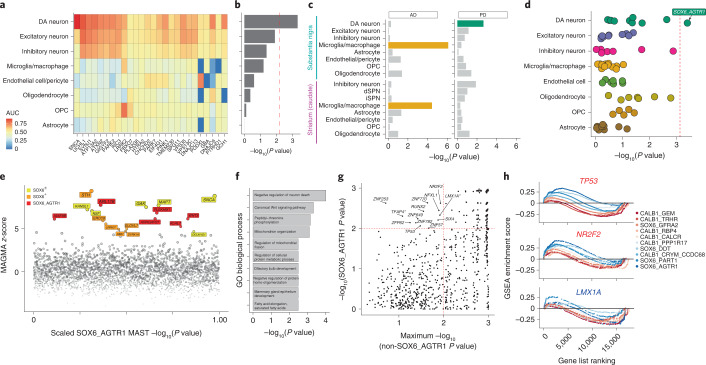
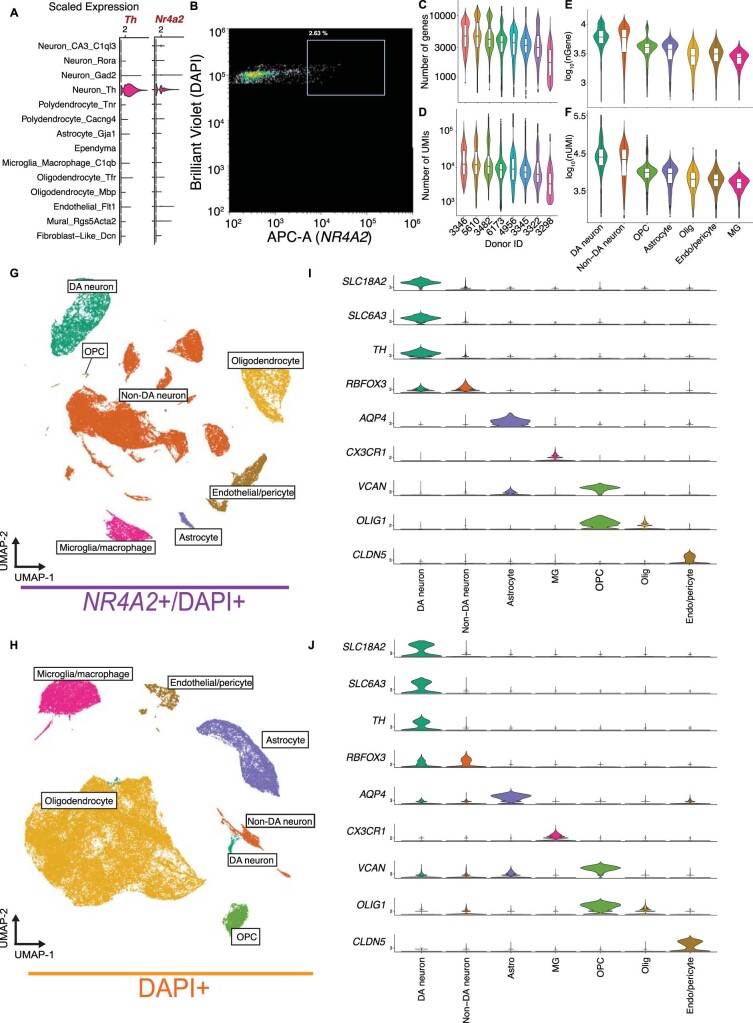
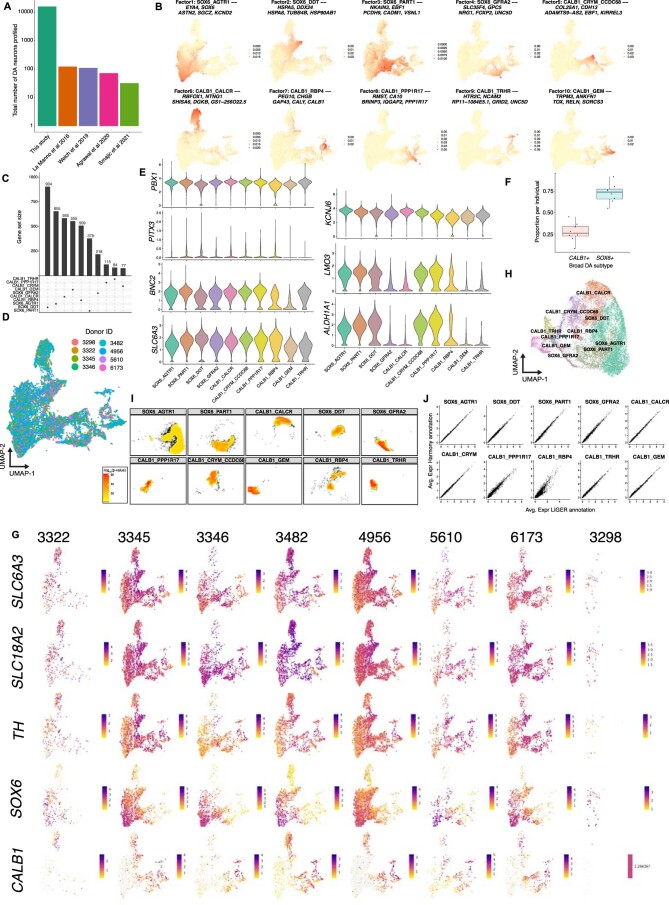
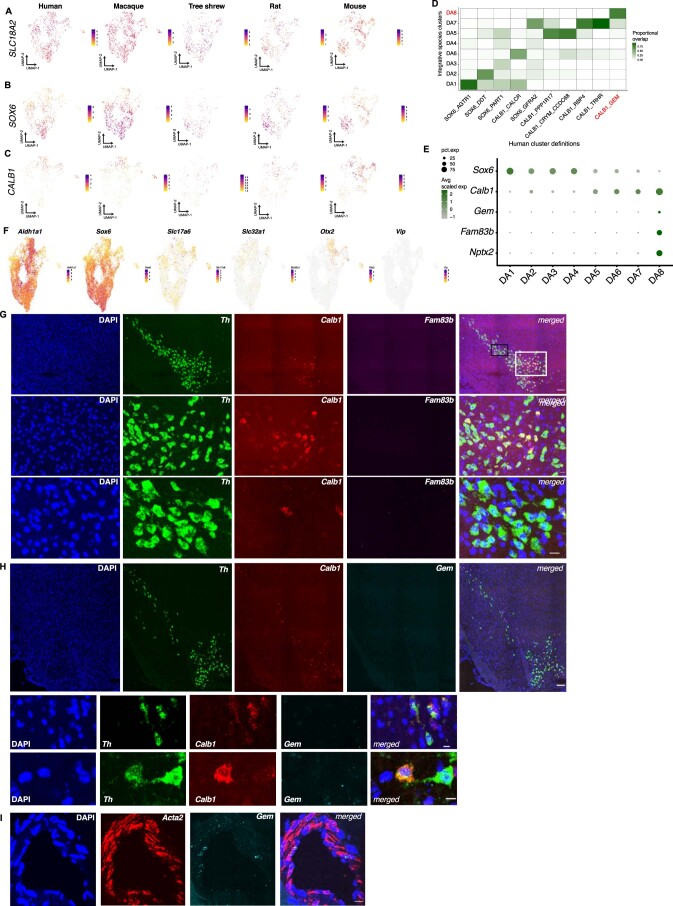
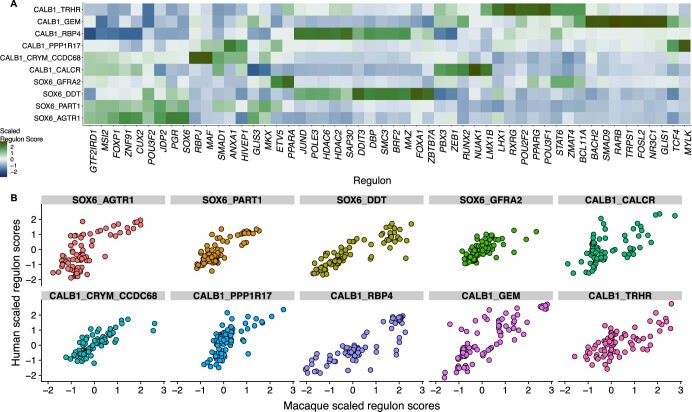
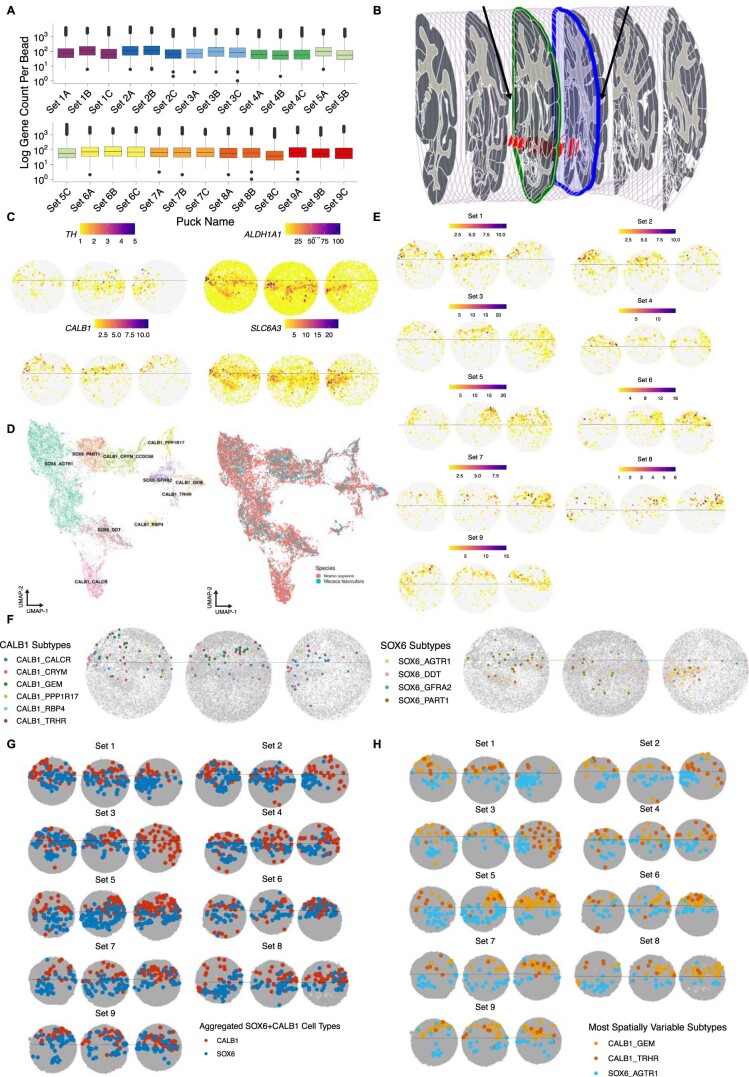
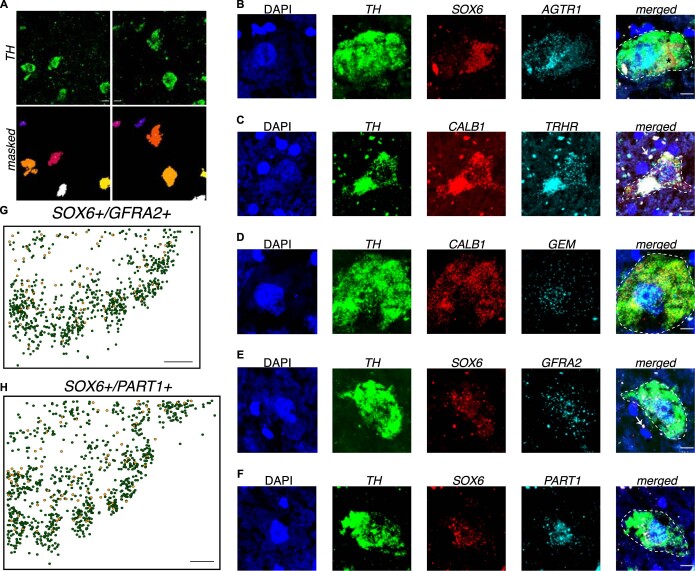
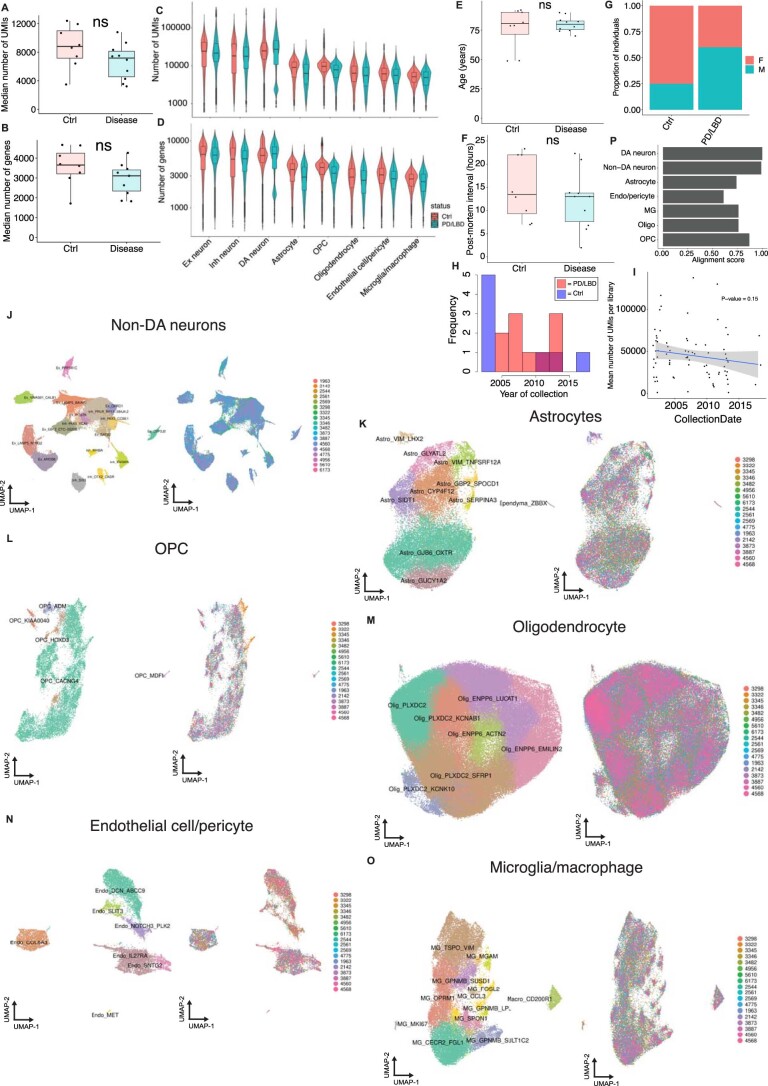
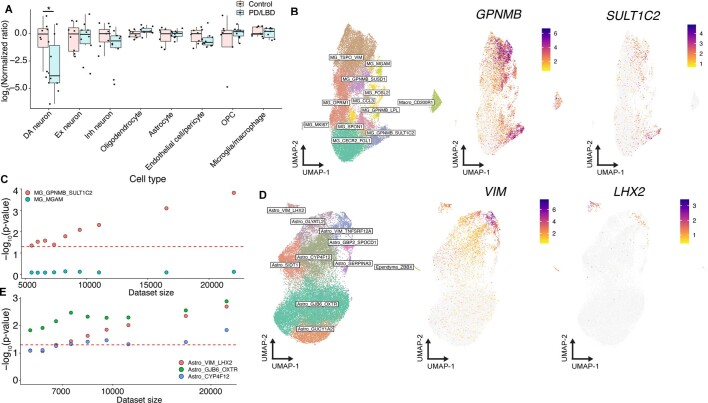
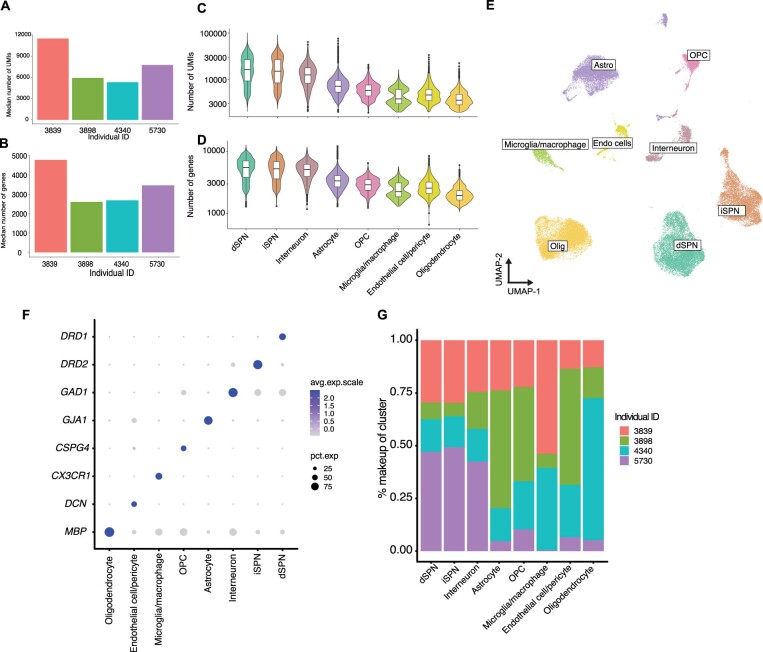
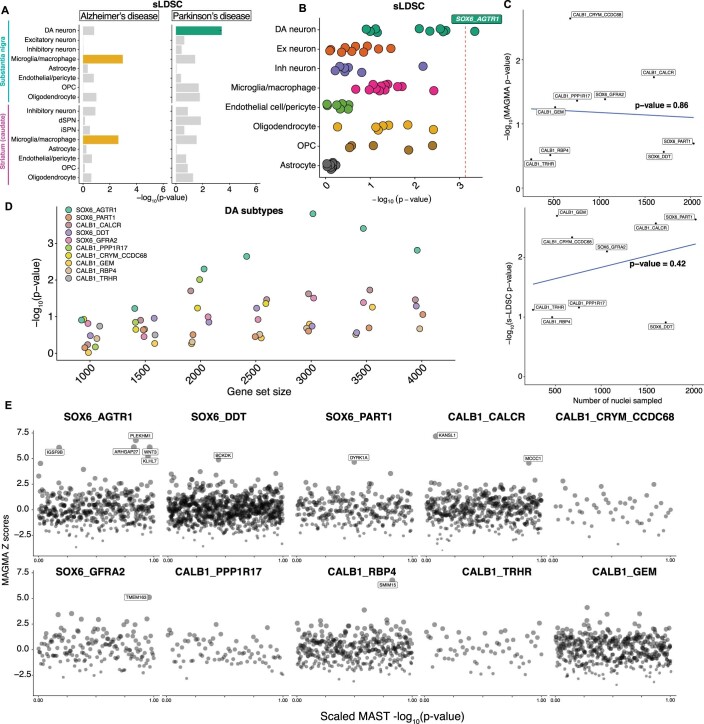
The loss of dopamine (DA) neurons within the substantia nigra pars compacta (SNpc) is a defining pathological hallmark of Parkinson's disease (PD). Nevertheless, the molecular features associated with DA neuron vulnerability have not yet been fully identified. Here, we developed a protocol to enrich and transcriptionally profile DA neurons from patients with PD and matched controls, sampling a total of 387,483 nuclei, including 22,048 DA neuron profiles. We identified ten populations and spatially localized each within the SNpc using Slide-seq. A single subtype, marked by the expression of the gene AGTR1 and spatially confined to the ventral tier of SNpc, was highly susceptible to loss in PD and showed the strongest upregulation of targets of TP53 and NR2F2, nominating molecular processes associated with degeneration. This same vulnerable population was specifically enriched for the heritable risk associated with PD, highlighting the importance of cell-intrinsic processes in determining the differential vulnerability of DA neurons to PD-associated degeneration.


Conflict of interest statement

E.Z.M. is a consultant for Atlas Bio, Inc. The remaining authors declare no competing interests.

Figures

Fig. 1
Fig. 1. A molecular census of DA neurons in the human substantia nigra.
a, NR4A2 antibody-based enrichment strategy and snRNA-seq profiling workflow. b, UMAP representation of 104,097 NR4A2 (left) and 80,576 NR4A2+ (middle) nuclei from eight neurotypical donors. Profiles colored green are from clusters identified as DA neurons. c, Bar plot of proportions of DA neurons per replicate for NR4A2 versus NR4A2+ libraries (median fold enrichment, 70; n = 21 NR4A2+ and n = 16 NR4A2 libraries). d, UMAP representation of 15,684 DA neuron nuclei, colored by cell type. e, Dot plot showing expression of selected marker genes across DA clusters. f, Dendrogram showing phylogenetic relationships among the five species samples in this study. Red and blue branches denote primate and nonprimate species, respectively. g, UMAP representation of 6,253 DA neuron nuclei (3,400 primate nuclei and 2,853 nonprimate cells), colored by species (left), cluster identity (middle) and primate versus nonprimate (right). h, Stacked bar plot showing the proportion of primate profiles (red bars) in each cluster. i, Heatmap of scaled regulon activity, as determined by SCENIC (Methods), for the top three differentially expressed regulons per DA subtype. Bold indicates those TFs previously identified as important for midbrain DA differentiation.
Fig. 2
Fig. 2. Spatial localization of DA subtypes in NHP and human midbrain.
a, Nissl staining of a 10-μm M. fascicularis midbrain slice adjacent to Slide-seq-assayed tissue. Circles indicate approximate location of the placement of the three Slide-seq arrays shown in bd. RN, red nucleus; CP, cerebral peduncles; SNpcd, substantia nigra pars compacta dorsal; SNpcv, substantia nigra pars compacta ventral. Cartesian arrows indicate orientation of bead arrays in bd; scale bar, 1 mm. Nissl staining was repeated nine times across macaque brain. bd, Bead arrays colored by RCTD cell type definitions (Methods) corresponding to major cell type (b), CALB1+ or SOX6+ subtypes (c) and the three most spatially variable DA subtypes (d). e, Ridge plot for aggregated densities of CALB1 and SOX6 subtypes (top) and all ten DA subtypes (bottom) across 27 bead arrays (Methods, also includes definition of midline). f, Tiled image of one 10-μm human midbrain slice. White dotted line indicates the approximate A9 region; scale bar, 1 mm. Experiment was repeated once. g, Scatter plots showing relative location of triple- (yellow) and single-positive cells (Methods) from in situ hybridization of markers: CALB1+/GEM+ (left), CALB1+/TRHR+ (middle) and SOX6+/AGTR1+ DA neurons (right); scale bars, 1 mm. Experiment was repeated five times for SOX6+/AGTR1+ localization and once for CALB1+/GEM+ and CALB1+/TRHR+.
Fig. 3
Fig. 3. Quantification of DA subtype vulnerability to PD-associated degeneration.
a, Volcano plot showing OR and FDR computed by MASC (Methods) for each of the 68 clusters identified in SNpc snRNA-seq analysis. Labeled clusters are those significantly (FDR-adjusted P < 0.05) increased or depleted in association with PD/LBD. Points and text are colored by major cell type: dark green, DA neurons; yellow, microglia/macrophages; purple, OPCs; light green, endothelial cells/pericytes; pink, astrocytes. b, OR estimate of ten dopaminergic subpopulations as identified by MASC. Center of bar corresponds to OR estimate obtained from MASC, width corresponds to 2.5× s.d. of OR estimate from MASC. Bars that cross zero (dotted line) not statistically significant (FDR-adjusted P > 0.05, n = 22,048 DA neurons sampled across ten PD/LBD donors and eight neurotypical donors). c, Left: disease enrichment score (Methods) overlaid onto a binned UMAP representation of integrative analysis of both PD/LBD and control DA neurons (n = 10 PD/LBD individuals and n = 8 neurotypical controls). Right: expression of selected genes used to validate subtype vulnerability plotted on UMAP representation of DA neurons. d, Representative images of triple-positive cells for a disease-resistant DA population (TH+/CALB1+/TMEM200A+) and a disease-vulnerable population (TH+/AGTR1+/SOX6+, bottom). White/black asterisks indicate neuromelanin-induced autofluorescence while white arrows show lipofuscin-induced autofluorescence; gray arrows indicate RNA puncta. Scale bars, 10 μm. e, Boxplot showing proportions of four DA populations across ten PD and ten control SNpc tissue donors, determined by counting smFISH images from the two staining procedures (3,258 and 2,081 DA neurons counted for first and second assay, respectively) described in d. Center line of the boxplot indicates the median value while upper and lower hinges indicate the first and third quartiles of data, respectively. Whisker distance between upper and lower hinges represent ≤1.5× interquartile range. All dots represent an individual case for each subtype as a fraction of total TH+ cells counted. +, positive for marker; −, negative for marker; NM, not measured; NS, not significant. *P < 0.05 (P = 0.041 for CALB1+/TMEM200A+/TH+ comparison, P = 0.028 for CALB1+/TMEM200A/TH+ comparison, P = 0.009 for CALB1+/TH+ comparison, P = 0.024 for SOX6+/AGTR1+/TH+ comparison, P = 0.28 for SOX6+/AGTR1/TH+ experiment and P = 0.015 for SOX6+/AGTR1/TH+ comparison; Wilcoxon rank-sum two-sided test; Methods).
Fig. 4
Fig. 4. Genetic enrichments and TF set analyses within DA subtypes.
a, Heatmap of expression of 26 familial genes, colored by AUC statistic (Presto; Methods). b, Bar plot of −log10-transformed P values from Fisher’s exact test comparing overlap between markers for major cell types (Methods) and familial variant genes. Red dashed line indicates Bonferroni significance threshold (P < 0.05) c, Bar plot of −log10-transformed P values from MAGMA enrichment of AD (left) and PD (right) across 16 cell types from dorsal striatum (caudate) and SNpc. Bars are colored for significantly (Bonferroni-corrected P < 0.05) enriched cell types. d, Dot plot of −log10-transformed P values for MAGMA analysis of PD genetic risk in 68 transcriptionally defined SNpc clusters. Clusters are grouped on the y axis by major cell class. Red dashed line indicates Bonferroni significance threshold (P < 0.05). e, Scatter plot of genes nominated from MAGMA gene-based analysis (y axis) and enriched in the SOX6_AGTR1 set (x axis). Red indicates genes not differentially expressed in any other DA subtype; orange indicates genes enriched within all SOX6+ DA subtypes; yellow indicates genes enriched in SOX6+ or SOX6 DA subtype. #, Loci that have the nominated SNP within a coding region of the nominated gene. f, GO terms enriched among genes differentially expressed within the SOX6+ subtype that also have high (z-score > 4.568) MAGMA z-scores derived from PD GWA study. g, GSEA of TF target sets (Methods) within the SOX6_AGTR1 type (y axis) versus the maximum value of any other DA type (x axis). Dashed red lines indicate FDR-significant TFs. *, TFs with a negative enrichment score. h, GSEA trace plots for three TFs: TP53, NR2F2 and LMX1A. Colors correspond to ORs derived from MASC analysis (Fig. 2b). dSPN, direct spiny projection neuron; iSPN, indirect spiny projection neuron.
Extended Data Fig. 1
Extended Data Fig. 1. High-throughput snRNA-seq profiling of SNpc.
a, Expression of tyrosine hydroxylase (Th) and Nr4a2 in a published scRNA-seq study of mouse midbrain(21). b, Representative FANS plot for enriching midbrain dopaminergic neurons. APC-A (x-axis) represents NR4A2 antibody channel and Brilliant Violet (y-axis) represents DAPI channel. The NR4A2 gate was thresholded to select the top 2.5–4% of all nuclei (red box). c,d, Number of genes (C) and UMIs (unique molecular indicators) (D) per nucleus grouped by donor (n = 11,577 nuclei for subject 3298; 49,759 nuclei from 3322; 29,230 nuclei for 3345; 23,747 nuclei for subject 3346; 24,856 nuclei for subject 3482; 25,243 nuclei for subject 4956; 6,967 for subject 5610; and 13,294 nuclei for subject 6173). e-f, log10 number of genes (nGene) (E) and log10 number of UMIs (nUMI) (F) per cell type (n = 15,684 DA neuronal nuclei; 46,860 non-DA neurons; 5,866 OPC nuclei; 14,579 astrocyte nuclei; 76,837 oligodendrocyte nuclei; 16,755 microglia/macrophage nuclei; and 8,092 endothelial cell/fibroblast nuclei). For all box plots, center bar indicates median value and lower and upper hinges correspond to first and third quartiles respectively. Whisker distance from upper and lower hinges represents ≤1.5× !QR. DA, dopaminergic; non-DA, non-dopaminergic, OPC, oligodendrocyte precursor cell; Olig, oligodendrocyte; Endo/pericyte, endothelial cells/pericytes; MG, microglia/macrophage. g,h, UMAP representations of the NR4A2 + (G) and NR4A2- (H) gated nuclei, colored by cluster. i,j, Violin plots of marker genes for the seven major cell classes in the NR4A2 + (I) and NR4A2- (J) gated nuclei. DA, dopaminergic; non-DA, non-dopaminergic; Astro, astrocyte; MG, microglia/macrophages; OPC, oligodendrocyte precursor cell; Olig, oligodendrocyte; Endo, endothelial cells.
Extended Data Fig. 2
Extended Data Fig. 2. High-throughput profiling and characterization of human midbrain DA neuron diversity.
a, Bar plot (log scale) of total number of midbrain DA neurons profiled in this study and all previous single-cell studies of the human midbrain. b, Factor loadings obtained from LIGER integrative analysis projected onto UMAP embedding of DA neuron analysis. Title of each plot indicates highest loading DA subtype and top five highest loading genes (see Methods) for each factor. c, Upset plot of gene sets specific to each DA subtype determined by MAST differential expression analysis (Methods) d, SNpc UMAP representation of 15,684 DA profiles colored by individual. e, Violin plots showing scaled expression of genes previously defined by La Manno et al. as specific to midbrain DA neurons (left) and specific to subtypes identified in the mouse brain (right) f, Box plot of proportion of SOX6 + and CALB1 + DA neurons per individual (n = 8 neurotypical controls). Center bar indicates median value and lower and upper hinges correspond to first and third quartiles respectively. Whisker distance from upper and lower hinges represent ≤1.5× IQR. g, Expression of (in descending order) SLC6A3, SLC18A2, TH, SOX6, and CALB1 per individual. h, UMAP embedding of DA neurons colored by annotations determined via Harmony (see Methods). i, Density plots depicting -log10-transformed p-values of a resampling test (see Methods) to determine concordance of LIGER annotations in the Harmony-derived UMAP embedding. j, Scatter plot depicting average expression per DA subtype for the LIGER-derived annotations (X-axis, Fig. 1d) and Harmony-derived annotations (Y-axis, Extended Data Fig. 2h).
Extended Data Fig. 3
Extended Data Fig. 3. Cross-species analysis of DA subtypes.
a–c, Expression of SLC18A2 (DA neuron marker) (A), SOX6 (B), and CALB1 (C) across all five species sampled. d, Confusion matrix showing overlap of human cells within clusters defined by the cross-species integrative analysis and the human-only analysis (Fig. 1d). The clusters colored in red correspond to the primate-specific population (DA8) and cognate population in the human-only analysis (CALB1_GEM). e, Dot plot of additional marker genes for the primate-specific population, DA8. f, Feature plots of genes defined by Poulin et al as specific to subtypes of DA neurons in the mouse midbrain. g, Single-molecule fluorescence in situ hybridization (smFISH) images depicting absence of Fam83b + mouse nigral DA neurons. Top row = scanned and tiled image. Middle = white inset from top row indicating midline DA neurons. Bottom row = black inset from top row showing high-resolution images of mouse pars compacta dorsal tier. Th (green), Calb1 (red), and Fam83b. Top row scale bar = 100 microns. Middle/bottom row scale bar = 10 microns. h, Single-molecule FISH images depicting absence of Gem + mouse nigral DA neurons. Top = scanned and tiled view of in situ hybridization stains of mouse midbrain. Middle and bottom rows indicate high resolution example images of Th + /Calb1 + /Gem- cells in the dorsal tier (middle) and midline A9 region (bottom). Top row scale bar = 100um. Middle/bottom row scale bar = 10 microns. i, High-resolution view of in situ hybridization stains of Acta2 and Gem showing detection of Gem in smooth muscle vasculature but not DA neurons. Scale bar = 20 microns. Experiment was repeated twice for Fam83b and Gem in situ analyses and once for the Acta2 co-localization in mural cells.
Extended Data Fig. 4
Extended Data Fig. 4. Additional regulon analyses across all DA subtypes.
a, Top ten differentially enriched (FDR-adjusted p-value < 0.05, Wilcoxon rank-sum two-sided test) regulons per DA subtype. Scaled regulon score is the column-wise average scaled regulon activities per subtype as determined from SCENIC analysis (see Methods). b, Scatter plot indicating correlation of between scaled significant regulons from SCENIC analysis of macaque (X-axis) and human (Y-axis) DA subtype profiles.
Extended Data Fig. 5
Extended Data Fig. 5. Slide-seq mapping of DA neurons.
a, Box plots showing, for each bead array, the log number of genes captured per bead (n = 27 bead arrays). Each bead array is a part of a triplet set serially created during the dissection (Methods). Center bar indicates median number of genes and lower and upper hinges correspond to first and third quartiles of data, respectively. Whisker distance from upper and lower hinges represent no more than 1.5*interquartile range. b, Anatomical plates of Macaca fascicularis brain (71) in sagittal view with coronal sectioning. Highlighted red region is the substantia nigra. Black arrows indicate approximate locations of start (green highlighted plate) and end (blue highlighted plate) of sets of bead arrays sampled via Slide-seq. c, Spatial plot for the pucks in Set 1 showing each bead’s expression of TH, ALDH1A1, CALB1, and SLC6A3. d, UMAP showing integrative analysis (Methods) of control DA neuron snRNA-seq profiles and Macaca fascicularis DA neuron snRNA-seq profiles. Left — colored by DA types defined by the human integrative analysis (Fig. 1d). Right — colored by species. e, Expression of CALB1 across all 27 bead arrays showing putative location of the substantia nigra pars compacta dorsal tier. f, Bead arrays showing localization of all 10 DA subtypes from Set 1 (Fig. 2b-d) as determined by RCTD (Methods). g, Location of aggregated SOX6 + and CALB1 + subtypes across all 27 bead arrays. h, Location of three highly spatially variable subtypes (SOX6_AGTR1, CALB1_TRHR, CALB1_GEM) across all 27 bead arrays.
Extended Data Fig. 6
Extended Data Fig. 6. Single-molecule fluorescence in situ hybridization of DA neurons in postmortem human midbrain.
a, Top row - representative images of TH in situ hybridization in postmortem midbrain (Methods, scale bar = 10um). Bottom row - masks obtained from FIJI denoting location and size of DA neuron (Methods). b–f, Representative images for: TH + /SOX6 + /AGTR1 + (B), TH + /CALB1 + /TRHR + (C), TH + /CALB1 + /GEM + (D),TH + /SOX6 + /GFRA2 + (E), TH + /SOX6 + /PART1 + (F). White arrows indicates lipofuscin-associated autofluorescence and * indicates neuromelanin-associated autofluorescence defined by the absolute co-localization of pixel values across all channels. Scale bar = 10um. g,h, Location of SOX6 + /GFRA2 + (G) and SOX6 + /PART1 + (H) across human midbrain, yellow = triple-positive cells, green = single-positive (TH + ) cells. Sections for (G) and (H) were obtained from 1.8 mm from the most rostral/anterior aspect of the pars compacta. Scale bar = 1 mm for (G) and (H). Experiment was repeated once for each subpopulation.
Extended Data Fig. 7
Extended Data Fig. 7. Case-control scRNA-seq integrative analysis of SNpc.
a,b, Box plots showing, per individual, the median number of UMIs (A) and genes (B) per profile (n = 8 neurotypical controls and 10 PD/LBD samples). ns, not significant Wilcoxon rank-sum two-sided test p > 0.05. Center bar indicates median value and lower and upper hinges correspond to first and third quartiles respectively. Whisker distance from upper and lower hinges represent no more than 1.5*interquartile range. c,d, Violin plots of number of UMIs (C) and genes (D) per profile across eight major cell classes grouped by disease (PD/LBD, blue) and control (Ctrl, red). e-f, Box plots showing, per individual, the age at death (E) and postmortem interval (F) stratified by case (PD/LBD) and control (Ctrl) (n = 8 neurotypical controls and 10 PD/LBD samples). Center bar indicates median value and lower and upper hinges correspond to first and third quartiles respectively. Whisker distance from upper and lower hinges represent no more than 1.5*interquartile range (ns = not significant, Welch two sample t-test, p = 0.61 for (E) and p = 0.18 for (F). g, Stacked bar plot of sex stratified by disease status. h, Histogram of the year of collection of postmortem midbrain samples colored by case-control status (see Supplementary Tables 1 and 2 for raw values). i, Scatter plot of the collection year for each sample (x-axis) and the median number of UMIs (y-axis). Blue line indicates line of best fit as determined by lm.fit in R. Grey shading indicates standard error of fit. P-value corresponds to significance of slope from a mixed-effect model (see Methods). j–o, UMAP representations of Non-DA neurons (n = 91,479 nuclei) (J), Astrocytes (n = 33,506 nuclei) (K), Oligodendrocyte precursor cells (OPCs) (n = 13,691 nuclei) (L), Oligodendrocytes (n = 178,815 nuclei) (M), Endothelial cells/pericytes (n = 14,903 nuclei) (N), and Microglia/macrophages (n = 33,041 nuclei) (O) colored by cell type (left) and individual (right). P, Alignment scores (see Methods) for each of the seven non-DA cell classes.
Extended Data Fig. 8
Extended Data Fig. 8. Analyses and robustness testing of cell type proportional changes in PD/LBD.
a, Box plot of log2 ratio of cell types normalized to median of control ratios. Pink and blue dots denote control and PD/LBD individuals, respectively (* = p < 0.05, p = 0.034, Wilcoxon rank-sum two-sided test, n = 8 neurotypical controls and 10 PD/LBD postmortem samples). Center bar indicates median value and lower and upper hinges correspond to first and third quartiles respectively. Whisker distance from upper and lower hinges represent no more than 1.5*interquartile range. b, Left = UMAP of 33,041 microglia/macrophage cells. Middle and right = expression of GPNMB and SULT1C2 marking specific expression in the annotated microglia cluster. c, Dot plot of downsampling analysis for two microglia subtypes. Red dotted line is FDR-adjusted p-value = 0.05. d, Left = UMAP of 33,506 astrocytes. Middle and right = expression of VIM and LHX2 respectively marking specific expression in the annotated astrocyte cluster. e, Dot plot of downsampling analysis for three astrocyte subtypes. Red dotted line is FDR-adjusted p-value = 0.05.
Extended Data Fig. 9
Extended Data Fig. 9. Analysis of human dorsal striatum by snRNA-seq.
a,b, Median number of UMIs (A) and genes (B) per donor. c,d Violin plots showing the number of UMIs (C) and (D) across eight major cell classes defined by clustering. (n = 9,096 iSPNs; 10,503 dSPNs; 8,433 astrocytes; 1,418 endothelial cells/fibroblasts; 2,115 inhibitory neurons; 2,105 microglia/macrophages; 2,445 OPCs; 10,667 oligodendrocytes), direct spiny projection neurons; iSPN, indirect spiny projection neuron; OPC, oligodendrocyte precursor cells. For box plots in (C) and (D), center bars indicates median value and lower and upper hinges correspond to first and third quartiles respectively. Whisker distance from upper and lower hinges represent no more than 1.5*interquartile range. e, UMAP representation of 46,872 single nuclei from the dorsal striatum colored by major cell class. Astro, astrocyte; Olig, oligodendrocyte; Endo cells, endothelial cell/pericyte. f, Dot plot showing specific expression of selected marker genes across the eight major cell classes. g, Percent contribution of four tissue donors to the eight major cell classes.
Extended Data Fig. 10
Extended Data Fig. 10. Genetic enrichment analyses of the substantia nigra cell types and subtypes.
a, Bar plot of -log10-transformed p-values from s-LDSC (stratified LD score) enrichment of Alzheimer’s (left) and Parkinson’s disease (right) across 16 cell types from dorsal striatum (caudate) and SNpc. Bars are colored for significantly (Bonferroni-corrected p-value < 0.05) enriched cell types. b, Dot plot of -log10-transformed p-values for s-LDSC analysis of PD genetic risk in the 68 transcriptionally defined SNpc clusters. Clusters are grouped on the y-axis by major cell class. Red dotted line indicates the Bonferroni significance threshold (p-adjusted < 0.05). c, Scatter plot of number of nuclei sampled per DA subtype (x-axis) and -log10-transformed p-values from MAGMA (top) and s-LDSC (bottom) analyses. Blue line indicates the line of best fit as determined by lm.fit package (Methods). P-value determined from a two-sided significance testing of the slope coefficient from the best fit line (n = 9 DA subtypes, see Methods). d, Dot plot of -log10-transformed p-values for MAGMA analysis of DA subtype markers across gene set sizes (Methods) for PD common variant study(38). e, Pseudo-Manhattan of genes specific to each DA subtype (Extended Data Fig. 2c) ordered by scaled -log10-transformed p-values from MAST (Methods). Genes are those prioritized by MAST (Z-score > 4.568).

Comment in

References

    1. Bloem, B. R., Okun, M. S. & Klein, C. Parkinson’s disease. Lancet397, P2284–P2303 (2021). - PubMed
    1. Yamada T, McGeer PL, Baimbridge KG, McGeer EG. Relative sparing in Parkinson’s disease of substantia nigra dopamine neurons containing calbindin-D28K. Brain Res. 1990;526:303–307. doi: 10.1016/0006-8993(90)91236-A. - DOI - PubMed
    1. Schneider JS, Yuwiler A, Markham CH. Selective loss of subpopulations of ventral mesencephalic dopaminergic neurons in the monkey following exposure to MPTP. Brain Res. 1987;411:144–150. doi: 10.1016/0006-8993(87)90691-3. - DOI - PubMed
    1. Lu L, et al. Regional vulnerability of mesencephalic dopaminergic neurons prone to degenerate in Parkinson’s disease: a post-mortem study in human control subjects. Neurobiol. Dis. 2006;23:409–421. doi: 10.1016/j.nbd.2006.04.002. - DOI - PubMed
    1. Varastet M, Riche D, Maziere M, Hantraye P. Chronic MPTP treatment reproduces in baboons the differential vulnerability of mesencephalic dopaminergic neurons observed in Parkinson’s disease. Neuroscience. 1994;63:47–56. doi: 10.1016/0306-4522(94)90006-X. - DOI - PubMed

Publication types