

Biophysical studies of cancer cells' traverse-vessel behaviors under different pressures revealed cells' motion state transition
- PMID: 35513689
- PMCID: PMC9072532
- DOI: 10.1038/s41598-022-11047-5
Biophysical studies of cancer cells' traverse-vessel behaviors under different pressures revealed cells' motion state transition
Abstract
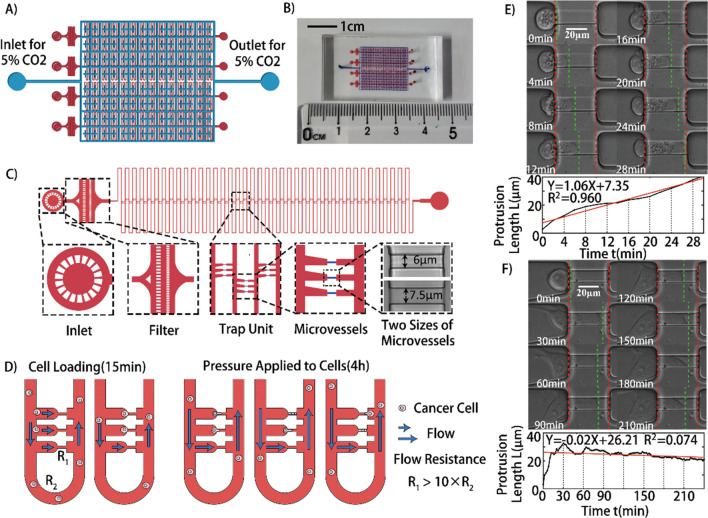
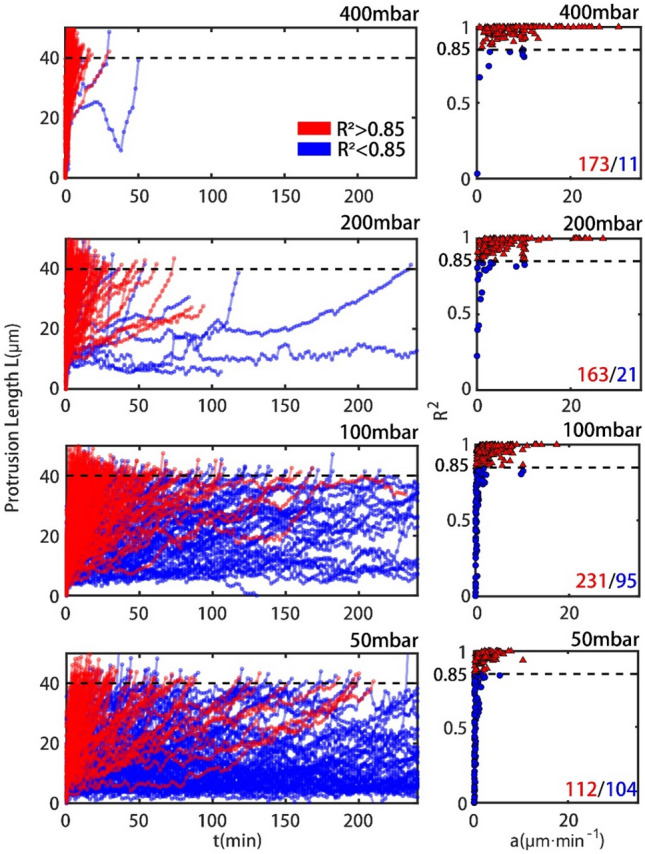
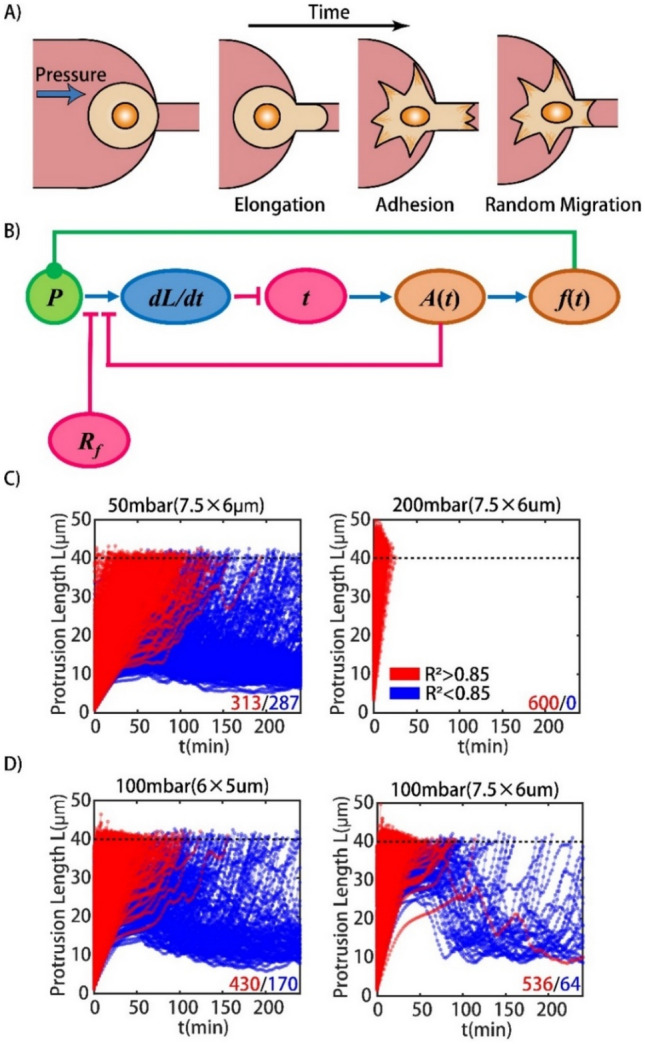
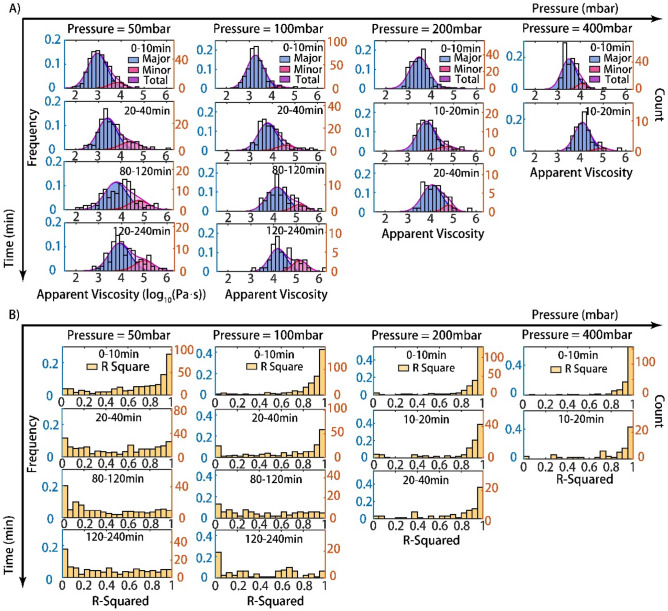
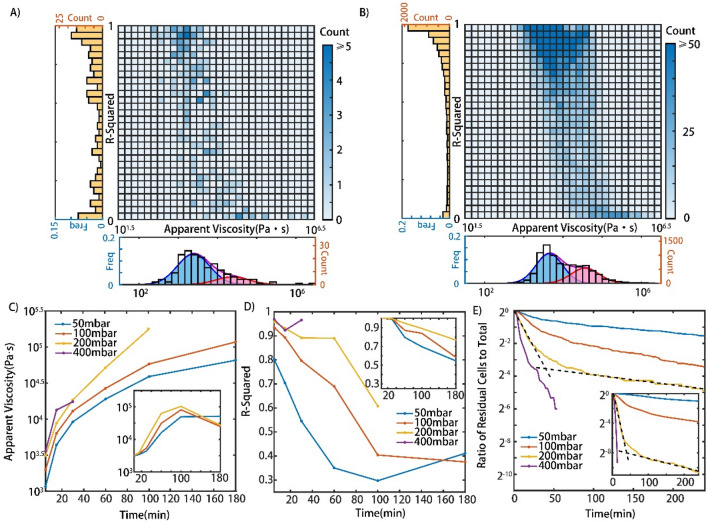
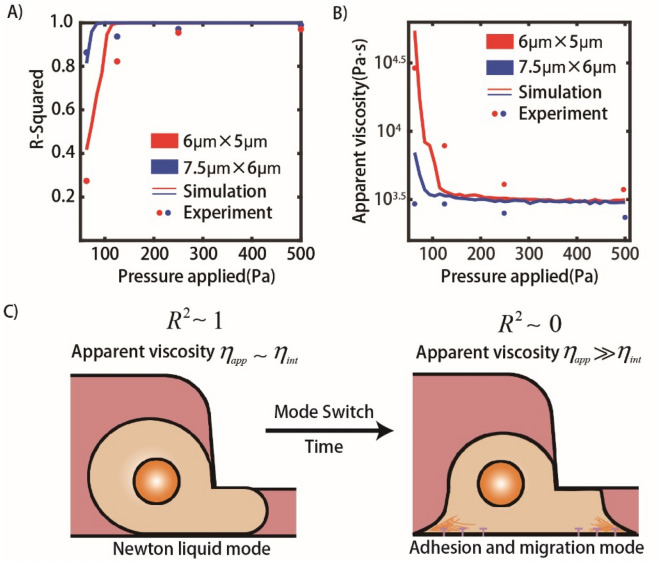
Circulating tumor cells (CTCs) survive in the bloodstream and then seed and invade to foster tumor metastasis. The arrest of cancer cells is favored by permissive flow forces and geometrical constraints. Through the use of high-throughput microfluidic devices designed to mimic capillary-sized vessels, we applied pressure differences to cancer cells (MCF-7 cell line) and recorded the cell traverse-vessel behaviors. Our results showed that cancer cells transform from a Newtonian droplet state to an adhesion/migration state when cancer cells traverse artificial vessels. To explain these phenomena, a modified Newtonian droplet model was also proposed. These phenomena and the modified model may reveal how CTCs in the blood seed and invade vessels under suitable conditions.
© 2022. The Author(s).
Conflict of interest statement
The authors declare no competing interests.
Figures
Similar articles
-
Selective isolation of magnetic nanoparticle-mediated heterogeneity subpopulation of circulating tumor cells using magnetic gradient based microfluidic system.Biosens Bioelectron. 2017 Feb 15;88:153-158. doi: 10.1016/j.bios.2016.08.002. Epub 2016 Aug 2. Biosens Bioelectron. 2017. PMID: 27503409
-
A novel microfluidic model can mimic organ-specific metastasis of circulating tumor cells.Oncotarget. 2016 Nov 29;7(48):78421-78432. doi: 10.18632/oncotarget.9382. Oncotarget. 2016. PMID: 27191997 Free PMC article.
-
Label-free Separation of Circulating Tumor Cells Using a Self-Amplified Inertial Focusing (SAIF) Microfluidic Chip.Anal Chem. 2020 Dec 15;92(24):16170-16179. doi: 10.1021/acs.analchem.0c03920. Epub 2020 Nov 24. Anal Chem. 2020. PMID: 33232155
-
Recent Advances in Microfluidic Platforms Applied in Cancer Metastasis: Circulating Tumor Cells' (CTCs) Isolation and Tumor-On-A-Chip.Small. 2020 Mar;16(9):e1903899. doi: 10.1002/smll.201903899. Epub 2019 Nov 20. Small. 2020. PMID: 31747120 Review.
-
Detection of Circulating Tumor Cells Using Microfluidics.ACS Comb Sci. 2018 Mar 12;20(3):107-126. doi: 10.1021/acscombsci.7b00146. Epub 2018 Feb 2. ACS Comb Sci. 2018. PMID: 29363937 Review.
Cited by
-
Significance of circulating tumor cells in lung cancer: a narrative review.Transl Lung Cancer Res. 2023 Apr 28;12(4):877-894. doi: 10.21037/tlcr-22-712. Epub 2023 Mar 29. Transl Lung Cancer Res. 2023. PMID: 37197632 Free PMC article. Review.
-
Trade-off movement between hydraulic resistance escape and shear stress escape by cancer cells.Biophys J. 2025 Feb 4;124(3):528-539. doi: 10.1016/j.bpj.2024.12.021. Epub 2024 Dec 21. Biophys J. 2025. PMID: 39719013
References
-
- Rodriguez, M. L., McGarry, P. J. & Sniadecki, N. J. Review on cell mechanics: Experimental and modeling approaches. Appl. Mech. Rev.65(6), 060801-1–060801-41 (2013).
Publication types
MeSH terms
LinkOut - more resources
Full Text Sources
