. 2022 May 5;12(1):7339.
doi: 10.1038/s41598-022-11378-3.

Assessment of age, gender, and anxiety on ECG waveform morphology in a large population of domestic dogs

Affiliations

Assessment of age, gender, and anxiety on ECG waveform morphology in a large population of domestic dogs

Lisa Murphy et al. Sci Rep. .

Abstract

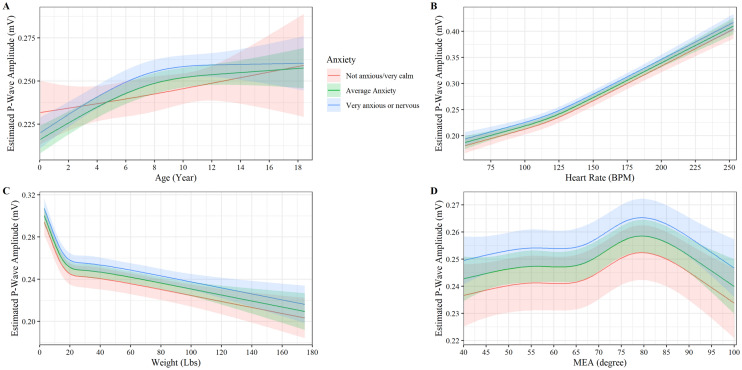
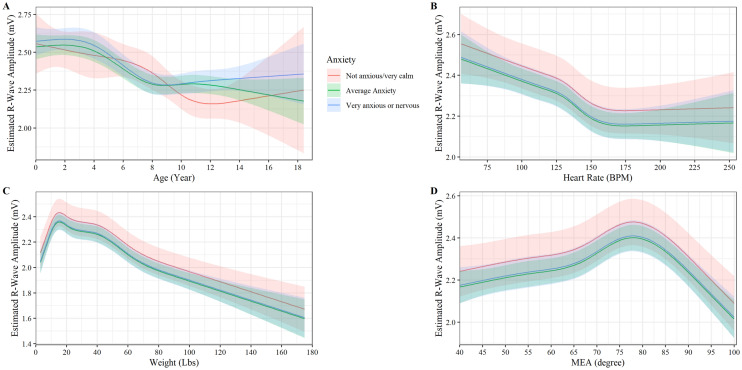
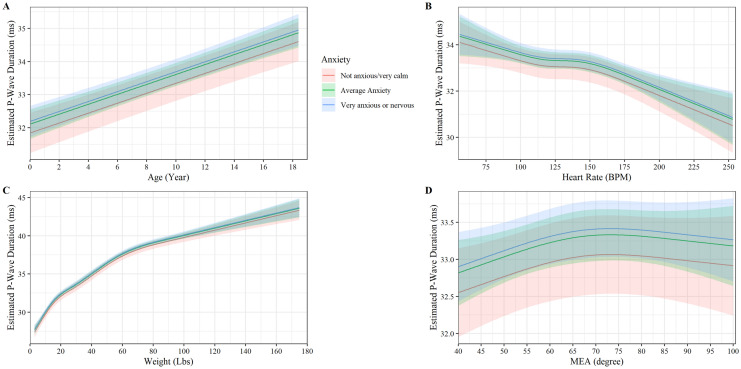
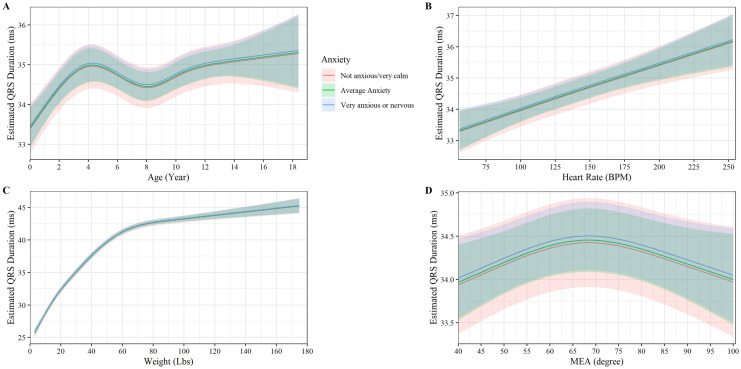
Cardiovascular diseases are major causes of death in the western world and this incidence increases in the elderly population. With aging, there are physiologic changes to the cardiac structure secondary to adipose tissue deposition, calcification of valve leaflets and changes in the structure of the heart including atrial remodeling. Such changes can make the myocardium more susceptible to stress leading to a higher prevalence of cardiovascular diseases in the aging population. Studies in healthy humans have shown that these structural and molecular changes in the heart are manifested as changes on an electrocardiogram (ECG). Using animal models, similar ECG changes have been found in guinea pigs, rabbits, and mice. No veterinary study has specifically evaluated if comparable aging changes occur in canine species. In this cross-sectional retrospective study, 12,026 ECGs from apparently healthy dogs were obtained and evaluated. Age was observed to have both linear and non-linear associations with multiple ECG variables, including P wave amplitude and duration, R amplitude and QRS duration. This study confirmed that, like humans, there may be ECG changes secondary to normal physiological cardiac aging. Further studies are warranted to confirm and elaborate on these findings as canines may be a useful model for cardiac aging in humans.


Conflict of interest statement

The author's RN, JG-S, AS, and DS are affiliated with the commercial funders of this research, as employees of IDEXX Laboratories.

Figures

Figure 1
Figure 1
Plot of the p-wave amplitude (mV) versus (A) age, (B) heart rate, (C) weight, and (D) MEA by anxiety. The y axis shows the estimated p-wave amplitude from the fully adjusted model for observed values while holding the values of covariates at their referent values. The curves display the trend in p-wave amplitude with increase age, heart rate, weight, and MEA. Shaded regions represent the 95% confidence interval of the prediction estimates from the regression model.
Figure 2
Figure 2
Plot of the r-wave amplitude (mV) versus (A) age, (B) heart rate, (C) weight, and (D) MEA by anxiety. The y axis shows the estimated r-wave amplitude from the fully adjusted model for observed values while holding the values of covariates at their referent values. The curves display the trend in r-wave amplitude with increase age, heart rate, weight, and MEA. Shaded regions represent the 95% confidence interval of the prediction estimates from the regression model.
Figure 3
Figure 3
Plot of the p-wave duration (ms) versus (A) age, (B) heart rate, (C) weight, and (D) MEA by anxiety. The y axis shows the estimated p-wave duration from the fully adjusted model for observed values while holding the values of covariates at their referent values. The curves display the trend in p-wave duration with increase age, heart rate, weight, and MEA. Shaded regions represent the 95% confidence interval of the prediction estimates from the regression model.
Figure 4
Figure 4
Plot of the QRS-wave duration (ms) versus (A) age, (B) heart rate, (C) weight, (D) MEA by anxiety. The y axis shows the estimated QRS -wave duration from the fully adjusted model for observed values while holding the values of covariates at their referent values. The curves display the trend in QRS-wave duration with increase age, heart rate, weight, and MEA. Shaded regions represent the 95% confidence interval of the prediction estimates from the regression model.

Similar articles

Cited by

References

    1. Kosić LS, Trailović D, Krstić N. Age-dependent electrocardiographic and echocardiographic changes in German Shepherd dogs. Iran. J. Vet. Res. 2017;18:43. - PMC - PubMed
    1. Rossi S, et al. The effect of aging on the specialized conducting system: a telemetry ECG study in rats over a 6 month period. PLoS ONE. 2014;9:e112697. doi: 10.1371/journal.pone.0112697. - DOI - PMC - PubMed
    1. Sorrentino A, et al. Myocyte repolarization modulates myocardial function in aging dogs. Am. J. Physiol. Heart Circ. Physiol. 2016;310:H873–H890. doi: 10.1152/ajpheart.00682.2015. - DOI - PMC - PubMed
    1. Keller KM, Howlett SE. Sex differences in the biology and pathology of the aging heart. Can. J. Cardiol. 2016;32:1065–1073. doi: 10.1016/j.cjca.2016.03.017. - DOI - PubMed
    1. New SE, Aikawa E. Cardiovascular Calcification–An Inflammatory Disease. Circ. J. 2011;75:1305–1313. doi: 10.1253/circj.CJ-11-0395. - DOI - PubMed