. 2022 May;24(5):685-696.
doi: 10.1038/s41556-022-00906-y. Epub 2022 May 5.

Enhancer selection dictates gene expression responses in remote organs during tissue regeneration

Affiliations

Enhancer selection dictates gene expression responses in remote organs during tissue regeneration

Fei Sun et al. Nat Cell Biol. 2022 May.

Abstract

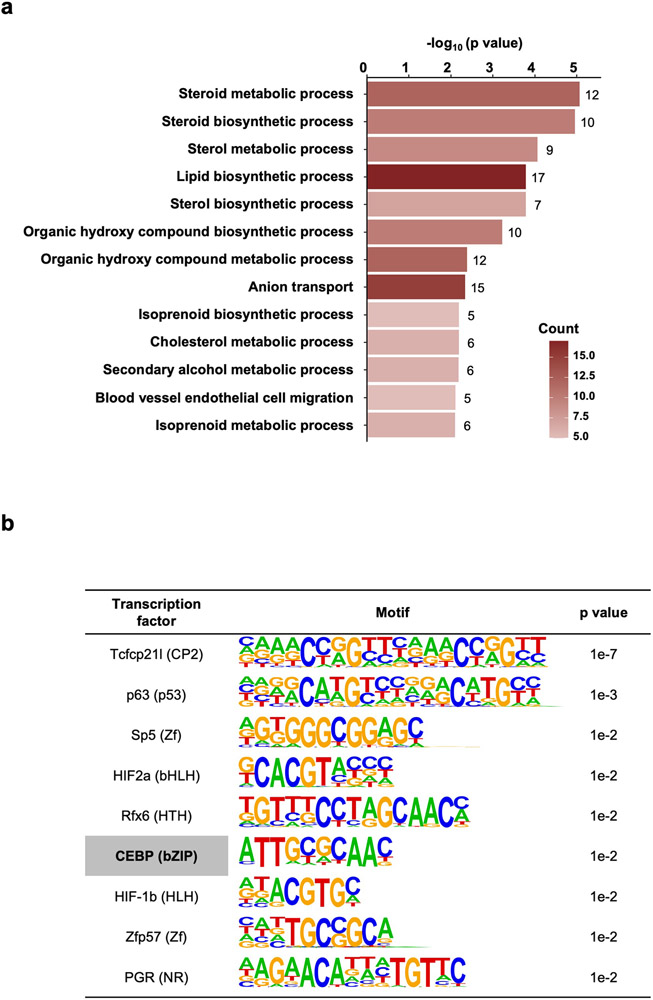
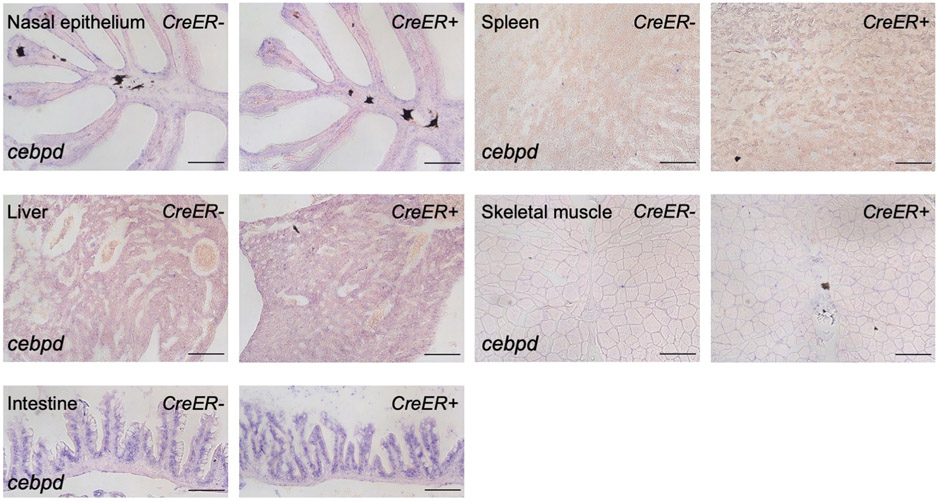
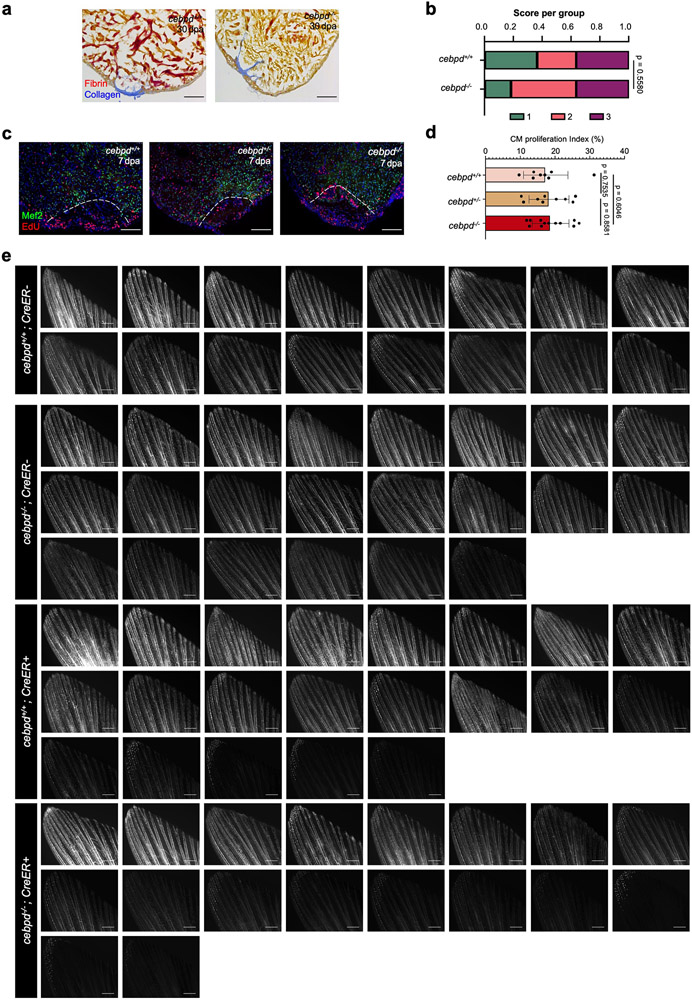
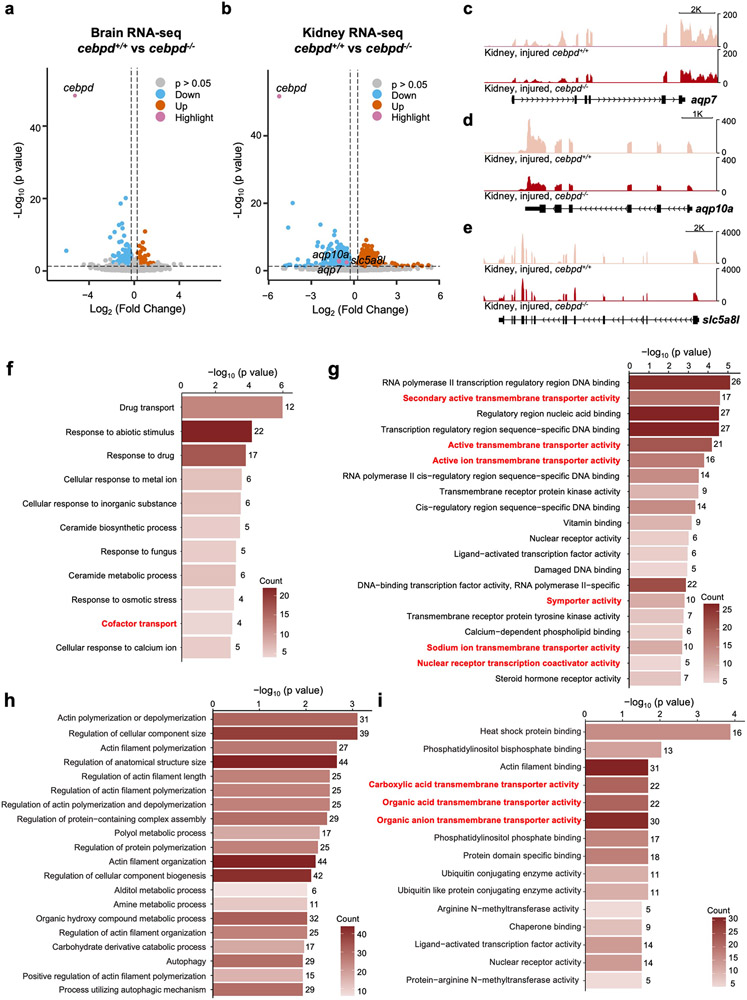
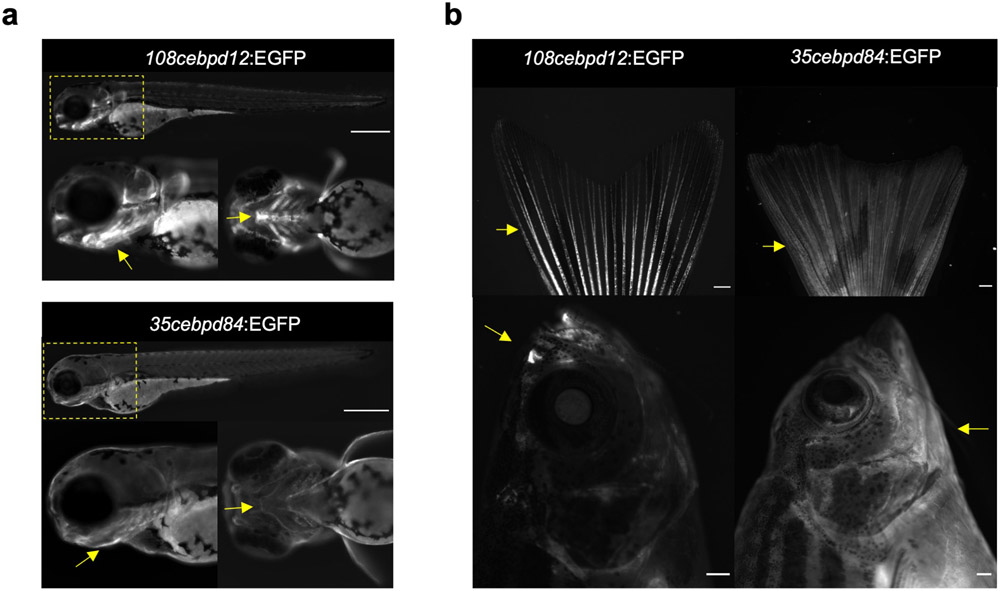
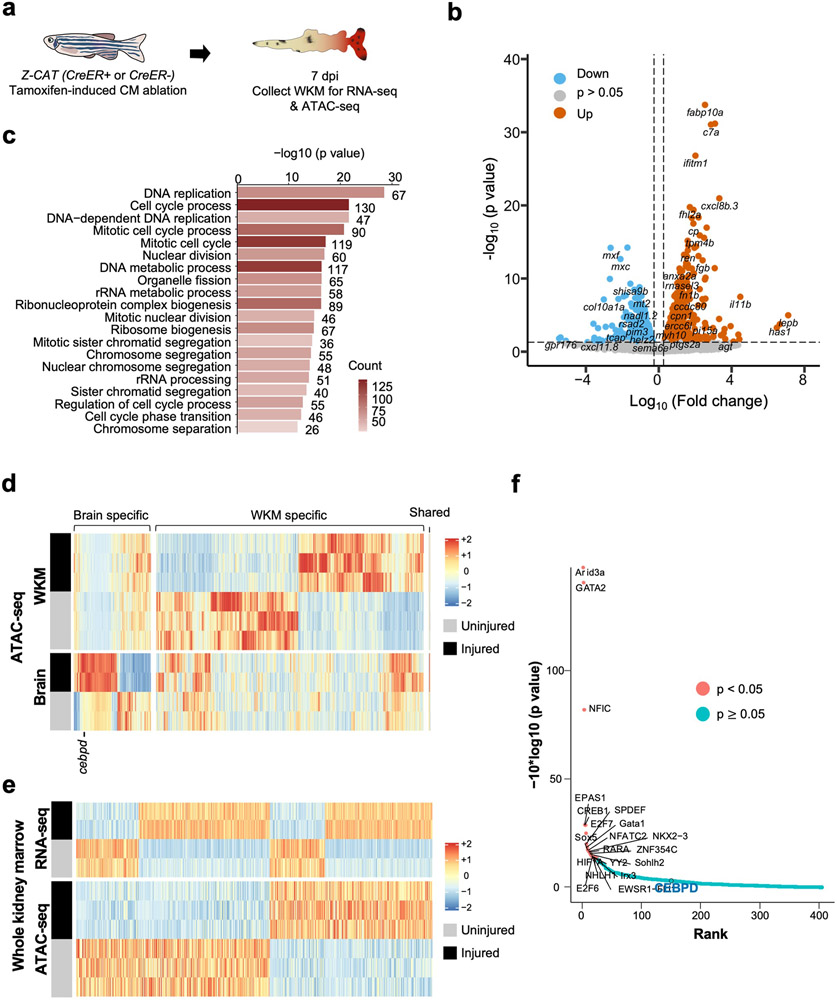
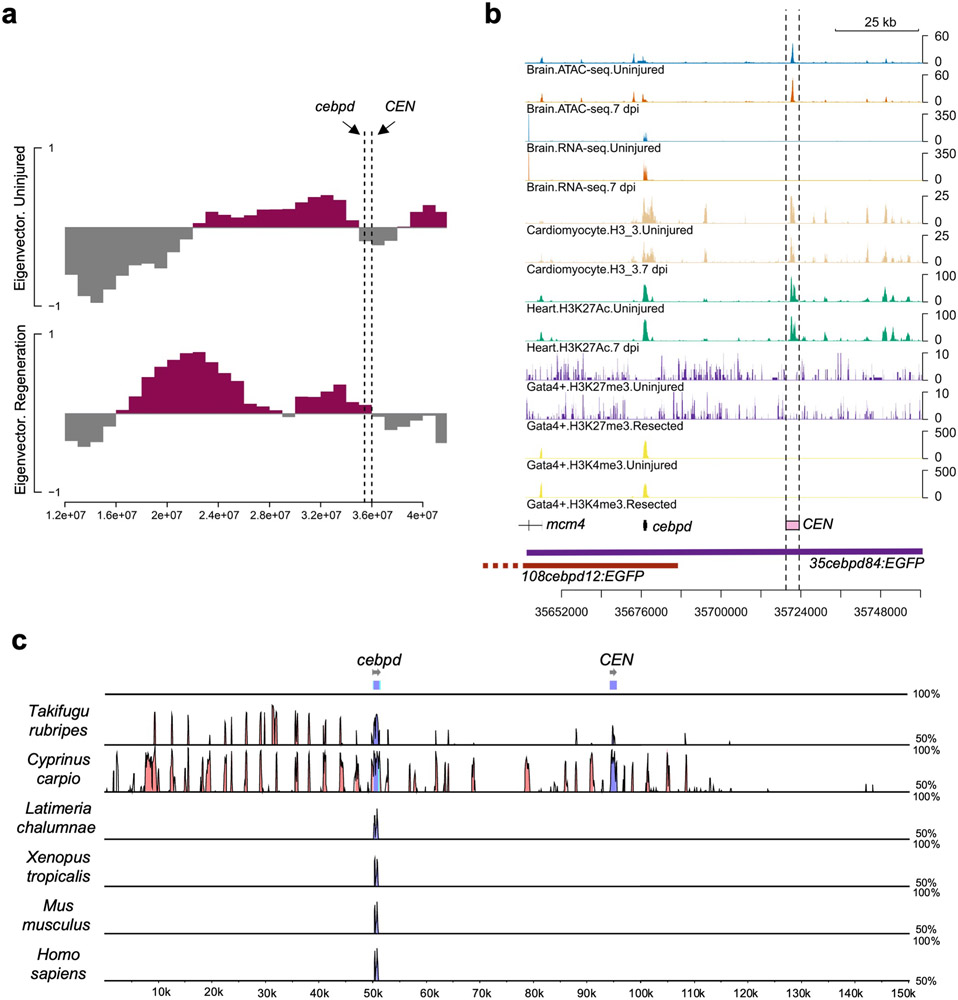
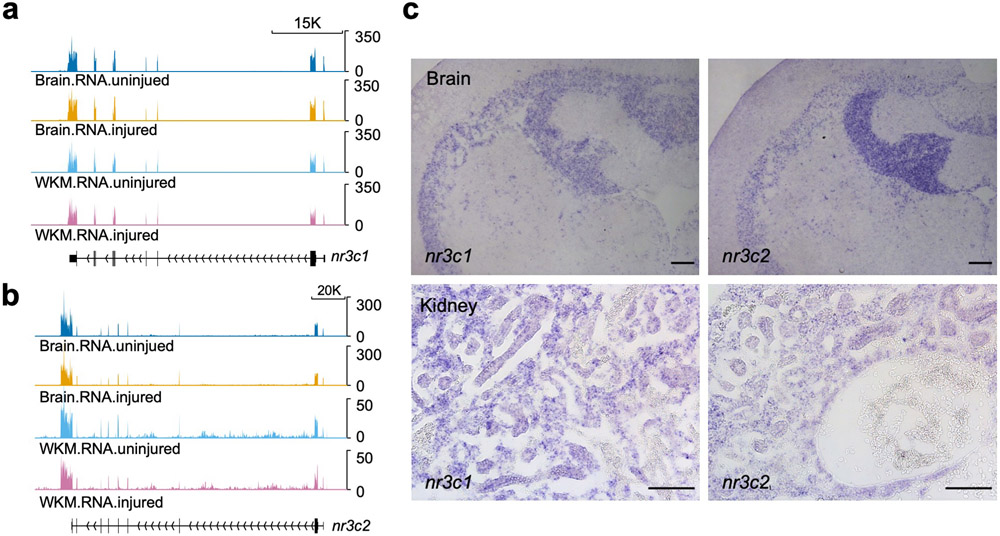
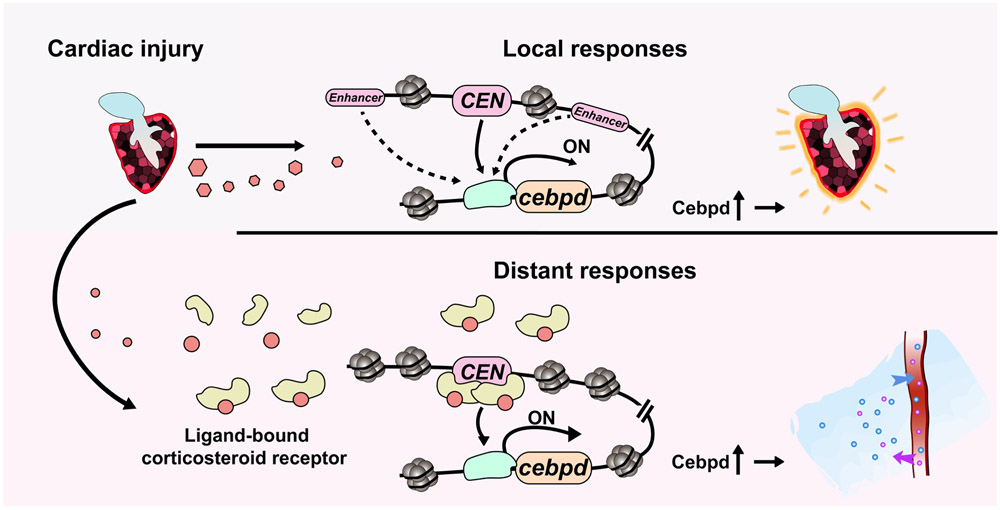
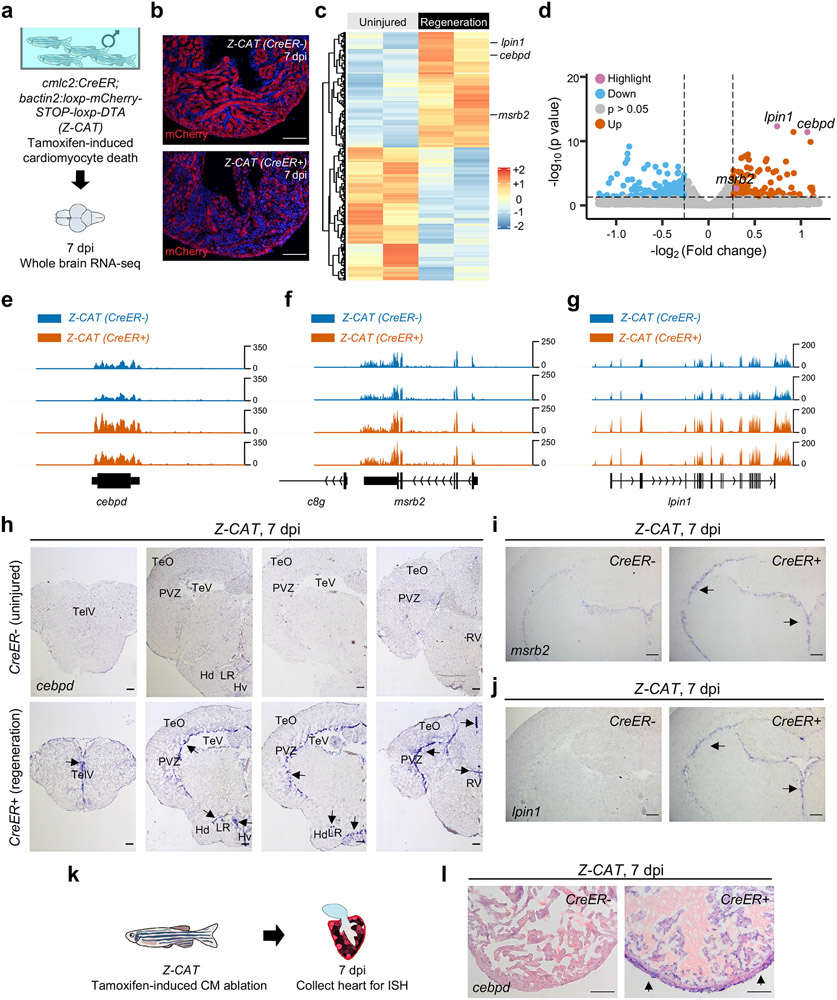
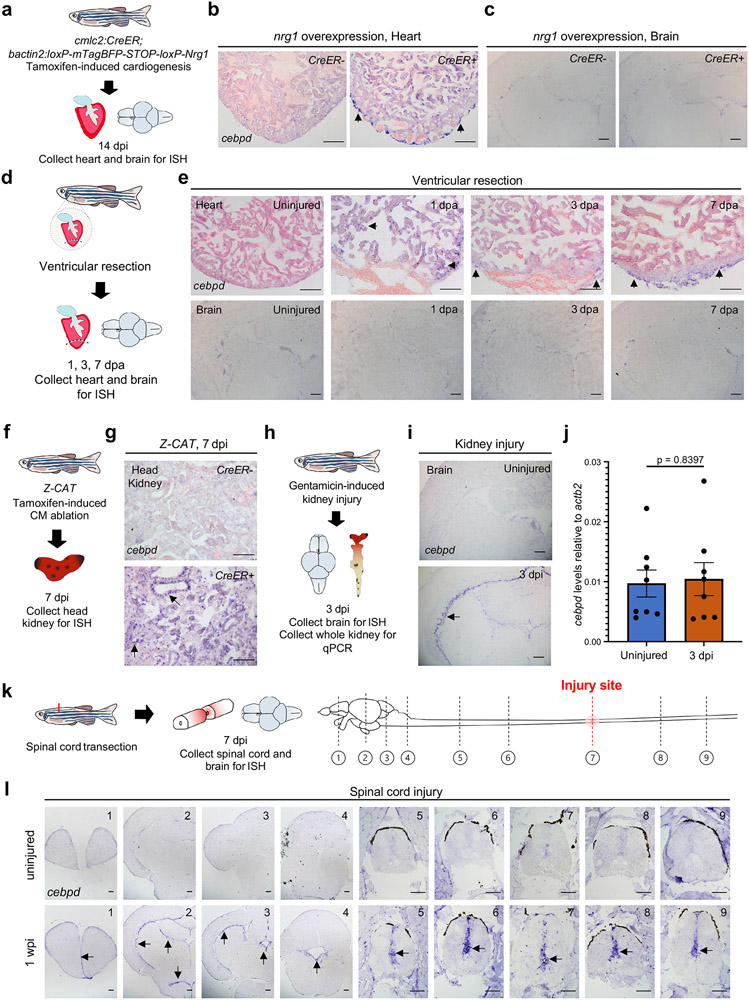
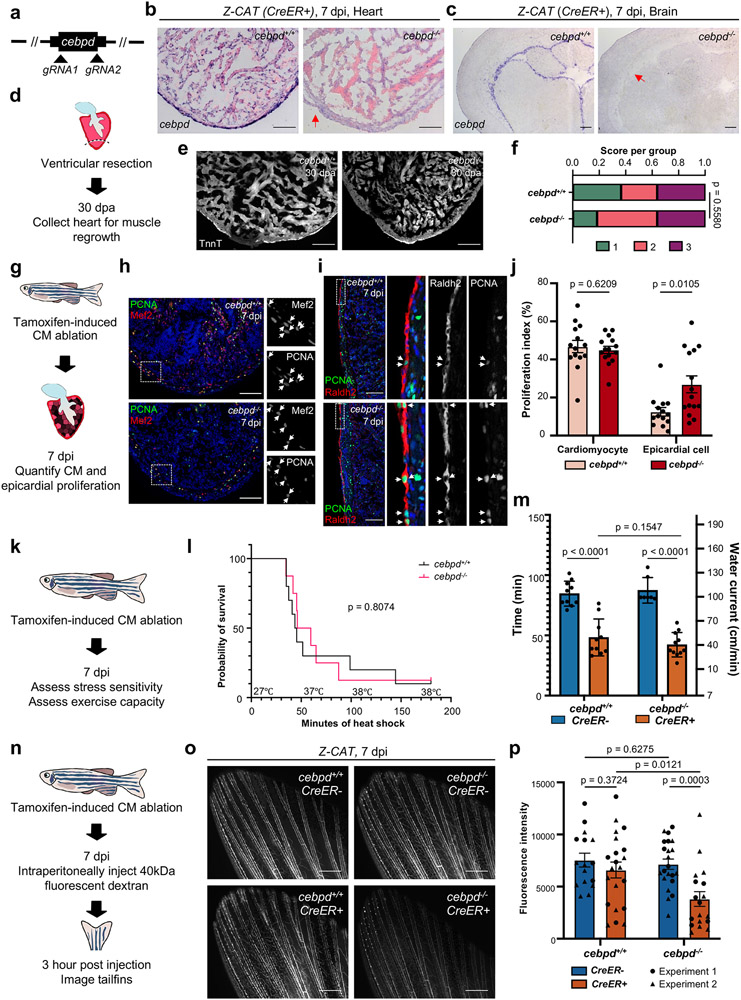
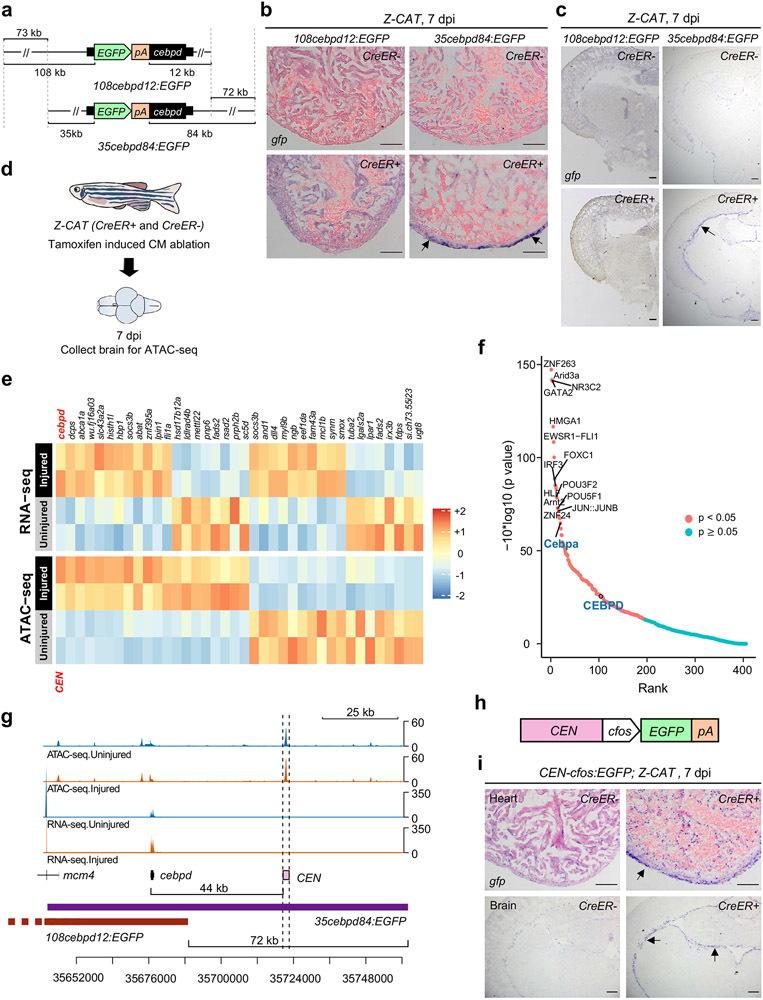
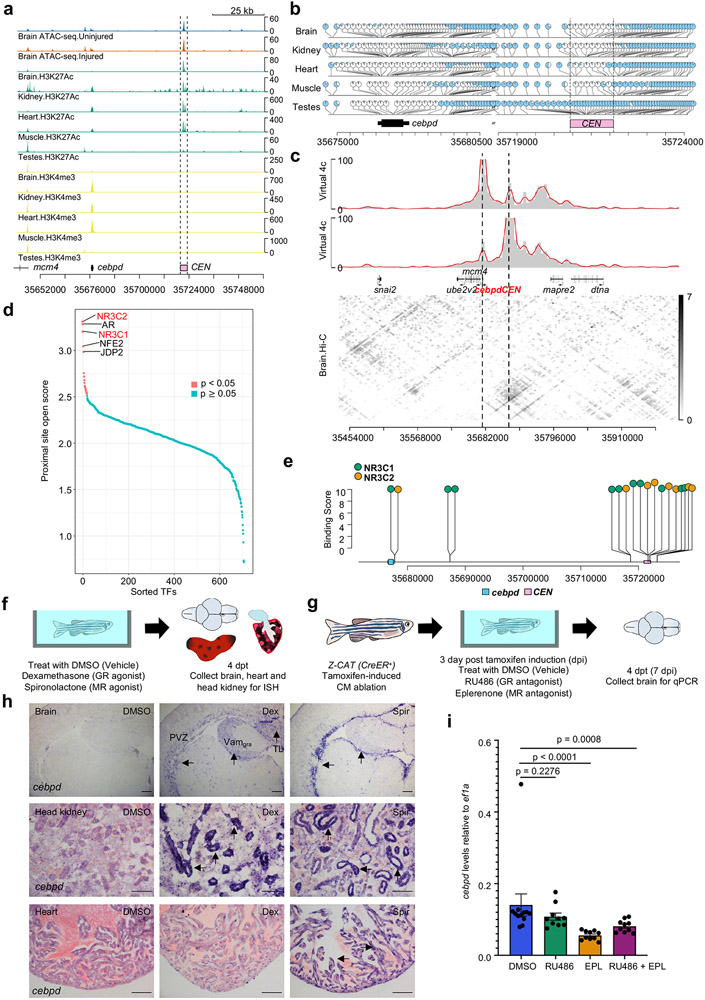
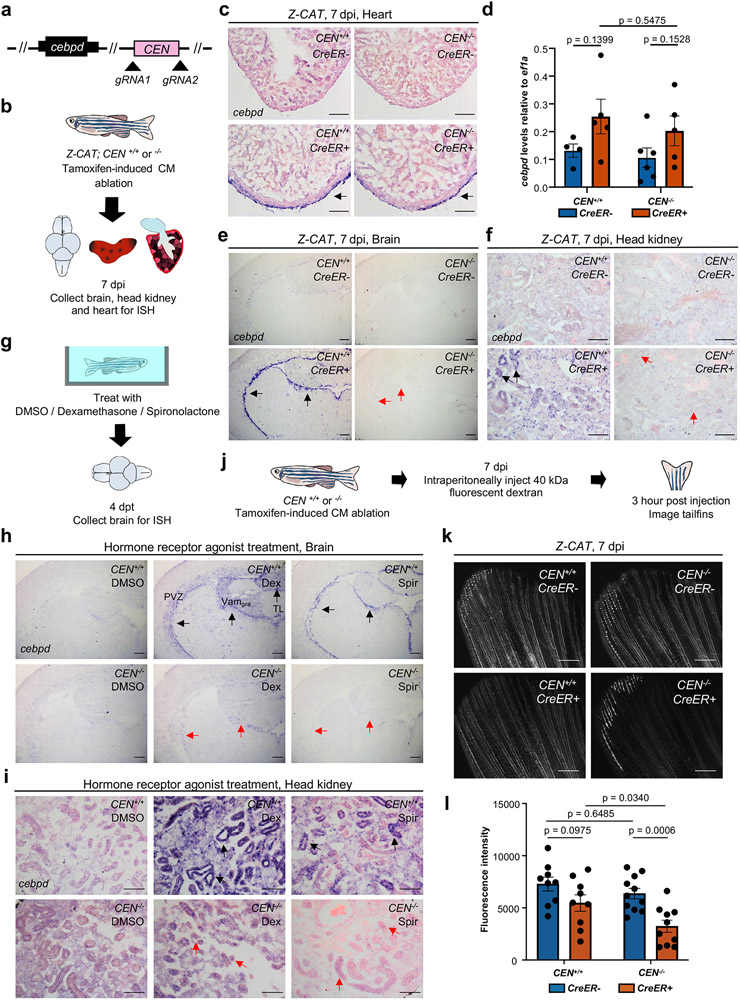
Acute trauma stimulates local repair mechanisms but can also impact structures distant from the injury, for example through the activity of circulating factors. To study the responses of remote tissues during tissue regeneration, we profiled transcriptomes of zebrafish brains after experimental cardiac damage. We found that the transcription factor gene cebpd was upregulated remotely in brain ependymal cells as well as kidney tubular cells, in addition to its local induction in epicardial cells. cebpd mutations altered both local and distant cardiac injury responses, altering the cycling of epicardial cells as well as exchange between distant fluid compartments. Genome-wide profiling and transgenesis identified a hormone-responsive enhancer near cebpd that exists in a permissive state, enabling rapid gene expression in heart, brain and kidney after cardiac injury. Deletion of this sequence selectively abolished cebpd induction in remote tissues and disrupted fluid regulation after injury, without affecting its local cardiac expression response. Our findings suggest a model to broaden gene function during regeneration in which enhancer regulatory elements define short- and long-range expression responses to injury.


Figures

Extended Data Fig. 1
Extended Data Fig. 1. Bioinformatic analysis of brain RNA-seq during cardiac regeneration.
a, Gene Ontology analysis demonstrating biological pathways with gene enrichment. p < 0.05. Counts indicate the number of genes with significantly changed expression in each biological pathway. b, HOMER analysis demonstrating enriched transcription factor binding motifs at the promoter regions (upstream 2 kb to downstream 500 bp) of genes with increased brain RNA levels during heart regeneration.
Extended Data Fig. 2
Extended Data Fig. 2. Expression of cebpd is not induced in several tissues in adult zebrafish during heart regeneration.
ISH on sections of nasal epithelium, spleen, liver, skeletal muscle, and intestine, indicating that cebpd expression is not noticeably induced in these tissues during heart regeneration. Tissues were harvested 7 days after tamoxifen administration, which induced CM ablation in CreER+ animals. n = 10 animals for all groups. Scale bars: 100 μm.
Extended Data Fig. 3
Extended Data Fig. 3. Cardiac muscle regeneration and fluid regulation in cebpd mutant animals.
a, Representative sections of cardiac ventricles 30 days after resection (dpa) in wild-type and cebpd−/− animals, stained with AFOG. Scale bar: 100 μm. n reported in (b). b, Semiquantitative assessment of cardiac injuries based on muscle and scar morphology, indicating no significant difference between cebpd−/− animals and their wild-type siblings. 1: Robust regeneration. 2: Partial regeneration 3: Blocked regeneration. A single trial was performed, with n = 11 animals for each group. Data were analyzed using a Fisher’s exact test. c, Sections of 7 days post resection (dpa) ventricles staining with markers for CM nuclei (Mef2; green) and cell cycle entry (EdU; red). Dashed lines outline the approximate resection injury site. Scale bars: 100 μm. d, Quantification of the CM cycling index at 7 dpa indicating no significant differences in cebpd knockout animals compared to their wild-type siblings. A single trial was performed with n = 8 cebpd+/+animals, 9 cebpd+/− animals, and 12 cebpd−/− animals. Mean ± s.d.. Data were analyzed using an unpaired two-tailed Student’s t-test. e, Fluorescence images of tailfin vasculature indicating that significantly less fluorescent dextran was able to reach the circulatory system of cebpd−/− fish after cardiac injuries. Data are quantified in Fig. 3. n = 16 CreER− and 21 CreER+ animals for cebpd+/+, and n = 22 CreER− and 18 CreER+ animals for cebpd−/−. Scale bars: 500 μm.
Extended Data Fig. 4
Extended Data Fig. 4. Transcriptome profiling of cebpd mutant brain and kidney during heart regeneration.
a,b, Volcano plot showing differential gene expression in the cebpd−/− brain (a) and kidney (b) during heart regeneration. 521 genes (158 genes increased and 363 genes decreased) and 1662 genes (787 increased and 875 decreased) were differentially regulated in the brain and kidney of cebpd−/− animals, respectively. Full lists of differentially expressed genes are shown in Supplementary Tables 2 and 3. Pink dots: highlighted genes. Blue dots: genes with decreased RNA levels (p < 0.05, FC < −1.2). Grey dots: genes with no significant changes. Orange dots: genes with increased RNA levels (p < 0.05, FC > 1.2). c, RNA-seq browser track of aqp7 showing decreased transcript levels of aqp7 (Log2FC = −1.062, p = 0.0012) in cebpd−/− kidney during heart regeneration. d, RNA-seq browser track of aqp10a showing decreased transcript levels of aqp10a (Log2FC = −1.045, p = 0.0020) in cebpd−/− kidney during heart regeneration. e, RNA-seq browser track of slc5a8l showing decreased transcript levels of slc5a8l (Log2FC = −0.515, p = 0.0034) in cebpd−/− kidney during heart regeneration. f,g, Gene Ontology analysis of differentially expressed genes in cebpd−/− brain during heart regeneration demonstrating top biological pathways (f) and molecular functions (g) with gene enrichment. Counts indicate the number of genes with significantly changed expression in Gene Ontology term. h,i, Gene Ontology analysis of differentially expressed genes in cebpd−/− kidney during heart regeneration demonstrating top biological pathways (h) and molecular functions (i) with gene enrichment. Counts indicate the number of genes with significantly changed expression in Gene Ontology term.
Extended Data Fig. 5
Extended Data Fig. 5. Two BAC sequences direct distinct gene expression patterns in zebrafish.
a, Two BAC transgenic lines show distinct larval EGFP fluorescence patterns. Boxed area is magnified on bottom left, and a magnified dorsal view is shown on bottom right. 108cebpd12:EGFP is prominent in skeleton and strong in jaw, indicated by yellow arrows. 35cebpd84:EGFP is weak in skin with low expression in jaw, indicated by yellow arrows. Scale bars: 500 μm. This expression is consistent in all animals used in this study. b, Two BAC transgenic lines show distinct adult EGFP fluorescence patterns. 108cebpd12:EGFP is strong in caudal fin rays and nasal cavity, indicated by yellow arrows. 35cebpd84:EGFP is weak in skin, indicated by yellow arrows. Scale bars: 500 μm. This expression is consistent in all animals used in this study.
Extended Data Fig. 6
Extended Data Fig. 6. Transcriptome and epigenetic analysis of whole kidney marrow.
a, Schematic of CM ablation and whole kidney marrow (WKM) collection for RNA-seq and ATAC-seq. b, Volcano plot showing differential gene expression in WKM after cardiac injury. Blue dots: genes with decreased RNA levels (p < 0.05, FC < −1.2). Grey dots: genes without significant changes. Orange dots: genes with increased RNA levels (p < 0.05, FC > 1.2). c, Gene ontology analysis of top biological pathways with gene enrichment. p < 0.05. Counts indicate the number of genes with significantly changed expression in each biological pathway. d, Heatmap of chromatin regions with changes in accessibility in the brain and kidney after CM ablation. p < 0.05. e, Heatmaps of RNA-seq and ATAC-seq data representing putative enhancer elements linked to genes with significant transcriptional changes in WKM after a cardiac injury. f, BiFET analysis indicating enriched transcription factor binding to open regions in WKM chromatin regions cardiac injury. Red: p < 0.05. Blue: p ≥ 0.05.
Extended Data Fig. 7
Extended Data Fig. 7. Epigenetic feature of CEN and its sequence conservation across species.
a, A/B compartment analysis indicates a chromatin B to A compartment switch at cebpd and CEN loci. Dashed lines indicate cebpd and CEN region. b, Browser tracks indicating assays from this study and others. Brain ATAC-seq and Brain RNA-seq, uninjured and 7 days after CM ablation (7 dpi; this study); CM H3.3 occupancy, uninjured and 7 dpi (GSE81862); H3K27Ac occupancy, uninjured and 7 dpi (GSE75894); H3K27me3 and H3K4me3 occupancy in ventricular Gata4+ CMs, uninjured and 5 days post resection (GSE96928). Dashed lines indicate CEN. c, mVista plot of genomic regions around cebpd indicating high conservation of zebrafish CEN with cyprinid fish and low conservation with amphibians and mammals. Calculation window = 100 bp, conservation identity = 70%.
Extended Data Fig. 8
Extended Data Fig. 8. Expression of corticosteroid receptors in the brain and kidney.
a,b, RNA-seq browser track of nr3c1 (a) and nr3c2 (b) indicating that expression of nr3c1 in both brain and WKM are not significantly changed during heart regeneration, indicated as “injured” in tracks. c, ISH on sections of brain and kidney from uninjured animals demonstrating nr3c1 and nr3c2 expression in multiple regions including ependymal cells and renal tubules. n = 5 animals for each group. Scale bar: 100 μm.
Extended Data Fig. 9
Extended Data Fig. 9. CEN is required for fluid homeostasis during heart regeneration.
Fluorescence images of tailfin vasculature indicating that less fluorescent dextran transferred to the circulatory system of CEN−/− fish after cardiac injuries. A single trial with n = 9 animals for both groups of CEN+/+, and n = 11 CreER− and n = 10 CreER+ animals for CEN−/− animals, was performed. Data are quantified in Fig. 6. Scale bars: 500 μm.
Extended Data Fig. 10
Extended Data Fig. 10. Model describing CEN element functions in local and remote tissues.
(Top) Cardiac injury induces cebpd expression locally, regulating epicardial activation during heart regeneration. CEN is sufficient but not required for directing local cebpd induction, likely due to existence of redundant enhancers. (Bottom) Cardiac injury leads to transcriptionally activated corticosteroid receptors in remote tissues. CEN exists in an open, permissive structure, topologically close to its promoter and poised for corticosteroid receptor binding. Ligand-bound corticosteroid receptors trigger CEN-directed cebpd expression in distant tissues, contributing to fluid homeostasis in animals undergoing injury-induced regeneration.
Fig. 1:
Fig. 1:. cebpd is induced in local and remote tissues during heart regeneration.
a, Schematic of profiling whole brain transcriptomes after cardiomyocyte (CM) ablation. b, Heart sections from uninjured control fish (top; CreER−) and those with both injury transgenes (bottom; CreER+) at 7 days post tamoxifen incubation (dpi). c, Heat map of genes with changes in the brain during heart regeneration. p < 0.05, Fold change (FC) > 1.2. d, Volcano plot showing differential gene expression in the brain during heart regeneration. Pink dots: highlighted genes. Blue dots: genes with decreased RNA levels (p < 0.05, FC < −1.2). Grey dots: genes with no significant changes. Orange dots: genes with increased RNA levels (p < 0.05, FC > 1.2). e, RNA-seq browser track of cebpd showing increased brain cebpd transcript levels during heart regeneration. Brains from 10 individuals were pooled as one sample for RNA-seq. TPM = 8.65 and 6.94 for CreER− and 18.54 and 14.49 for CreER+. f,g, RNA-seq browser tracks of msrb2 and lpin1, showing increased brain transcript levels during heart regeneration. Data represent the average of two biological replicates in each experimental group. Tissues from 10 animals were pooled as one biological replicate. h, ISH of cebpd on cross sections of the brain indicating induction in the ependymal cell layer during heart regeneration. TelV: telencephalic ventricle. TeO: tectum opticum. TeV: tectal ventricle. PVZ: periventricular gray zone. LR: lateral recess of diencephalic ventricle. Hd: dorsal zone of periventricular hypothalamus. Hv: ventral zone of the periventricular hypothalamus. RV: rhombencephalic ventricle. n= 57 CreER− and 48 CreER+ animals. Optic tectum is subsequently used as an indication of cebpd induction in brain. Arrows indicate violet ISH signals. i,j, ISH of msrb2 and lpin1 on cross sections of the brain indicating induction in ependymal tissue during heart regeneration. n = 13 animals for each group. k, Schematic of inducing CM ablation and assessment of cardiac cebpd expression. l, ISH on heart sections indicating the induction of cebpd in epicardium and associated peripheral cells during heart regeneration. n = 20 CreER− and 43 CreER+ animals. Scale bars for a, b, h-j, l: 100 μm.
Fig. 2:
Fig. 2:. cebpd expression features with different stimuli and in various tissues.
a, Schematic of induced cardiogenesis and tissue collection for cebpd ISH. b, ISH on heart sections indicating cebpd induction in epicardium during cardiogenesis. Arrows indicate violet ISH signals. n = 5 animals for both groups. c, ISH on brain sections indicating little or no cebpd induction in brain during induced cardiogenesis. n = 10 animals for both groups. d, Schematic of cardiac injury and tissue collection for cebpd ISH. e, (Top) ISH on resected hearts demonstrating cebpd induction in CMs at 1 dpa and in epicardium at 3 and 7 dpa. (Bottom) ISH on brain sections indicating little or no cebpd induction in brain after ventricular resection. For heart ISH, n = 5 animals for uninjured control, 1, 3 and 7 dpa. For brain ISH, n = 10 animals for uninjured, n = 15 animals for 1, 3 and 7 dpa. f, Schematic of CM ablation and head kidney collection for cebpd ISH. g, ISH of cebpd on kidney sections after CM ablation. cebpd is induced in kidney tubules after CM ablation. n = 8 CreER− and 9 CreER+ animals. h, Schematic of acute kidney injury and collection of brain for cebpd ISH and whole kidney for qPCR. i, ISH on brain sections indicating cebpd induction in optic tectum ependyma after kidney injury. n = 10 animals for uninjured and for 3 dpi. j, Quantitative PCR indicating no cebpd induction in kidney after kidney injury. n = 8 animals for both uninjured and 3 dpi. Mean ± S.E.M., Unpaired two tailed t-test was used to calculate p-values. k, Schematic of spinal cord transection and tissue collection for cebpd ISH. Diagrams illustrate the relative position of brain and spinal cord cross sections (in panel (l)) to the injury site. l, ISH on tissue cross sections, indicating cebpd induction in ependymal cells in the injured spinal cord and the brain. n = 15 animals for uninjured and n = 10 animals for 1 wpi. Dashed lines outline the central canal. Scale bars in b, c, e, g, i, l: 100 μm.
Fig. 3:
Fig. 3:. Local and remote Cebpd requirements during heart regeneration.
a, Schematic of cebpd deletion. b,c, cebpd transcript is undetectable in cebpd−/− hearts and brains by ISH after genetic CM ablation. Red arrow indicates loss of ISH signals in cebpd−/− tissues. Loss of cebpd expression was confirmed for all experiments performed with cebpd/− animals. d, Schematic of cardiac regeneration study. e, Sections of cardiac ventricles in wild-type and cebpd−/− animals, stained with Troponin-T antibody. n reported in (f). f, Semiquantitative assessment of cardiac injuries. 1: Robust regeneration. 2: Partial regeneration 3: Blocked regeneration. Single trial with n = 11 animals for each group. Fisher’s exact test. g, Schematic of cardiac cell proliferation study. h, Sections of 7-day post CM ablation ventricles stained for CM nuclei (Mef2; Red) and cell cycling (PCNA; Green). White arrows indicate proliferating CMs. n reported in (j). i, Sections of 7-day post CM ablation ventricles stained for epicardium (Raldh2; Red) and cell cycling (PCNA; Green). Arrows indicate cycling epicardial cells. Single channel images of single confocal slice in greyscale. n reported in (j). j, Quantification of data from (h, i). Single trial with n = 14 cebpd+/+ and 15 cebpd−/− animals. Mean ± S.E.M., Two-tailed Mann Whitney test. k, Schematic of inducing CM ablation and assessment of heart failure. l, Survival curves of heat-stressed zebrafish during heart regeneration. Single trial with n = 10 cebpd+/+ and n = 8 cebpd−/− animals. Log-rank (Mantel-Cox) test. m, Assays for swim capacity during heart regeneration. Single trial with n = 11 CreER− and 10 CreER+ cebpd+/+ animals, and n = 7 CreER− and 11 CreER+ in cebpd−/− animals. Mean ± S.D., unpaired two-tailed Student’s t-test. n, Schematic of experiments assessing fluorescent dye transfer into vasculature. o, Fluorescence images indicating inefficient dye transfer in injured cebpd−/− animals. p, Quantification of experiments in (o). Two independent trials with n = 16 CreER− and 21 CreER+ cebpd+/+ animals, and n = 22 CreER− and 18 CreER+ cebpd−/− animals. Mean ± S.E.M., unpaired two-tailed t-test. Scale bars in b, c, e, h, i: 100 μm. Scale bars in o: 500 μm.
Fig. 4:
Fig. 4:. Profiling and transgenesis identify an enhancer downstream of cebpd that responds to injury.
a, Schematic of two cebpd:EGFP BAC transgenic constructs (108cebpd12:EGFP and 35cebpd84:EGFP) comprising different genomic regions surrounding cebpd. b, ISH on heart sections demonstrating gfp induction locally in 35cebpd84:EGFP hearts at 7 days after induced CM ablation (dpi). No gfp ISH signals were detected in uninjured or injured 108cebpd12:EGFP hearts. n = 10 CreER− and 11 CreER+ animals for 108cebpd12:EGFP, and n = 13 CreER− and 11 CreER+ animals for 35cebpd84:EGFP. Transgene expression was assayed by ISH (arrows indicate violet signals), as basal EGFP fluorescence in some tissues can reduce sensitivity. c, ISH showing induced gfp expression in 35cebpd84:EGFP brains after CM ablation. gfp ISH signals are not evident in 108cebpd12:EGFP brains after heart injury. n = 10 CreER− and 9 CreER+ animals for 108cebpd12:EGFP, and n = 9 animals for CreER− and CreER+ groups in 35cebpd84:EGFP. d, Schematic of CM ablation and brain collection for ATAC-seq. e, Heat maps of RNA-seq and ATAC-seq data representing putative enhancer elements linked to genes with significant transcriptional changes in the brain after a cardiac injury. The heatmap is rescaled by row using the pheatmap R package. f, BiFET analysis indicating enriched transcription factor motifs within brain open chromatin regions after cardiac injury. Red: p < 0.05. Blue: p ≥ 0.05. Peaks are analyzed based on hypergeometric distribution and p value was adjusted by Benjamin-Hochberg procedure. g, Browser track indicating chromatin accessibility (top: average of three samples) and transcript levels (average of two samples) at the cebpd locus, indicating the candidate cebpd-linked enhancer CEN with dashed lines. CEN is located 44 kb downstream of cebpd and increases accessibility after CM ablation. Fold change = 0.33, p = 0.008. h, Components of the CEN-cfos:EGFP transgene. i, ISH of gfp on heart and brain sections indicating the induction of gfp in injured CEN-cfos:EGFP hearts and brains after cardiac injury. n = 5 animals for CreER− and CreER+ groups. Scale bars in b, c, i: 100 μm.
Fig. 5:
Fig. 5:. Corticosteroid signals regulate distant cebpd expression during heart regeneration.
a, Browser tracks of brain ATAC-seq before and after CM ablation, and H3K27Ac and H3K4me3 occupancy of adult brain, kidney, heart muscle and testes. CEN (dashed lines) is open and associated with high levels of H3K27Ac and low levels of H3K4me3 in tissues other than testes. Three biologically independent samples are included for ATAC-seq, and two for ChIP-seq. b, Whole-genome bisulfite sequencing of samples from adult tissues indicating low methylation levels in CEN and cebpd gene regions, with highly methylation in testes. One biological sample for each group. c, Hi-C contact matrix and virtual 4C using the cebpd promoter (top) and CEN (bottom) as bait regions, indicating interactions between CEN and the cebpd gene region in brain. Hi-C data from two biological samples were pooled for each group. d, Footprint analysis reveals enriched binding for NR3C2, AR, and NR3C1 during cardiac regeneration. e, Lollipop plot illustrating predicted NR3C1 and NR3C2 binding sites near cebpd and CEN. f, Schematic of experiments assessing cebpd expression by ISH after agonist treatment. g, Schematic of experiments assessing cebpd expression by qPCR after cardiac injury and antagonist treatment. h, ISH of cebpd on brain (top), head kidney (middle) and heart (bottom) sections after agonist treatment. cebpd is consistently induced in brain and kidney, and only in occasional cases in heart by spironolactone. For brain and head kidney ISH, n = 19 for vehicle, 21 for dexamethasone, 25 for spironolactone. For heart ISH, n = 15 animals for each treatment. Eight of 15 spironolactone-treated animals displayed induction of cebpd expression in heart. Black arrows indicate violet ISH signals. Dex: dexamethasone, Spir: spironolactone. PVZ: periventricular grey zone, Vamgra: the granular layer of the medial division of valvula cerebelli, TL: torus longitudinalis. Black arrows indicate violet ISH signals. Scale bars: 100 μm. i, Quantitative PCR indicating lower cebpd RNA levels in brain after eplerenone, or RU486 plus eplerenone, treatments during heart regeneration. n = 12 animals for DMSO treatment and n = 10 animals for other groups. EPL: eplerenone. Mean ± S.E.M., two-tailed Mann Whitney test.
Fig. 6:
Fig. 6:. CEN is required for distant cebpd activation and fluid regulation after cardiac injury.
a, Schematic of CEN deletion. b, Schematic of CM ablation in wild-type or CEN−/− fish and tissue collection for cebpd ISH. c, ISH indicating normal cebpd induction in injured CEN−/− hearts. n = 6 animals for all groups. Arrows indicate ISH signals (violet). d, qPCR for cardiac cebpd RNA levels. n = 4 CreER− and 5 CreER+ biologically independent samples for CEN+/+ animals, and n = 6 CreER− and 5 CreER+ biologically independent samples for CEN−/− animals. Five hearts were pooled for each biological sample. Mean ± S.E.M., unpaired two tailed t-test. e, ISH indicating no cebpd induction in CEN−/− brains after cardiac injury. n = 22 CreER− and 20 CreER+ animals for CEN+/+, and n = 18 CreER− and 16 CreER+ animals for CEN−/−. Black arrows indicate ISH signals. Red arrows indicate loss of ISH signals. f, ISH indicating no cebpd indcution in CEN−/− kidneys by cardiac injury. Arrows as in (e). n = 8 CreER− and 9 CreER+ animals for CEN+/+, and n = 6 CreER− and 4 CreER+ animals for CEN−/−. g, Schematic of agonist treatment and tissue collection for cebpd ISH. h, ISH indicating that CEN is required for cebpd induction in brain by GR or MR agonists. n = 34 (vehicle), 36 (dexamethasone), 40 (spironolactone) animals for CEN+/+. n = 13, 8, and 17 animals for CEN−/−. Arrows as in (e). Abbreviations as in Fig.5. i, ISH indicating that CEN is required for cebpd induction in kidney by GR or MR agonists. Animal numbers as in (h). j, Schematic of experiments assessing fluorescent dye transfer into vasculature. k, Fluorescence images indicating inefficient dye transfer in injured CEN−/− animals. l, Quantification of experiments in (k). Single trial with n = 9 animals for both CEN+/+ groups, and n = 11 animals for CreER− and 10 animals for CreER+ in CEN−/− groups. Mean ± SEM, unpaired two-tailed t-test. Scale bars in c, e, f, h, i: 100 μm. Scale bars in k: 500 μm.

Similar articles

Cited by

References

    1. King RS & Newmark PA The cell biology of regeneration. Journal of Cell Biology 196, 553–562 (2012). - PMC - PubMed
    1. Lai S-L, Marín-Juez R & Stainier DYR Immune responses in cardiac repair and regeneration: a comparative point of view. Cellular and Molecular Life Sciences 76, 1365–1380 (2019). - PMC - PubMed
    1. González-Rosa JM, Burns CE & Burns CG Zebrafish heart regeneration: 15 years of discoveries. Regeneration 4, 105–123 (2017). - PMC - PubMed
    1. Goldman JA et al. Resolving Heart Regeneration by Replacement Histone Profiling. Dev Cell 40, 392–404.e395 (2017). - PMC - PubMed
    1. Poss KD, Wilson LG & Keating MT Heart regeneration in zebrafish. Science 298, 2188–2190 (2002). - PubMed

Publication types