. 2022 May;54(5):548-559.
doi: 10.1038/s41588-022-01057-4. Epub 2022 May 5.

Genetic architecture of 11 major psychiatric disorders at biobehavioral, functional genomic and molecular genetic levels of analysis

Collaborators, Affiliations

Genetic architecture of 11 major psychiatric disorders at biobehavioral, functional genomic and molecular genetic levels of analysis

Andrew D Grotzinger et al. Nat Genet. 2022 May.

Abstract

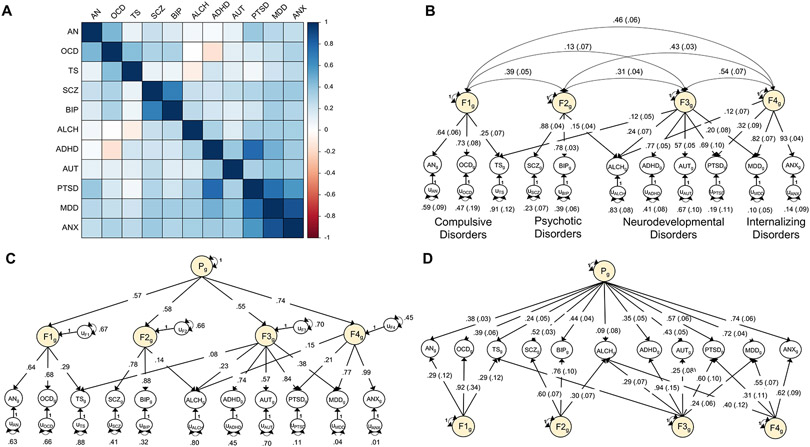
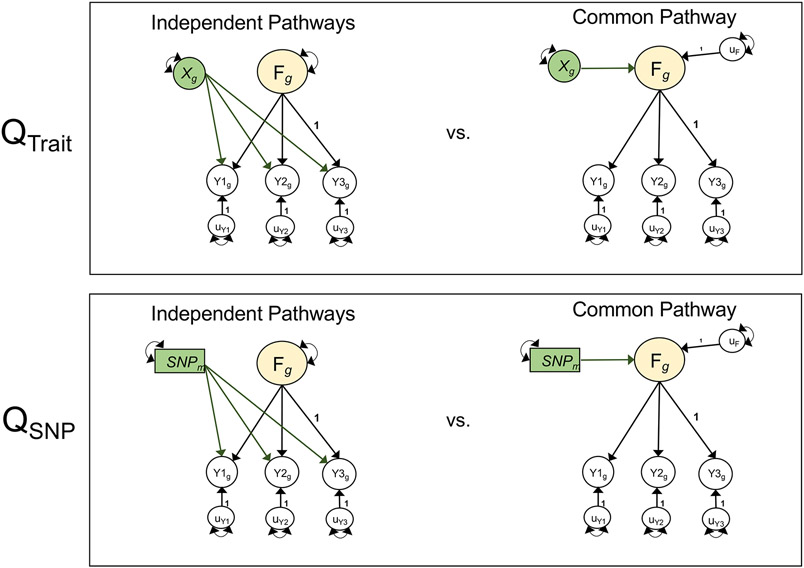
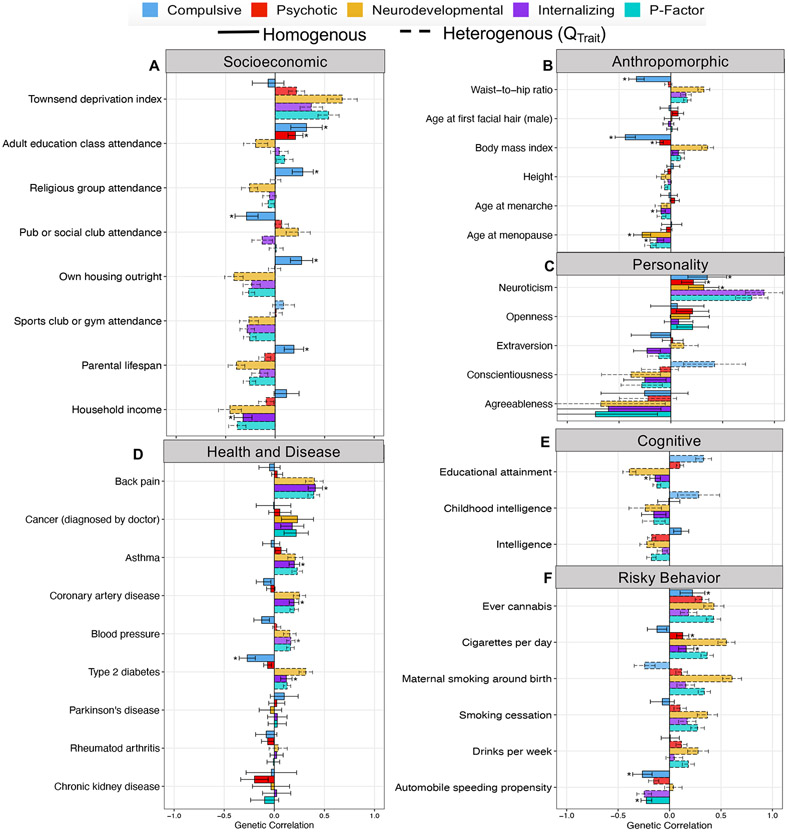
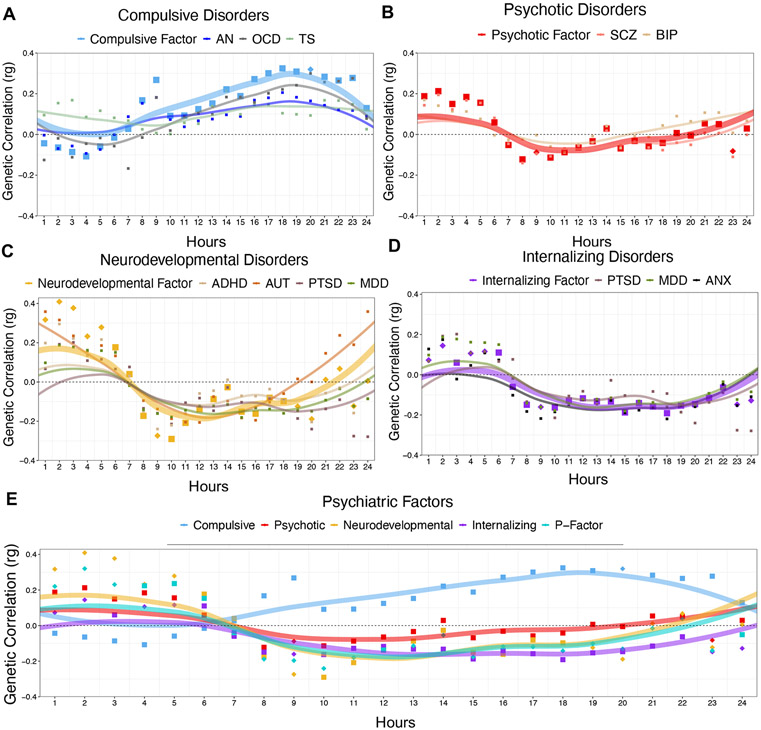
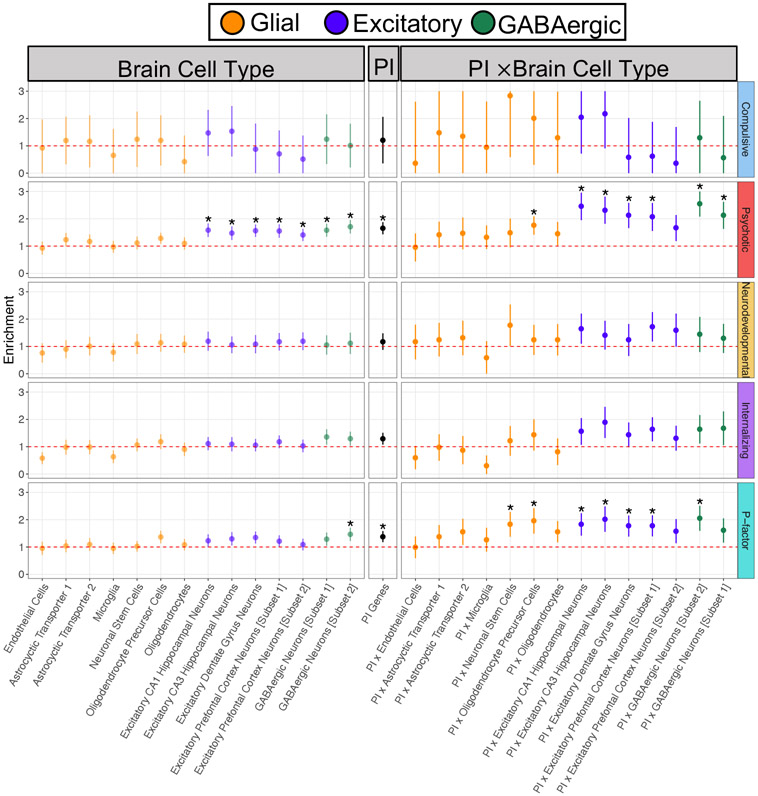
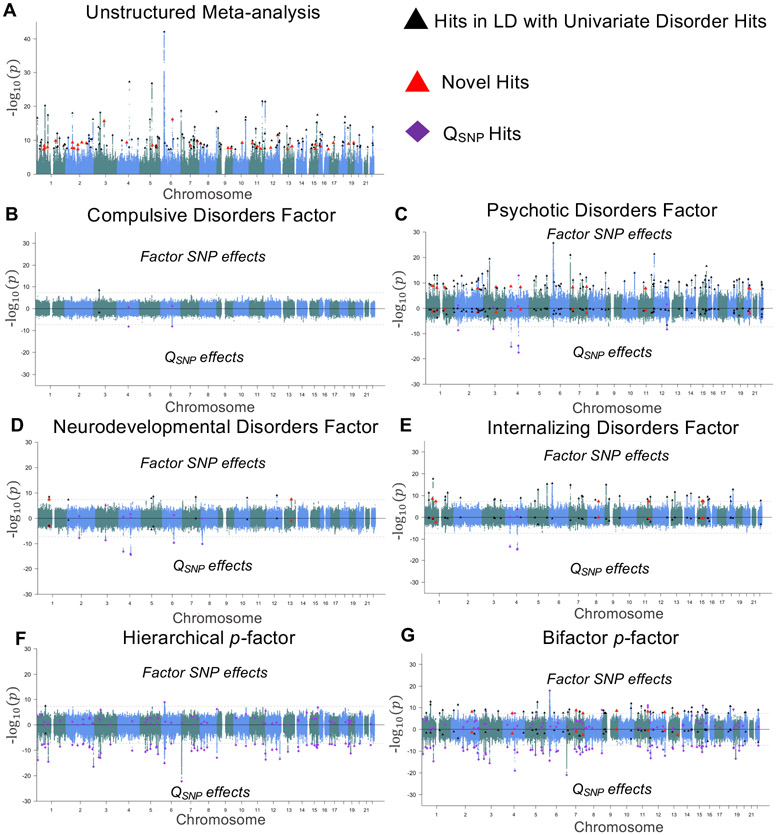
We interrogate the joint genetic architecture of 11 major psychiatric disorders at biobehavioral, functional genomic and molecular genetic levels of analysis. We identify four broad factors (neurodevelopmental, compulsive, psychotic and internalizing) that underlie genetic correlations among the disorders and test whether these factors adequately explain their genetic correlations with biobehavioral traits. We introduce stratified genomic structural equation modeling, which we use to identify gene sets that disproportionately contribute to genetic risk sharing. This includes protein-truncating variant-intolerant genes expressed in excitatory and GABAergic brain cells that are enriched for genetic overlap across disorders with psychotic features. Multivariate association analyses detect 152 (20 new) independent loci that act on the individual factors and identify nine loci that act heterogeneously across disorders within a factor. Despite moderate-to-high genetic correlations across all 11 disorders, we find little utility of a single dimension of genetic risk across psychiatric disorders either at the level of biobehavioral correlates or at the level of individual variants.


Figures

Figure 1 ∣
Figure 1 ∣. Multivariate genetic architecture of 11 psychiatric disorders.
a, Genetic correlations estimated using LDSC. b, Standardized results for the correlated factors. c, Standardized results from the hierarchical factor model. d, Standardized results from the bifactor model. The genetic components of disorders and common genetic factors of disorders are inferred variables that are represented as circles. Regression relationships between variables are depicted as one-headed arrows pointing from the independent variables to the dependent variables. Covariance relationships between variables are represented as two-headed arrows linking the variables. (Residual) variances of a variable are represented as a two-headed arrow connecting the variable to itself; for simplicity, residuals of the indicators are not depicted for the bifactor model. ADHD, attention-deficit/hyperactivity disorder; OCD, obsessive-compulsive disorder; TS, Tourette syndrome; PTSD, post-traumatic stress disorder; AN, anorexia nervosa; AUT, autism spectrum disorder; ALCH, problematic alcohol use; ANX, anxiety; MDD, major depressive disorder; BIP, bipolar disorder; SCZ, schizophrenia.
Figure 2 ∣
Figure 2 ∣. Model comparisons for producing Q metrics.
Unstandardized path diagrams for common pathway (right) and independent pathways (left) models used to compute the Genomic SEM heterogeneity statistics for associations with external traits (QTrait, top) and individual SNPs (QSNP, bottom). In this example, F is a common genetic factor of the genetic components of three GWAS phenotypes (Y1-Y3). Observed variables are represented as squares, and latent variables are represented as circles. The genetic component of each phenotype is represented with a circle as the genetic component is a latent variable that is not directly measured, but is inferred using LDSC. SNPs are directly measured, and are therefore represented as squares. Single-headed arrows are regression relations, and double-headed arrows are variances. Paths labeled 1 are fixed to 1 for model identification purposes. All unlabeled paths represent freely estimated model parameters. Q represents the decrement in model fit of the common pathway model relative to the more restrictive independent pathways model. Q is a χ2 distributed test statistic with k − 1 degrees of freedom, representing the difference between the k SNP-phenotype or Trait-phenotype b coefficients in the independent pathways model and the 1 SNP-factor or Trait-factor b coefficient in the common pathway model. Q is estimated here using a χ2 difference test across the common and independent pathways models; this is statistically equivalent to the 2-step procedure outlined in the original Genomic SEM publication for calculating QSNP. QTrait indexes whether the pattern of genetic associations between the genetic component of an external trait (depicted as Xg) and the individual disorders is well accounted for by a given factor. QSNP indexes whether the associations between an individaul SNP (depicted as SNPm) and the individual dissorders is well accounted for by the factor. For simplicity, we depict a stylized representation containing only one factor and three disorders. The full models used to derive QTrait and QSNP for the empirical analyses reported in this paper are presented in Supplementary Figures 5 and 38.
Figure 3 ∣
Figure 3 ∣. Genetic correlations with complex traits across psychiatric factors.
a-f, Panels depict point estimates for genetic correlations with complex traits of interest for the four psychiatric factors from the correlated factors model and the second-order, p-factor from the hierarchical model. Genetic correlations are shown for socioeconomic (a), anthropromorphic (b), personality (c), health and disease (d), cognitive (e), and risky behavior outcomes (f). Bars depicted with a dashed outline were significant at a Bonferroni-corrected threshold for model comparisons indicating heterogeneity across the factor indicators in their genetic correlations with the outside trait. Error bars are +/− 1.96 SE. Bars depicted with an asterisk above produced a genetic correlation that was significant at a Bonferroni-corrected threshold and were not significantly heterogeneous. The total effective sample size for the factors was: Compulsive factor (n = 19,108), Psychotic factor (n = 87,138), Neurodevelopmental factor (n = 55,932), Internalizing factor (n = 455,340), and hierarchical p-factor (n = 667,343). Sample sizes for the complex traits are reported in Supplementary Table 5.
Figure 4 ∣
Figure 4 ∣. Genetic correlations with accelerometer data across psychiatric disorders and factors.
a-e, Panels depicts genetic correlations between accelerometer-based average total hourly movement within the 24-hour day beginning at midnight (n ~ 95,000) and each psychiatric disorder, along with the respective psychiatric factor, for the compulsive disorders (a), psychotic disorders (b), neurodevelopmental disorders (c), internalizing disorders (d), and psychiatric factors (e). Across all panels, the psychiatric factors are depicted with larger points and lines. For the psychiatric factors, points depicted as diamonds were significant at a Bonferroni-corrected threshold for model comparisons indicating heterogeneity across the factor indicators in their genetic correlations with that particular time point. As it loaded on three different factors (see Fig. 1), ALCH was not as assigned to a panel above. Lines represent loess regression lines estimated in ggplot2.
Figure 5 ∣
Figure 5 ∣. Genetic enrichment of factors for brain cell, PI, and PI × brain cell annotations.
Figure depicts enrichment of the four factors from correlated factors model and the second-order, p-factor from the hierarchical factor model for the brain cell genes, protein-truncating variant (PTV)–intolerant (PI) genes, and PI × brain cell gene annotations. Enrichment is indexed by the ratio of the proportion of genome-wide relative risk sharing indexed by the annotation to that annotation’s size as a proportion of the genome. The red dashed line reflects the null ratio of 1.0, corresponding to no enrichment. Ratios greater than 1.0 indicate enrichment of shared signal, whereas ratios less than 1.0 indicate depletion of shared signal. Error bars depict 95% confidence intervals. Points depicted with an asterisk were significantly enriched at a Bonferroni-corrected threshold. To maintain equal scaling purposes across all panels, error bars are capped at 3 and 0 for the Compulsive disorders factor; no annotations were significant for this factor.
Figure 6 ∣
Figure 6 ∣. Miami plots for psychiatric factors.
a, Results from an unstructured meta-analysis of the 11 psychiatric traits. b-e, Results from the correlated factors model for the Compulsive disorders factor (Factor 1; b), Psychotic disorders factor (Factor 2; c), Neurodevelopmental disorders factor (Factor 3; d), and Internalizing disorders factor (Factor 4; e). f, Results of the SNP effect on the second-order p-factor from the hierarchical model. g, Results from a model in which the SNP predicted the p-factor from a bifactor model. The top half of the plots depict the −log10(P) values for SNP effects on the factor; the bottom half depicts the log10(P) values for the factor-specific QSNP effects. As the omnibus meta-analysis does not impose a structure on the patterning of SNP-disorder associations, it does not have a QSNP statistic. The gray dashed line marks the threshold for genome-wide significance (P < 5 × 10⁻⁸). Black triangles denote independent factor hits that were in LD with hits for one of the univariate indicators and were not in LD with factor-specific QSNP hits. Large red triangles denote novel loci that were not in LD with any of the univariate GWAS or factor-specific QSNP hits. Purple diamonds denote QSNP hits.

References

    1. Martel MM et al. A general psychopathology factor (P factor) in children: structural model analysis and external validation through familial risk and child global executive function. J. Abnorm. Psychol 126, 137–148 (2017). - PubMed
    1. Dean K et al. The impact of parental mental illness across the full diagnostic spectrum on externalising and internalising vulnerabilities in young offspring. Psychol. Med 48, 2257–2263 (2018). - PubMed
    1. McLaughlin KA et al. Parent psychopathology and offspring mental disorders: results from the WHO World Mental Health Surveys. Br. J. Psychiatry 200, 290–299 (2012). - PMC - PubMed
    1. Kessler RC, Chiu WT, Demler O & Walters EE Prevalence, severity, and comorbidity of 12-month DSM-IV disorders in the National Comorbidity Survey Replication. Arch. Gen. Psychiatry 62, 617–627 (2005). - PMC - PubMed
    1. Caspi A et al. The p factor: one general psychopathology factor in the structure of psychiatric disorders? Clin. Psychol. Sci 2, 119–137 (2014). - PMC - PubMed

Methods-only References

    1. Yengo L, Yang J & Visscher PM Expectation of the intercept from bivariate LD score regression in the presence of population stratification. bioRxiv 310565 (2018).
    1. Yang J, Lee SH, Goddard ME & Visscher PM GCTA: a tool for genome-wide complex trait analysis. Am. J. Hum. Genet 88, 76–82 (2011). - PMC - PubMed
    1. Purcell S et al. PLINK: a tool set for whole-genome association and population-based linkage analyses. Am. J. Hum. Genet 81, 559–575 (2007). - PMC - PubMed
    1. Meredith W Measurement invariance, factor analysis and factorial invariance. Psychometrika 58, 525–543 (1993).
    1. Hujoel ML, Gazal S, Hormozdiari F, van de Geijn B & Price AL Disease heritability enrichment of regulatory elements is concentrated in elements with ancient sequence age and conserved function across species. Am. J. Hum. Genet 104, 611–624 (2019). - PMC - PubMed

Publication types