. 2022 May;54(5):573-580.
doi: 10.1038/s41588-022-01054-7. Epub 2022 May 5.

Improving polygenic prediction in ancestrally diverse populations

Collaborators, Affiliations

Improving polygenic prediction in ancestrally diverse populations

Yunfeng Ruan et al. Nat Genet. 2022 May.

Erratum in

Abstract

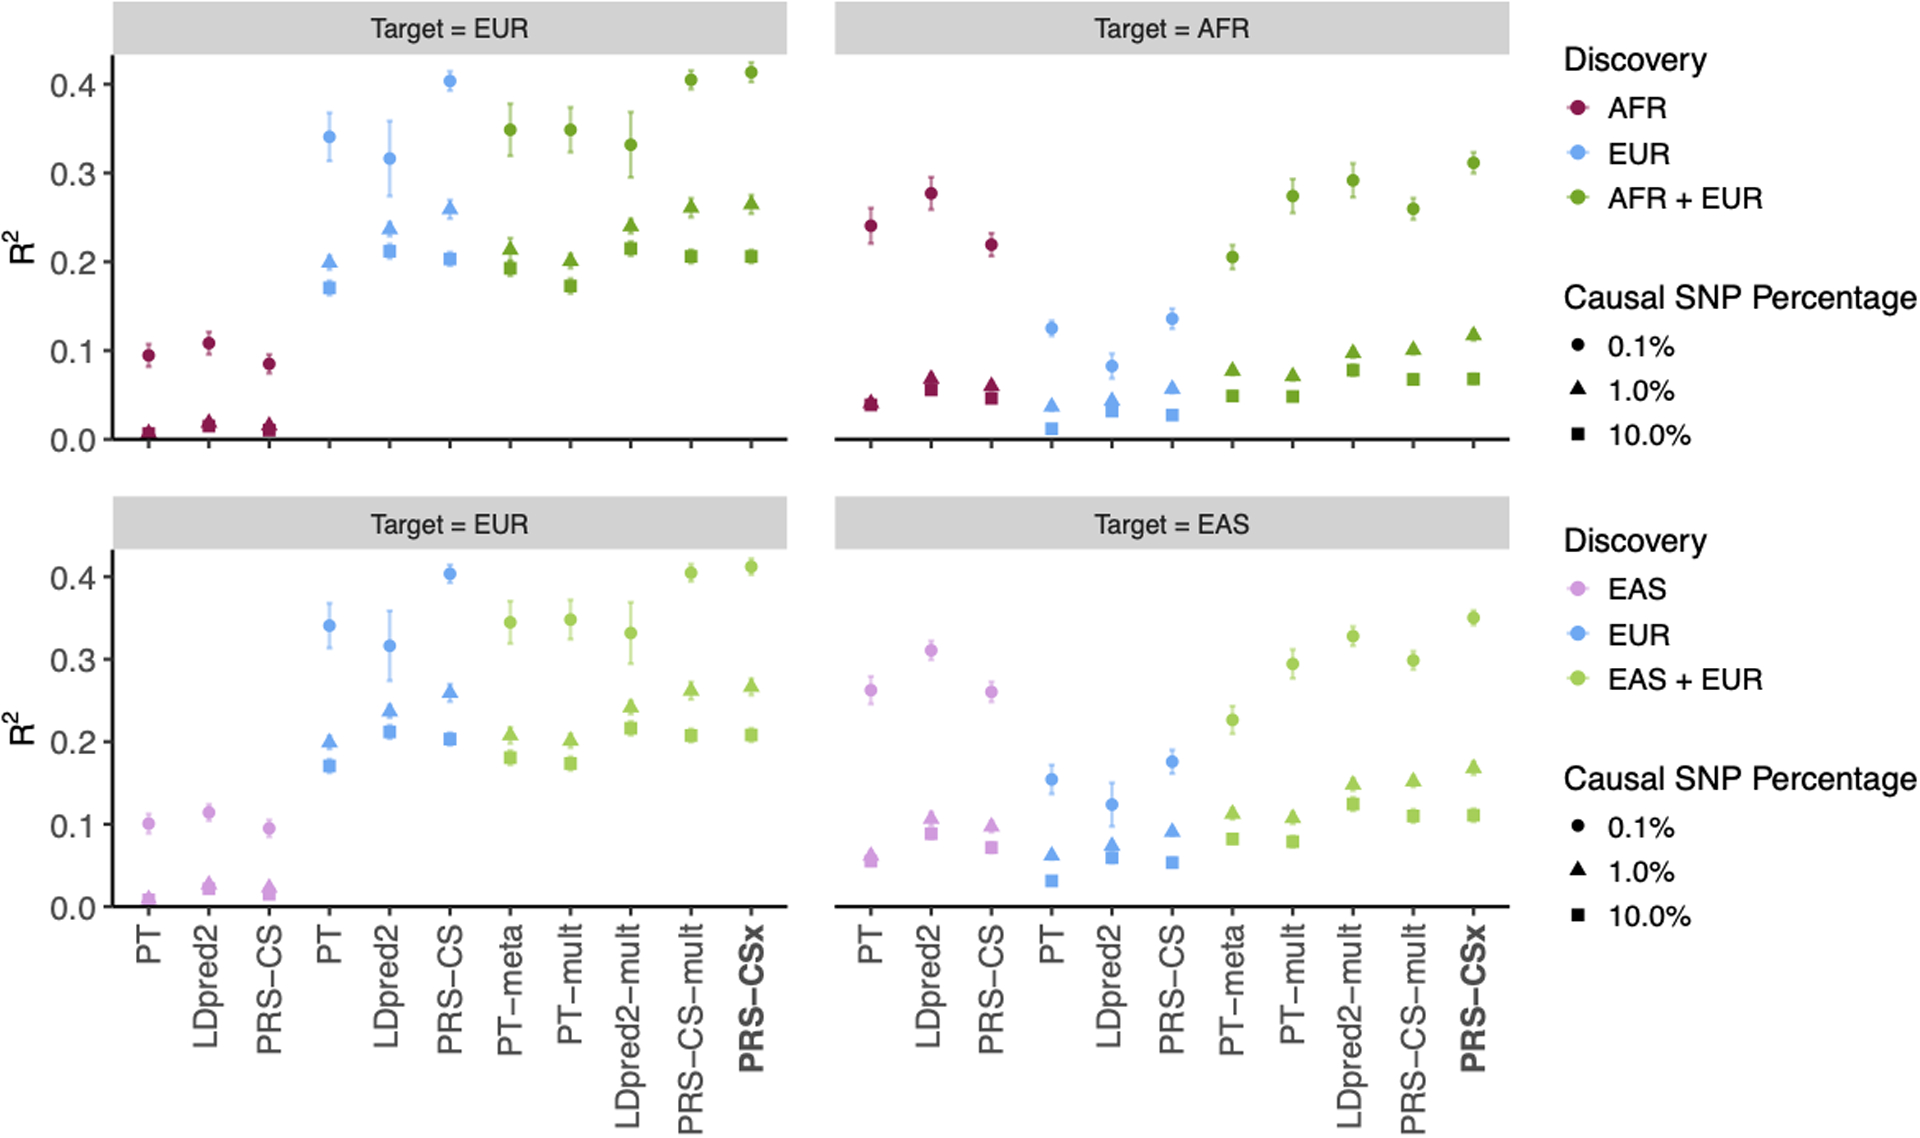
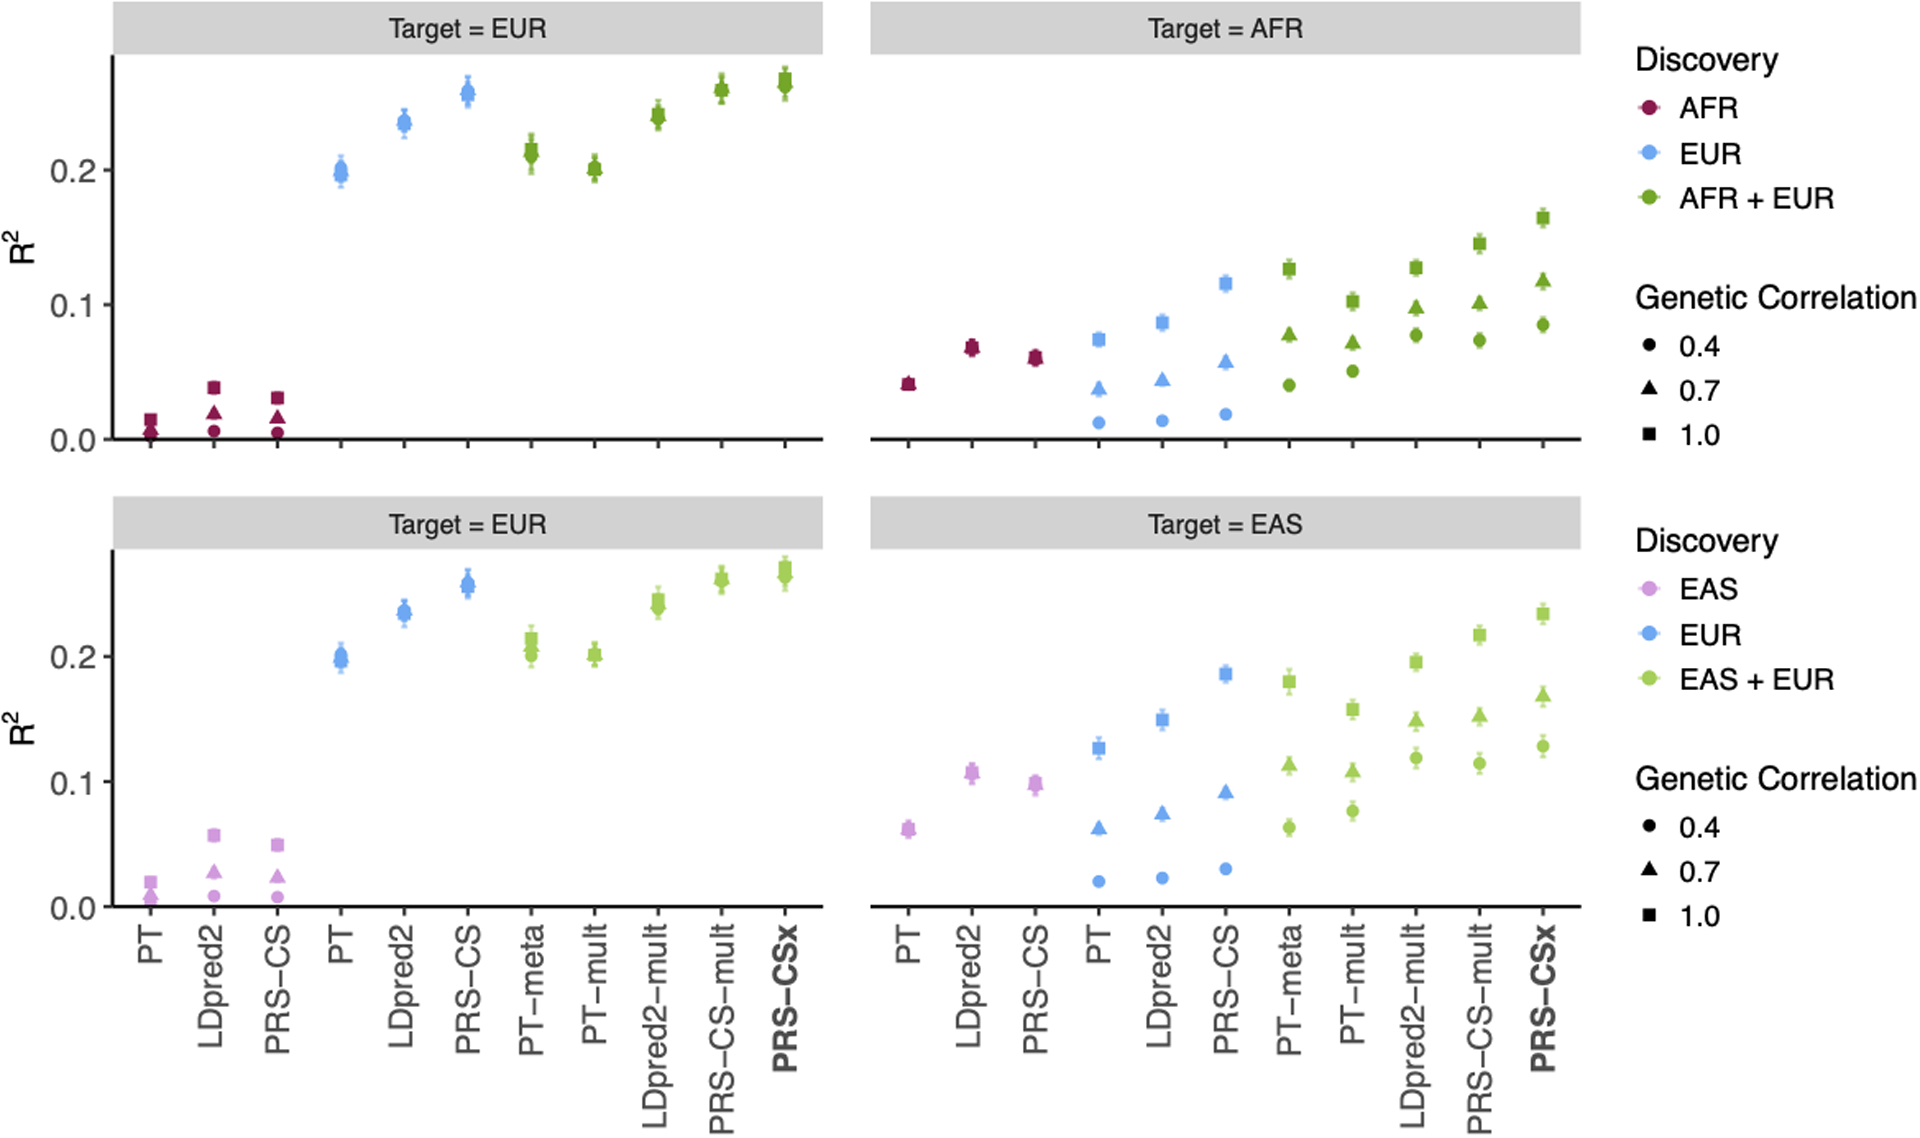
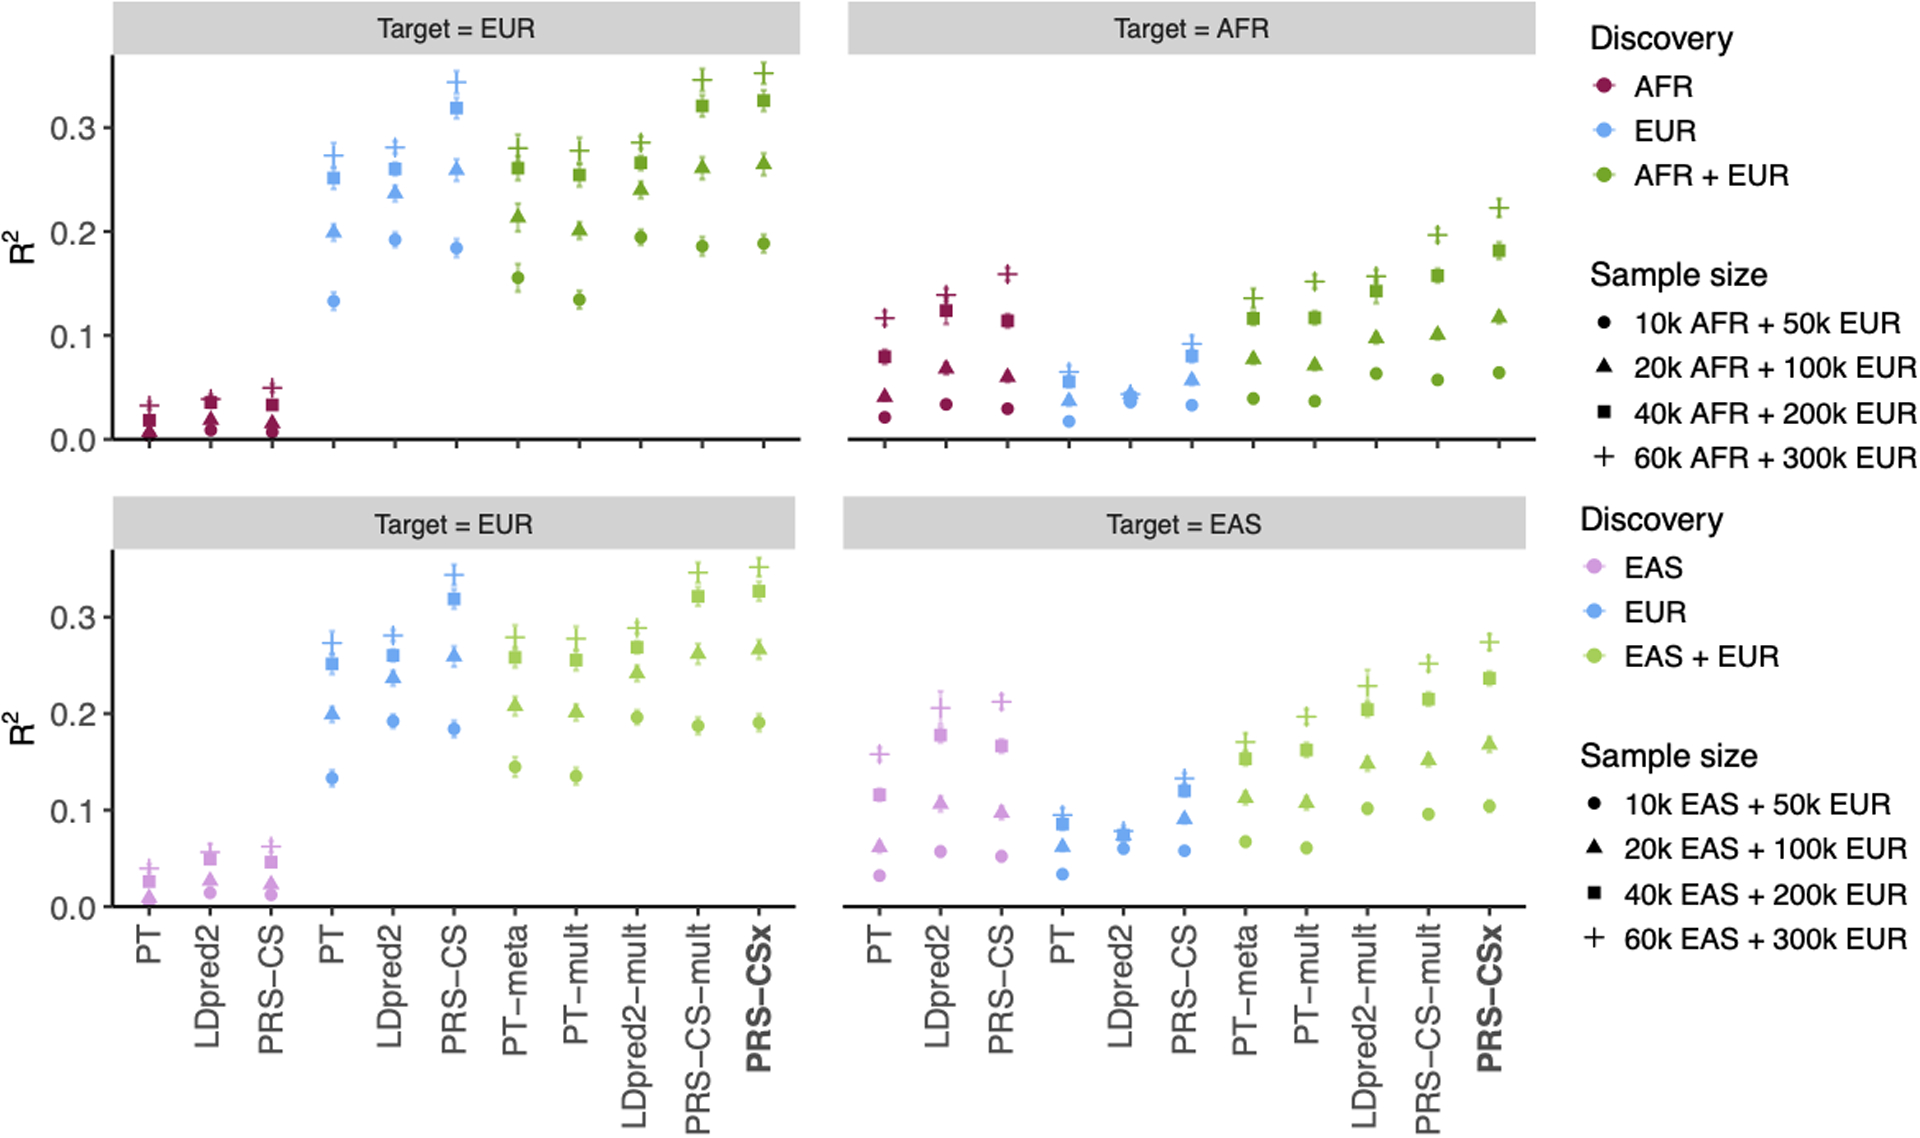
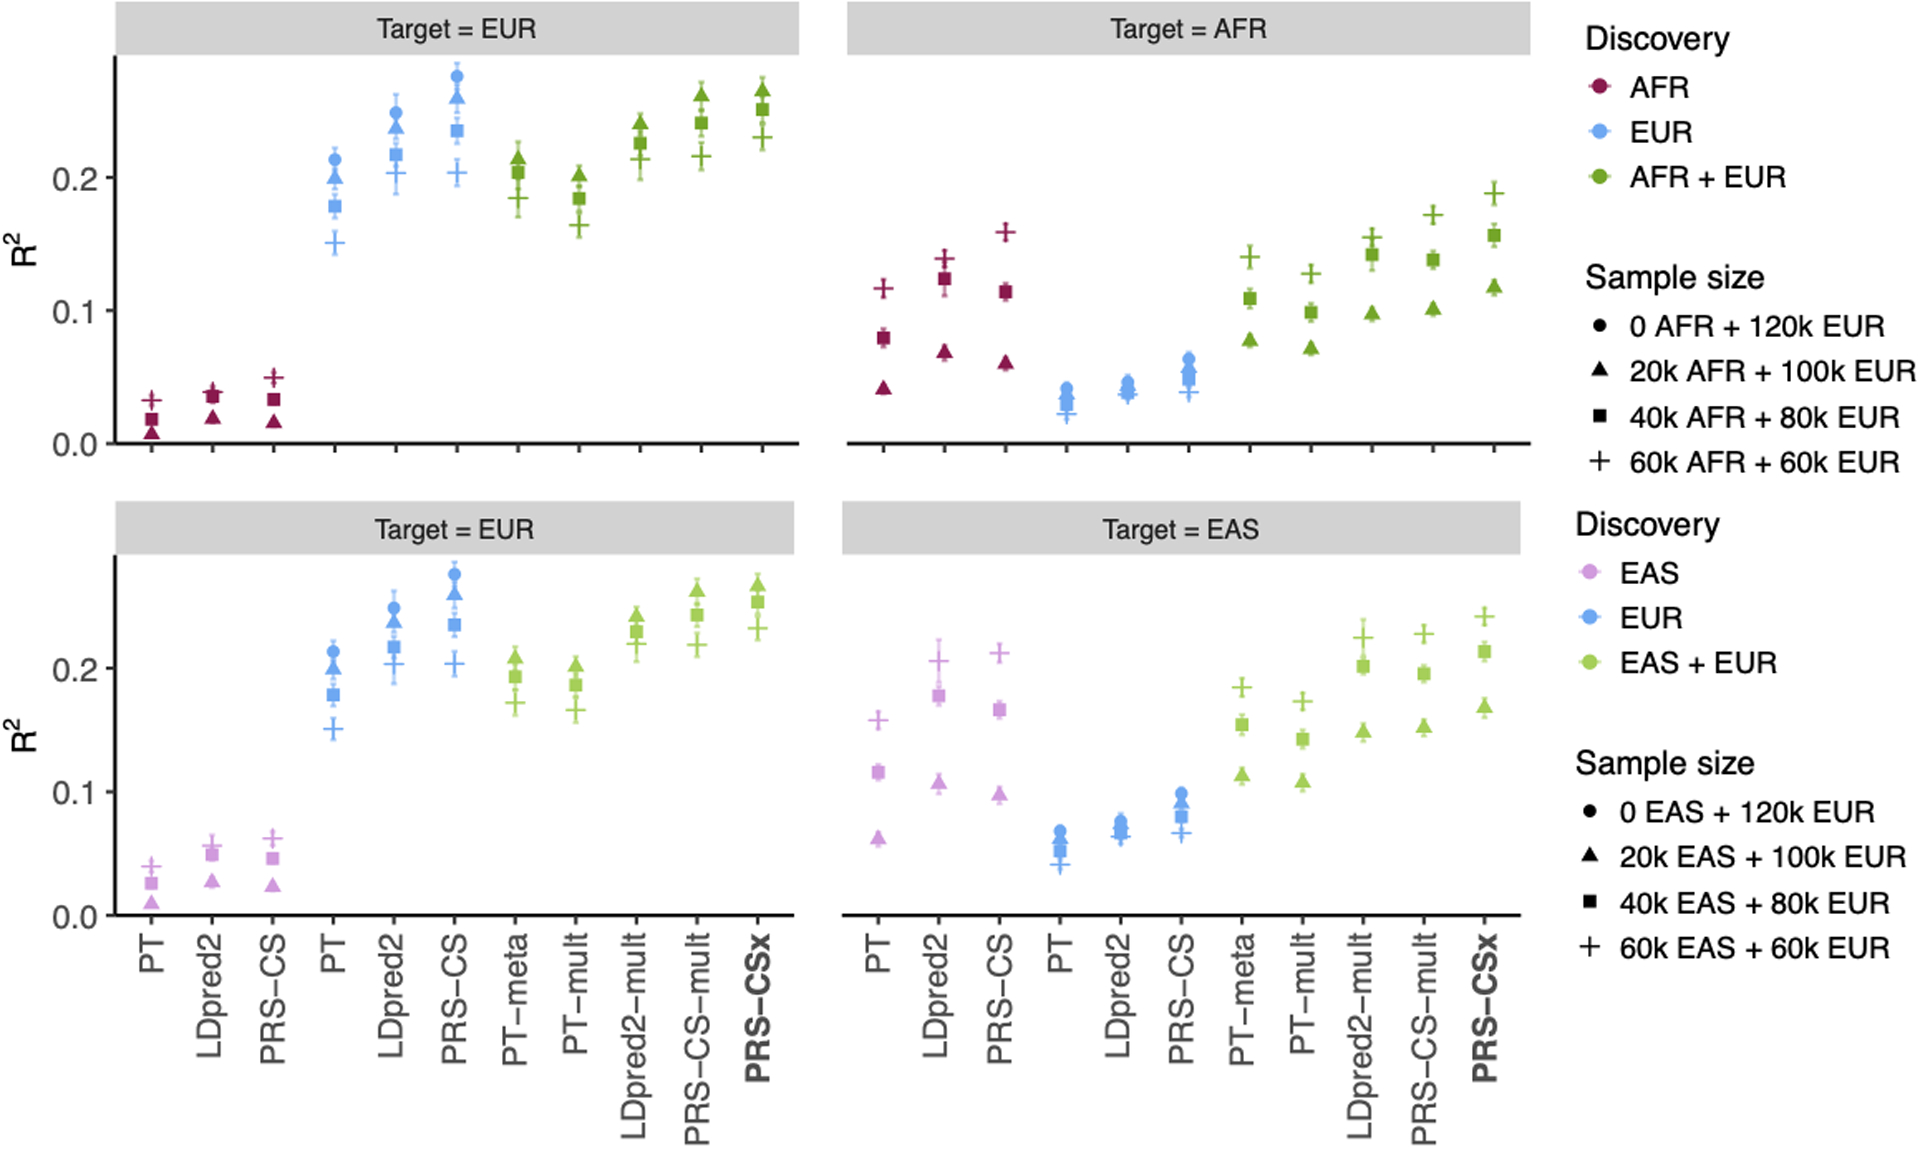
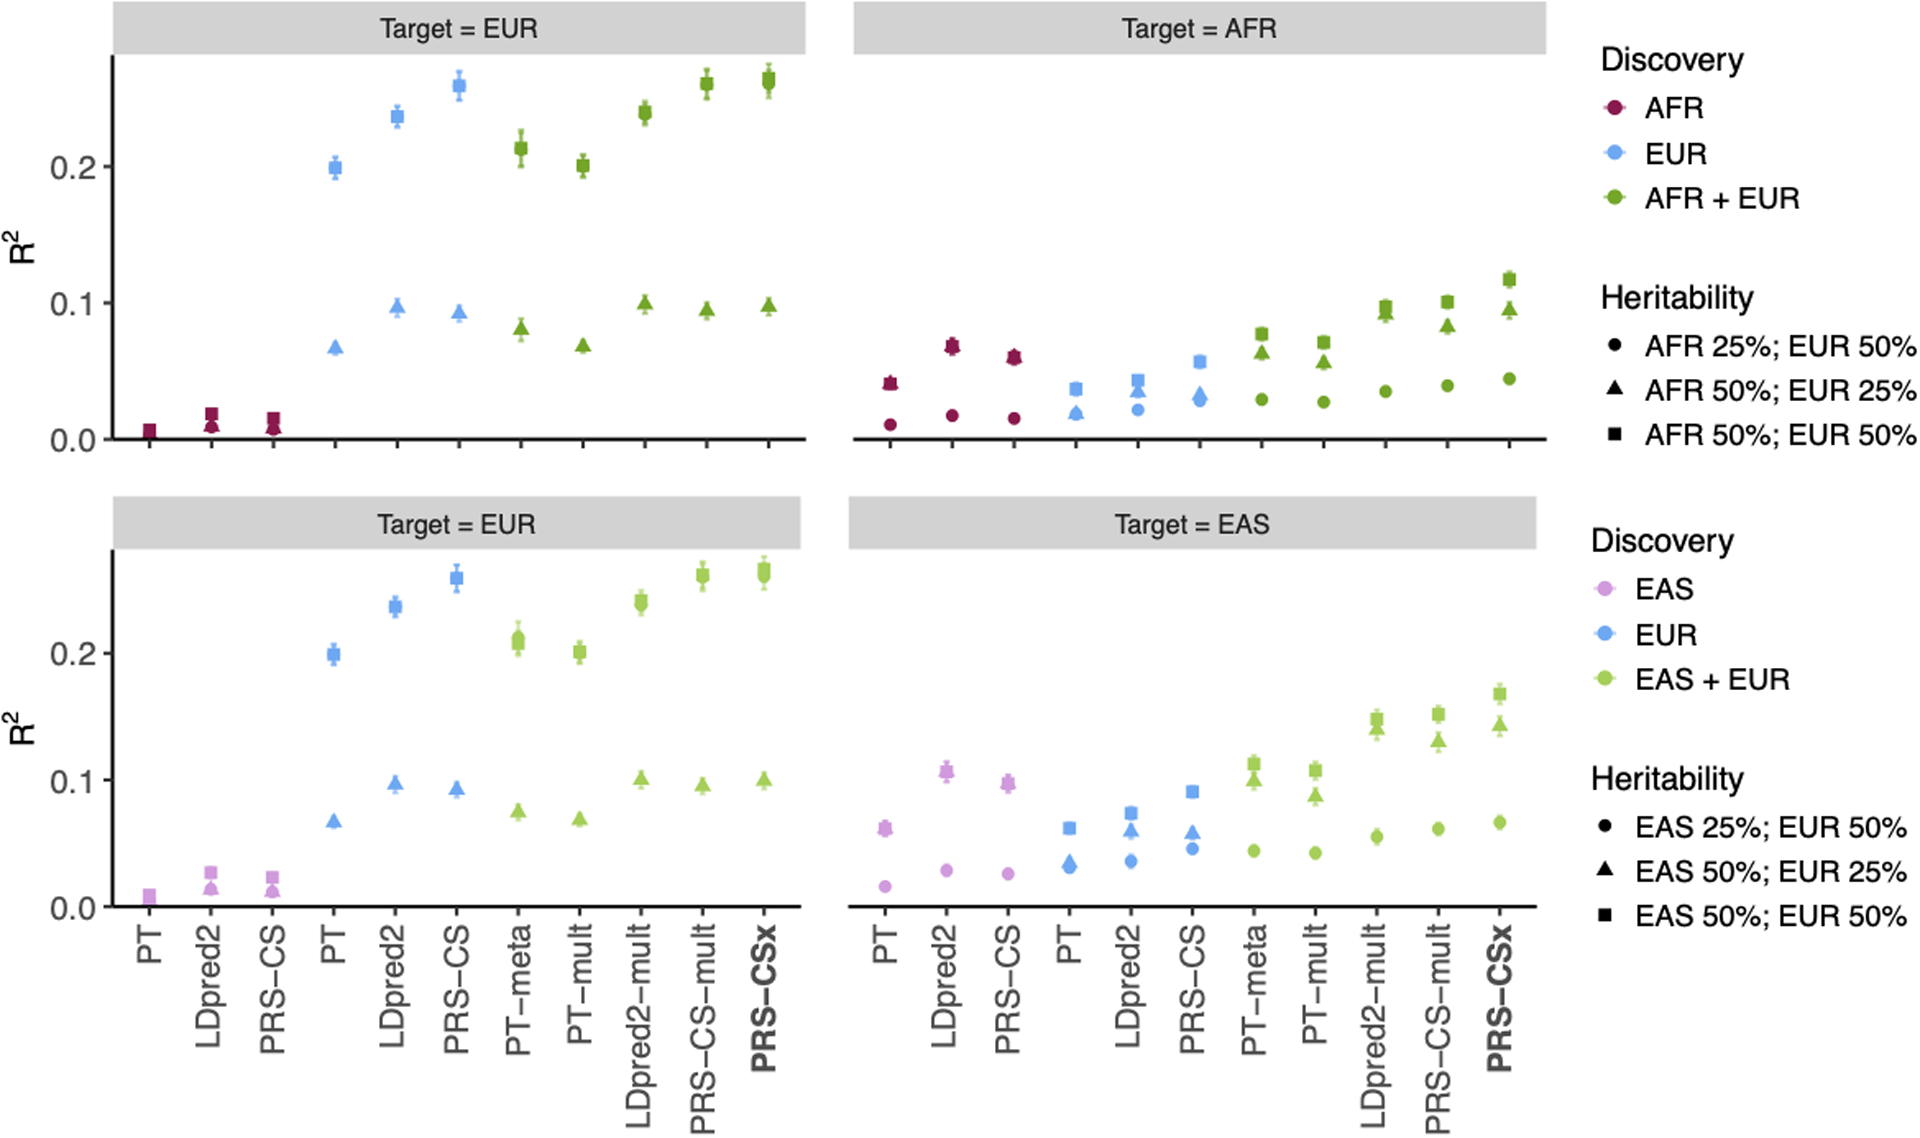
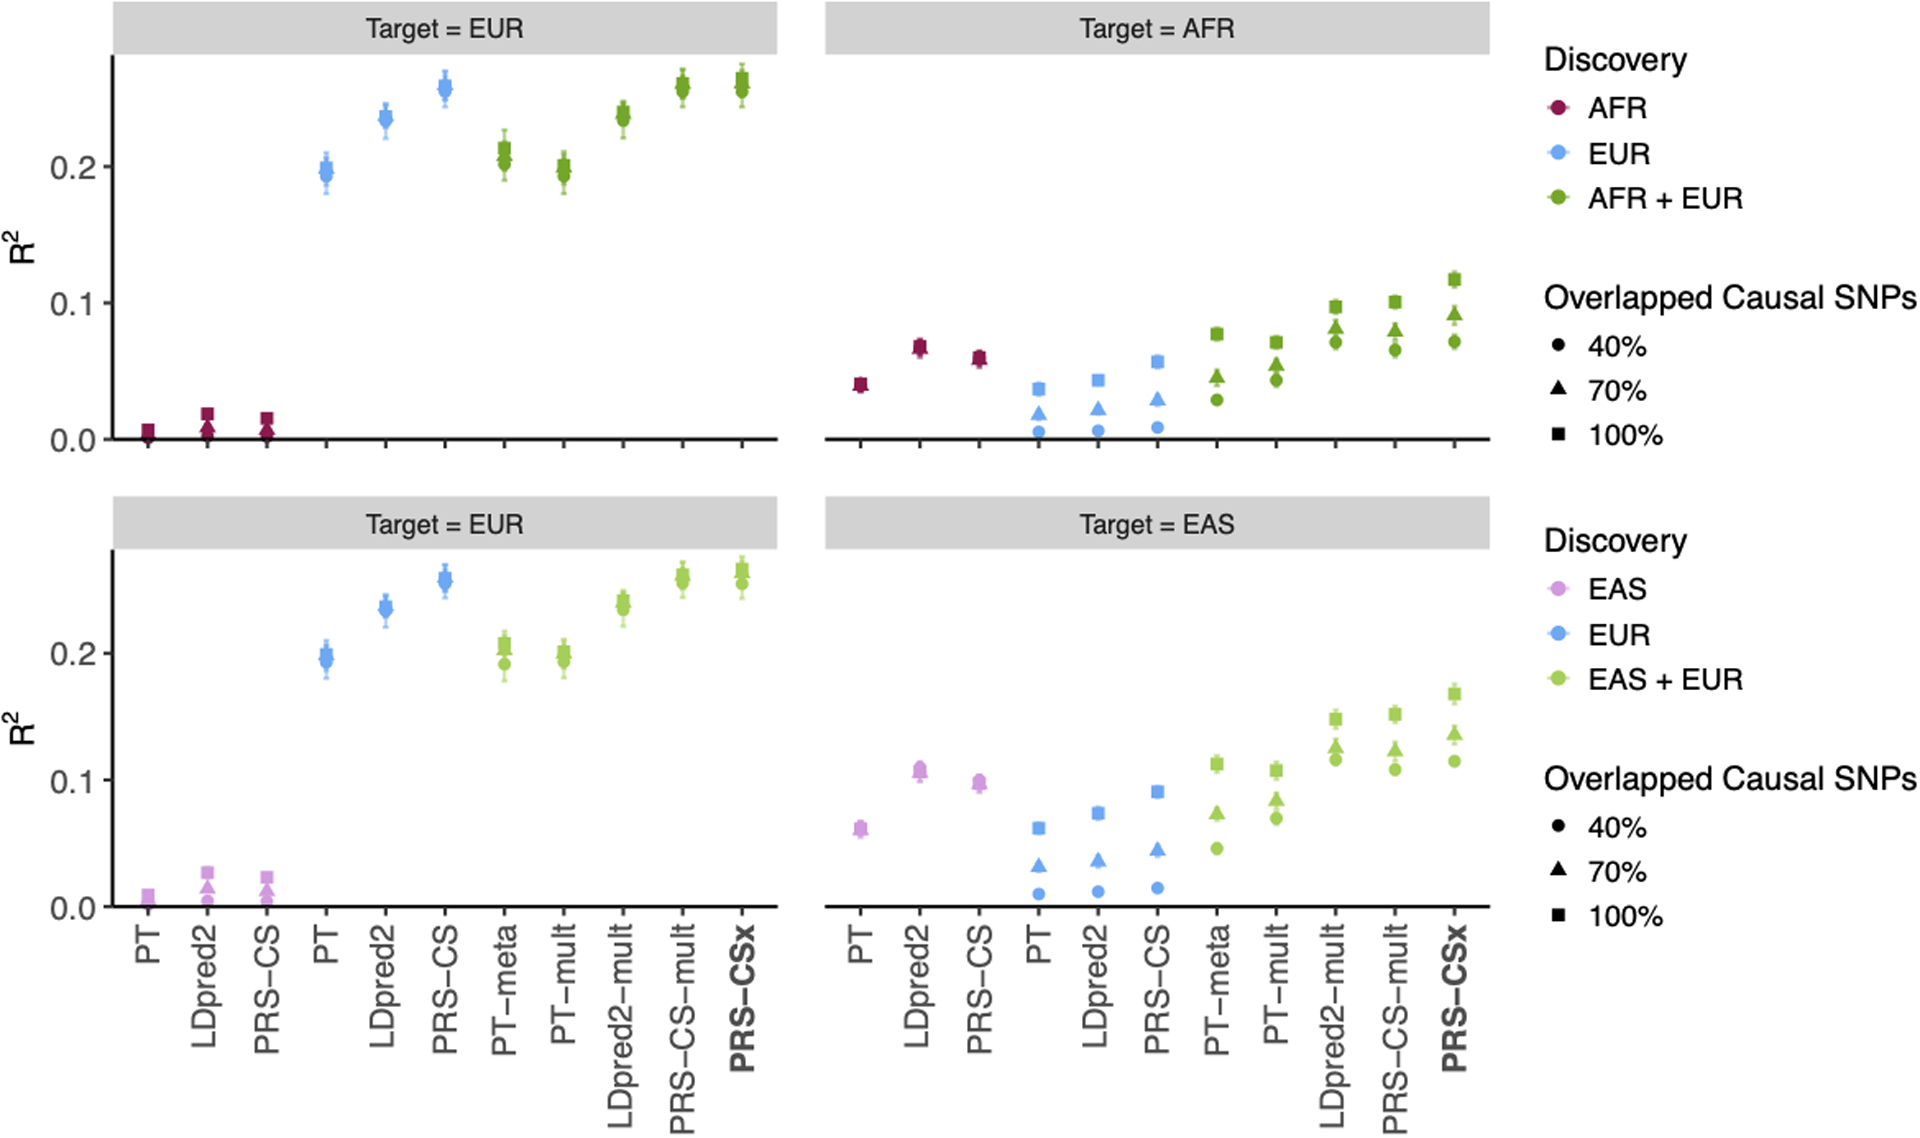
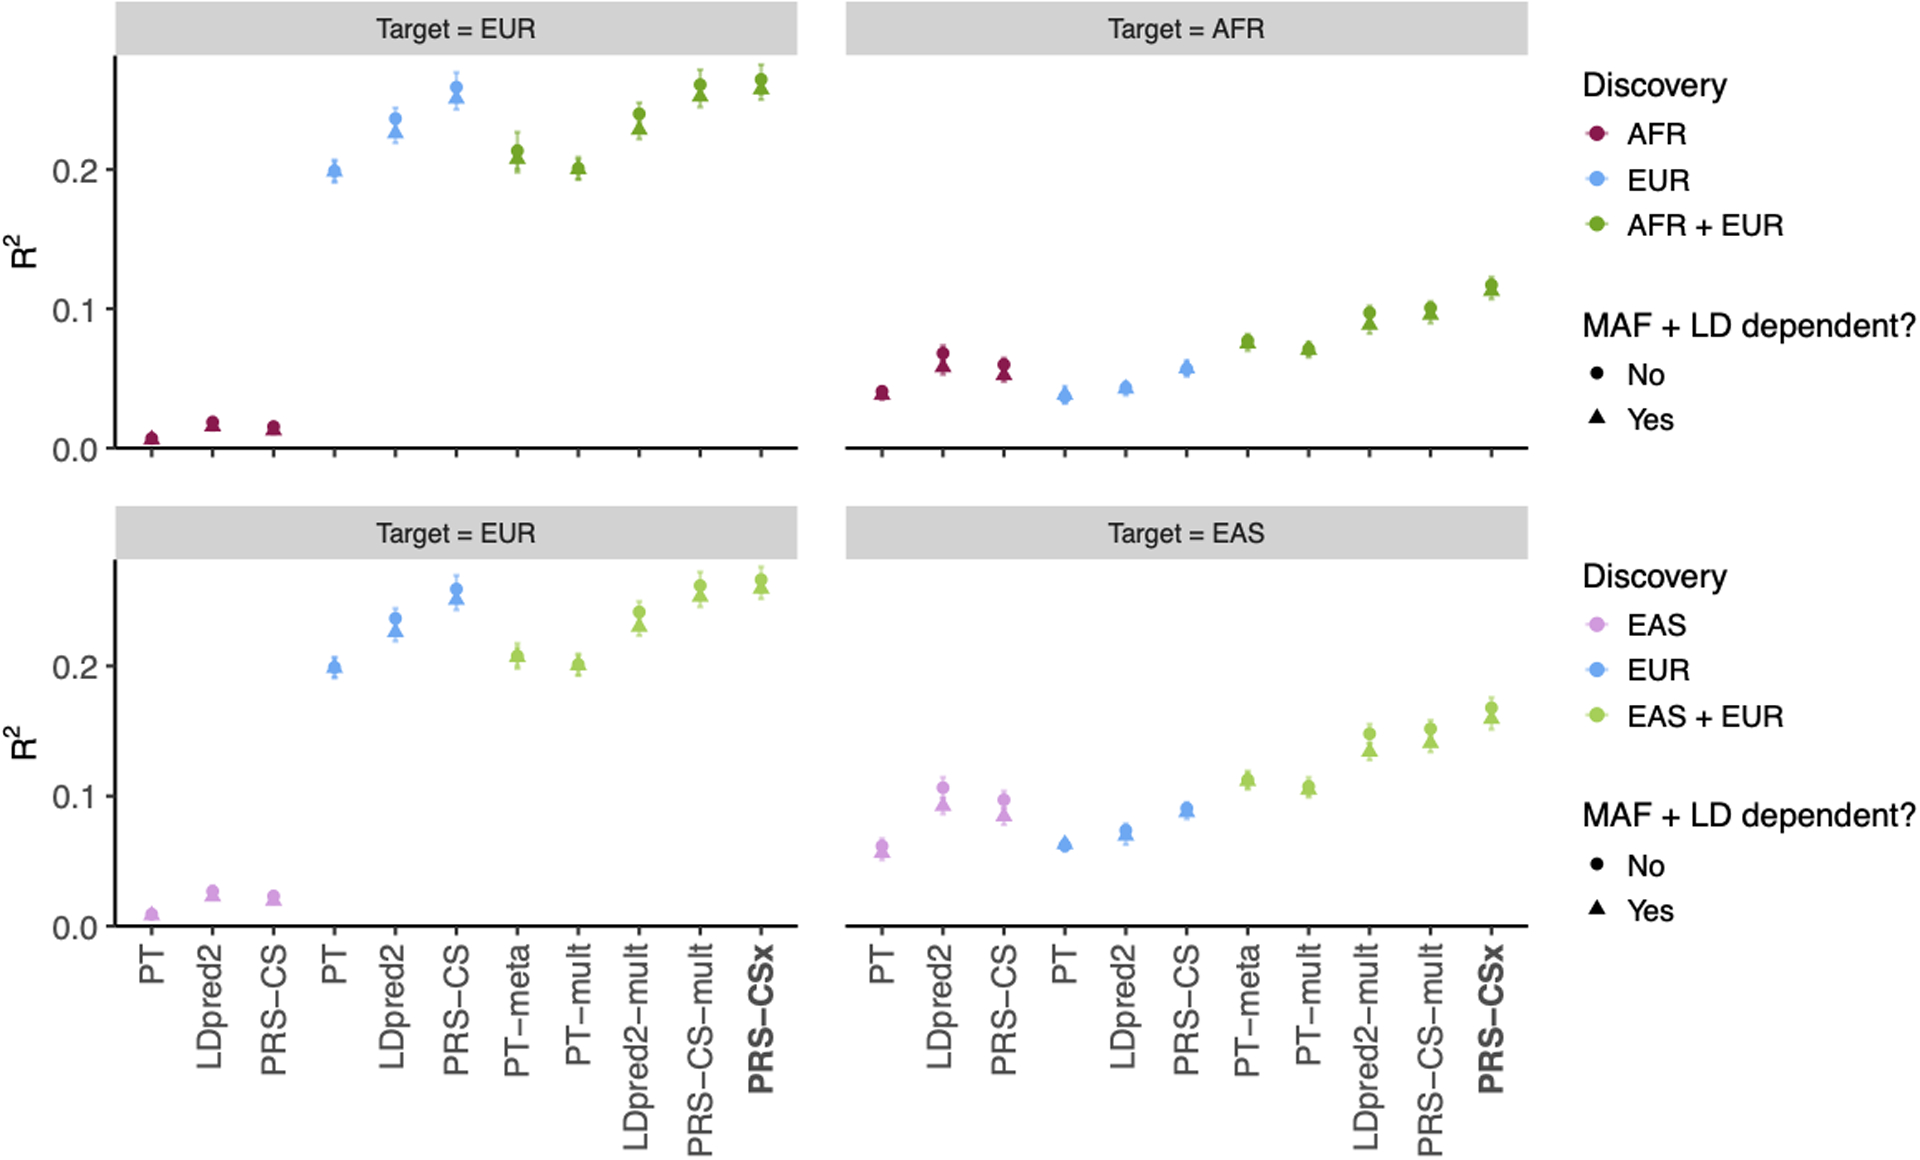
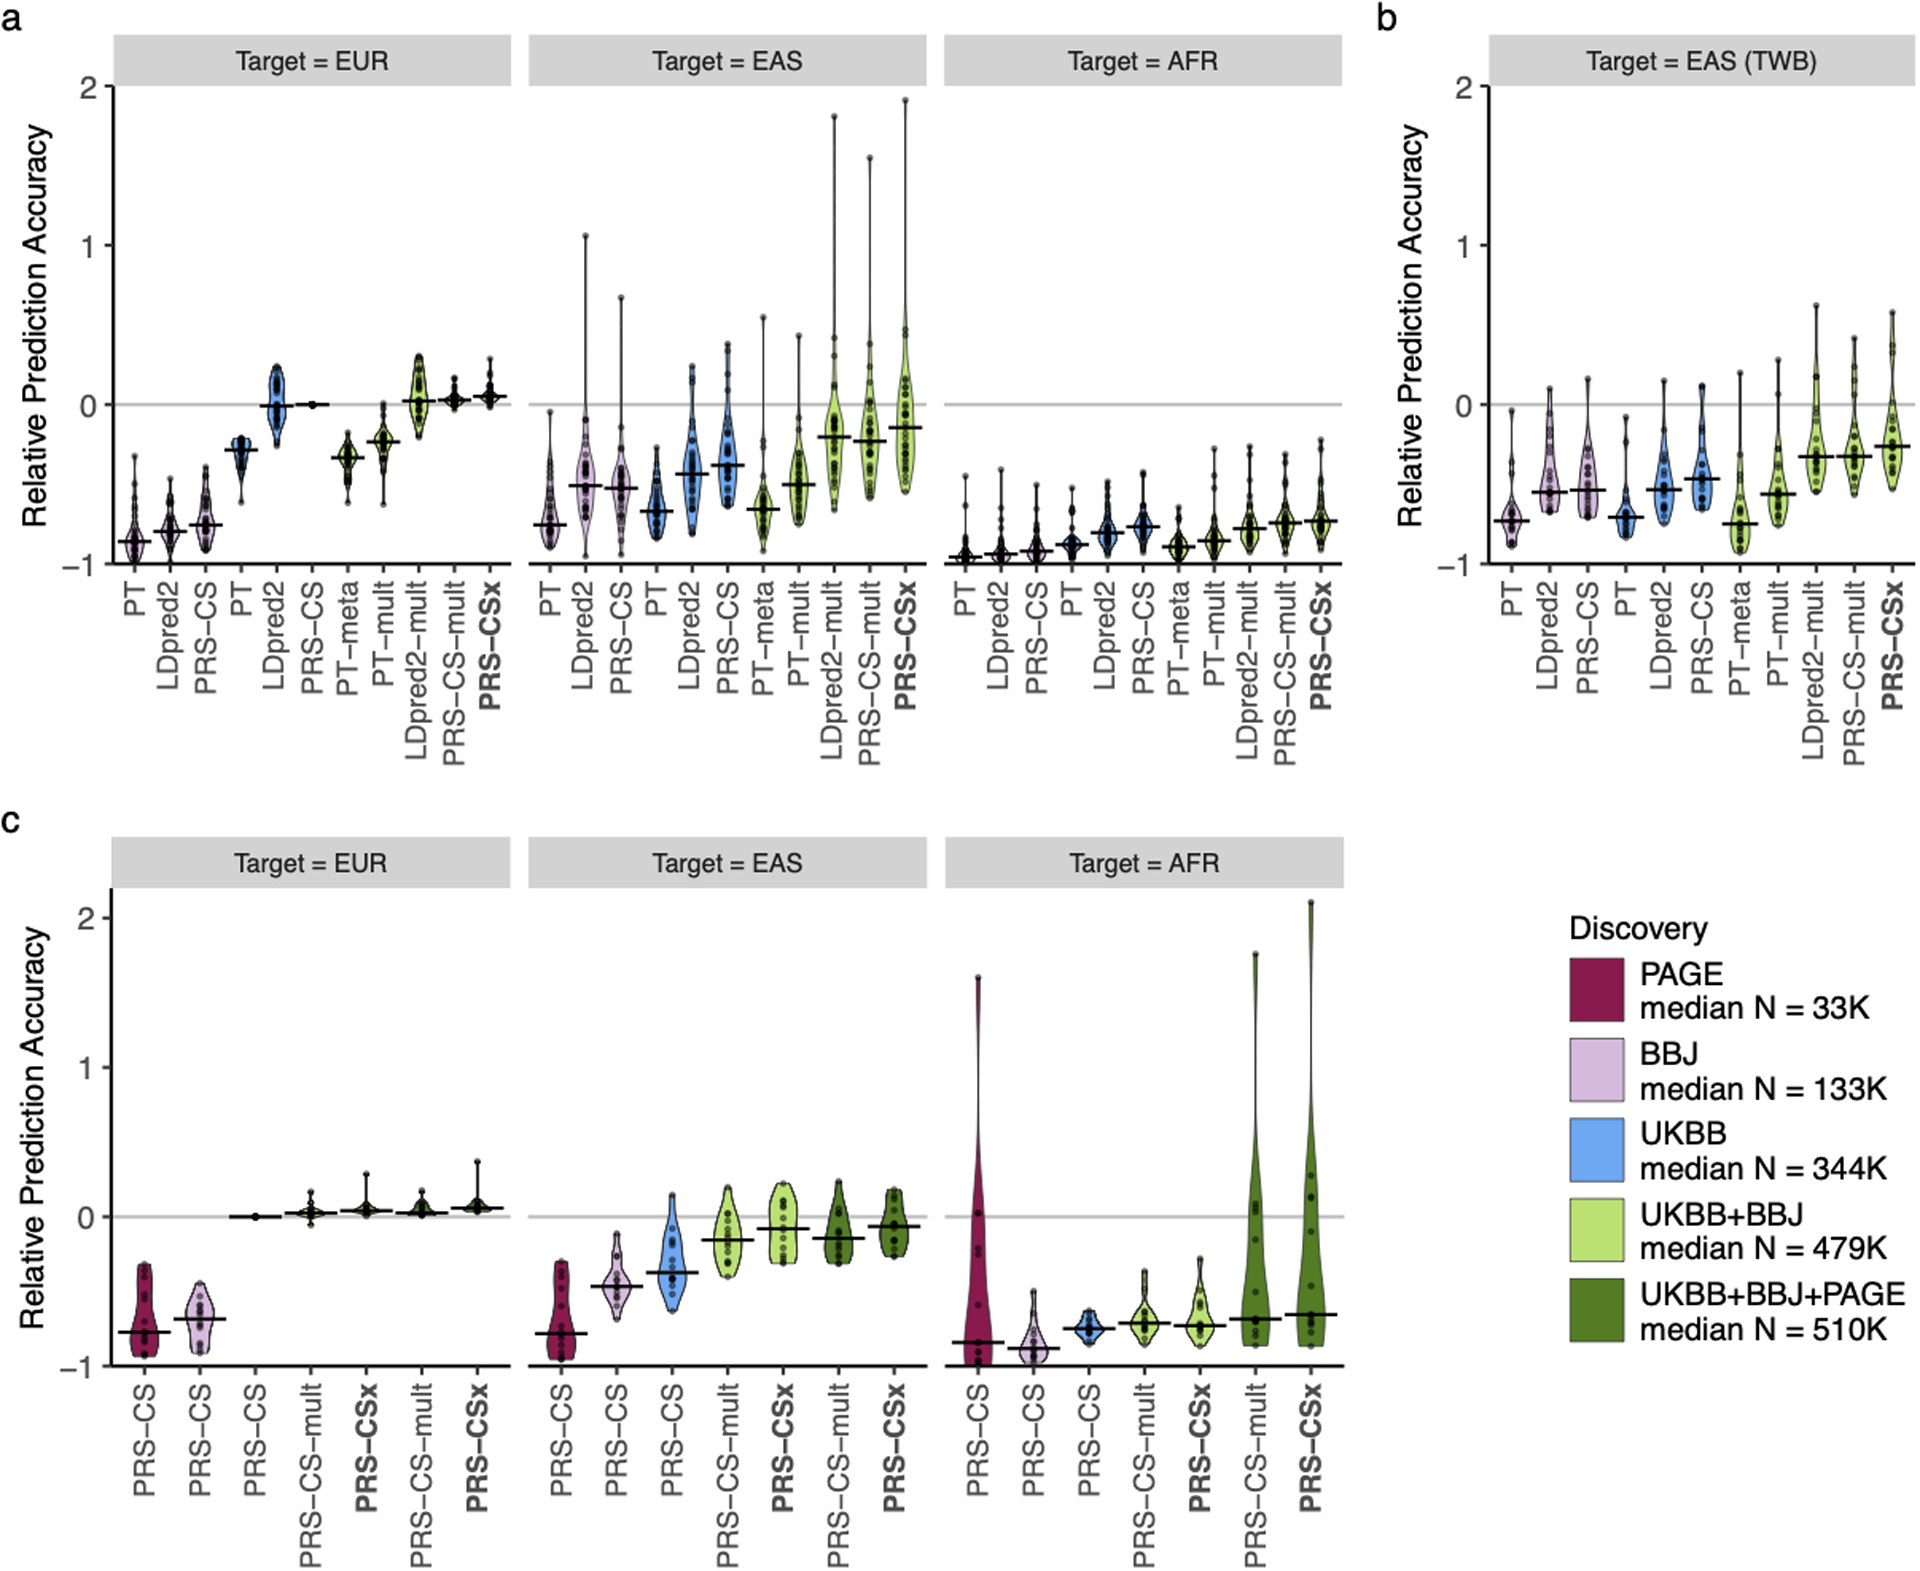
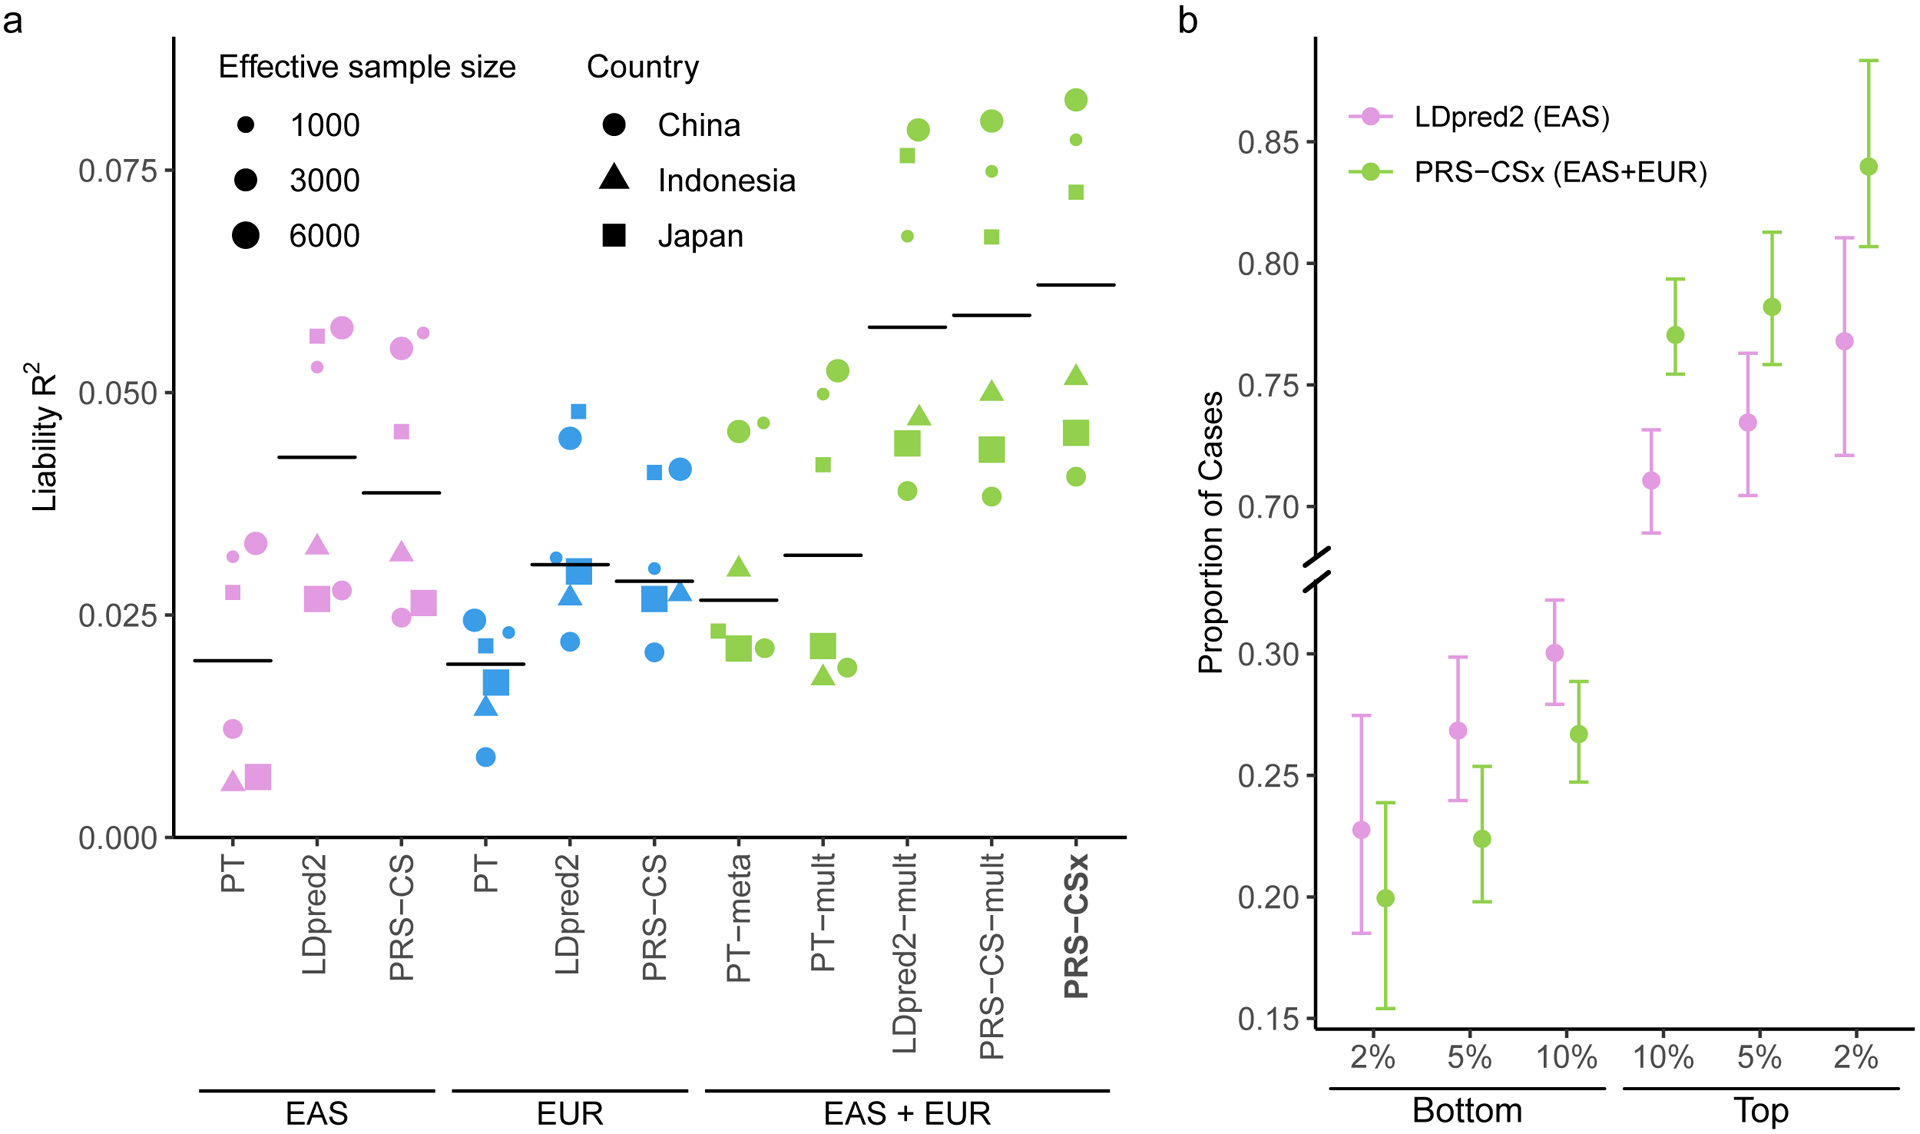
Polygenic risk scores (PRS) have attenuated cross-population predictive performance. As existing genome-wide association studies (GWAS) have been conducted predominantly in individuals of European descent, the limited transferability of PRS reduces their clinical value in non-European populations, and may exacerbate healthcare disparities. Recent efforts to level ancestry imbalance in genomic research have expanded the scale of non-European GWAS, although most remain underpowered. Here, we present a new PRS construction method, PRS-CSx, which improves cross-population polygenic prediction by integrating GWAS summary statistics from multiple populations. PRS-CSx couples genetic effects across populations via a shared continuous shrinkage (CS) prior, enabling more accurate effect size estimation by sharing information between summary statistics and leveraging linkage disequilibrium diversity across discovery samples, while inheriting computational efficiency and robustness from PRS-CS. We show that PRS-CSx outperforms alternative methods across traits with a wide range of genetic architectures, cross-population genetic overlaps and discovery GWAS sample sizes in simulations, and improves the prediction of quantitative traits and schizophrenia risk in non-European populations.


Conflict of interest statement

COMPETING INTERESTS

C.Y.C. is an employee of Biogen. The other authors declare no competing interests.

Figures

Extended Data Fig. 1
Extended Data Fig. 1. Prediction accuracy of different polygenic prediction methods across different genetic architectures.
Phenotypes were simulated using 0.1%, 1% or 10% of randomly sampled causal variants (shared across populations), a cross-population genetic correlation of 0.7, and SNP heritability of 50%. PRS were trained using 100K EUR samples and 20K non-EUR (EAS or AFR) samples. Numerical results are reported in Supplementary Table 2.
Extended Data Fig. 2
Extended Data Fig. 2. Prediction accuracy of different polygenic prediction methods across different cross-population genetic correlations.
Phenotypes were simulated using 1% of randomly sampled causal variants (shared across populations), a cross-population genetic correlation of 0.4, 0.7 or 1.0, and SNP heritability of 50%. PRS were trained using 100K EUR samples and 20K non-EUR (EAS or AFR) samples. Numerical results are reported in Supplementary Table 3.
Extended Data Fig. 3
Extended Data Fig. 3. Prediction accuracy of different polygenic prediction methods across different discovery GWAS sample sizes.
Phenotypes were simulated using 1% of randomly sampled causal variants (shared across populations), a cross-population genetic correlation of 0.7, and SNP heritability of 50%. PRS were trained using 50K EUR and 10K non-EUR (EAS or AFR) samples, 100K EUR and 20K non-EUR samples, 200K EUR and 40K non-EUR samples, or 300K EUR and 60K non-EUR samples. Numerical results are reported in Supplementary Table 4.
Extended Data Fig. 4
Extended Data Fig. 4. Prediction accuracy of different polygenic prediction methods across different ratios of EUR vs. non-EUR GWAS sample sizes.
Phenotypes were simulated using 1% of randomly sampled causal variants (shared across populations), a cross-population genetic correlation of 0.7, and SNP heritability of 50%. PRS were trained using 120K EUR samples without non-EUR samples, 100K EUR and 20K non-EUR (EAS or AFR) samples, 80K EUR and 40K non-EUR samples, or 60K EUR and 60K non-EUR samples. Numerical results are reported in Supplementary Table 5.
Extended Data Fig. 5
Extended Data Fig. 5. Prediction accuracy of different polygenic prediction methods across different SNP heritability.
Phenotypes were simulated using 1% of randomly sampled causal variants (shared across populations) and a cross-population genetic correlation of 0.7. SNP heritability was fixed at 50% in each population, 50% in the EUR population and 25% in the non-EUR population, or 25% in the EUR population and 50% in the non-EUR population. PRS were trained using 100K EUR samples and 20K non-EUR (EAS or AFR) samples. Numerical results are reported in Supplementary Table 6.
Extended Data Fig. 6
Extended Data Fig. 6. Prediction accuracy of different polygenic prediction methods across different proportions of shared causal variants between populations.
Phenotypes were simulated using 1% of randomly sampled causal variants. 100%, 70% or 40% of the causal variants were shared across populations. Shared causal variants had a cross-population genetic correlation of 0.7. SNP heritability was fixed at 50%. PRS were trained using 100K EUR samples and 20K non-EUR (EAS or AFR) samples. Numerical results are reported in Supplementary Table 7.
Extended Data Fig. 7
Extended Data Fig. 7. Prediction accuracy of different polygenic prediction methods when SNP effect sizes are minor allele frequency (MAF) and linkage disequilibrium (LD) dependent.
Phenotypes were simulated using 1% of randomly sampled causal variants (shared across populations), a cross-population genetic correlation of 0.7, and SNP heritability of 50%. SNP effect sizes were dependent on MAF and LD scores such that SNPs with lower MAF and located in lower LD regions tended to have larger effect sizes. PRS were trained using 100K EUR samples and 20K non-EUR (EAS or AFR) samples. Numerical results are reported in Supplementary Table 8.
Extended Data Fig. 8
Extended Data Fig. 8. Relative prediction accuracy for quantitative traits across target populations.
Relative prediction performance for single-discovery and multi-discovery PRS construction methods using discovery GWAS summary statistics a, from UKBB and BBJ, across 33 traits, in different UKBB target populations (EUR, EAS and AFR); b, from UKBB and BBJ, across 21 traits, in the Taiwan Biobank (TWB); c, from UKBB, BBJ and PAGE, across 14 traits, in different UKBB target populations (EUR, EAS and AFR). Each data point shows the relative increase of prediction performance, defined as R2/R2PRS-CS (UKBB)-EUR - 1, in which R2PRS-CS (UKBB)-EUR is the R2 of the trait in the EUR population using PRS-CS trained on the UKBB GWAS summary statistics. In UKBB target populations (panels a and c), R2 were averaged across 100 random splits of the target samples into validation and testing datasets. The crossbar indicates the median of the relative increase of predictive performance across the traits examined. “median N” indicates the median sample size across the respective discovery GWAS.
Extended Data Fig. 9
Extended Data Fig. 9. Trace plots and autocorrelation functions (ACFs) for assessing the convergence and mixing of the Gibbs sampler used in PRS-CSx.
Left panels: Trace plots, after discarding the burn-in iterations and thinning the Markov chain by a factor of 5, for the posterior effects of rs7412 on low-density lipoprotein cholesterol when integrating UKBB, BBJ and PAGE GWAS summary statistics using PRS-CSx. Right panels: The autocorrelation functions (ACFs) for the traces shown on the left.
Figure 1:
Figure 1:. Overview of polygenic prediction methods.
The predictive performances of three representative single-discovery methods: (i) LD-informed pruning and p-value thresholding (PT); (ii) LDpred2; (iii) PRS-CS; and five multi-discovery methods: (i) PT-meta; (ii) PT-mult; (iii) LDpred2-mult; (iv) PRS-CS-mult; (v) PRS-CSx are compared in this study. LDpred2-mult and PRS-CS-mult depicted here are not published methods but are helpful for comparing potential improvements from PRS-CSx that uses a coupled continuous shrinkage prior for the effect sizes of genetic variants. The discovery samples (to generate GWAS summary statistics), validation samples (to tune hyper-parameters in PRS construction methods) and testing samples (to assess prediction accuracy) are non-overlapping. LD ref: LD reference panel; pop A/B/C: Population A/B/C.
Figure 2:
Figure 2:. Prediction accuracy of single-discovery and multi-discovery polygenic prediction methods in simulations.
1% HapMap3 variants were randomly sampled as causal variants, which in aggregation explained 50% of phenotypic variation in each population. Causal variants were shared across populations with a cross-population genetic correlation of 0.7. 100K simulated EUR samples and 20K non-EUR (EAS or AFR) samples were used as the discovery dataset. Each bar shows the squared correlation (R2) between the simulated and predicted phenotypes for a polygenic prediction method in an independent testing dataset, averaged across 20 simulation replicates. Error bar indicates the standard deviation of R2 across replicates. Prediction accuracy for each simulation replicate is overlaid on the bar plot.
Figure 3:
Figure 3:. Relative prediction accuracy for quantitative traits within each target population.
Relative prediction performance for single-discovery and multi-discovery PRS construction methods using discovery GWAS summary statistics a, from UKBB and BBJ, across 33 traits, in different UKBB target populations (EUR, EAS and AFR); b, from UKBB and BBJ, across 21 traits, in the Taiwan Biobank (TWB); c, from UKBB, BBJ and PAGE, across 14 traits, in different UKBB target populations (EUR, EAS and AFR). Each data point shows the relative increase of prediction performance, defined as R2/R2PRS-CS (UKBB) - 1, in which R2PRS-CS (UKBB) is the R2 of the trait in the same target population using PRS-CS trained on the UKBB GWAS summary statistics. In UKBB target populations (panels a and c), R2 was averaged across 100 random splits of the target samples into validation and testing datasets. The crossbar indicates the median of the relative increase of predictive performance across the traits examined. “median N” indicates the median sample size across the respective discovery GWAS. The trait MCHC was not included in the AFR panel because its R2 from PRS-CS (UKBB) was almost 0, which inflated relative increase of prediction performance for other methods.
Figure 4:
Figure 4:. Prediction accuracy of schizophrenia risk in EAS cohorts.
a, Prediction accuracy, measured as variance explained (R2) on the liability scale, of single-discovery (trained on EAS or EUR GWAS) and multi-discovery polygenic prediction methods (trained on both EAS and EUR GWAS: EAS+EUR) across 6 EAS schizophrenia cohorts. Each dot represents one testing cohort, with the size of the dot being proportional to its effective sample size, calculated as 4/(1/Ncase+1/Ncontrol), and the shape of the dot representing the country where the sample was collected. Crossbar indicates the median R2 on the liability scale. b, The center of the error bar shows the proportion of schizophrenia cases of the bottom 2%, 5%, 10% and top 2%, 5%, 10% of the PRS distribution, constructed by LDpred2 trained on EAS GWAS (the best-performing single-discovery method) and PRS-CSx (the best-performing multi-discovery method), across 6 EAS schizophrenia cohorts (9,416 cases, 8,708 controls). Error bar indicates 95% confidence intervals.

References

    1. Khera AV et al. Genome-wide polygenic scores for common diseases identify individuals with risk equivalent to monogenic mutations. Nat. Genet 50, 1219–1224 (2018). - PMC - PubMed
    1. Khera AV et al. Polygenic prediction of weight and obesity trajectories from birth to adulthood. Cell 177, 587–596.e9 (2019). - PMC - PubMed
    1. Torkamani A, Wineinger NE & Topol EJ The personal and clinical utility of polygenic risk scores. Nat. Rev. Genet 19, 581–590 (2018). - PubMed
    1. Chatterjee N, Shi J & García-Closas M Developing and evaluating polygenic risk prediction models for stratified disease prevention. Nat. Rev. Genet 17, 392–406 (2016). - PMC - PubMed
    1. Zheutlin AB et al. Penetrance and pleiotropy of polygenic risk scores for schizophrenia in 106,160 patients across four health care systems. Am. J. Psychiatry 176, 846–855 (2019). - PMC - PubMed

Publication types