. 2022 Aug;100(7):547-561.
doi: 10.1111/imcb.12556. Epub 2022 Jun 2.

The balance of interleukin-12 and interleukin-23 determines the bias of MAIT1 versus MAIT17 responses during bacterial infection

Affiliations

The balance of interleukin-12 and interleukin-23 determines the bias of MAIT1 versus MAIT17 responses during bacterial infection

Huimeng Wang et al. Immunol Cell Biol. 2022 Aug.

Abstract

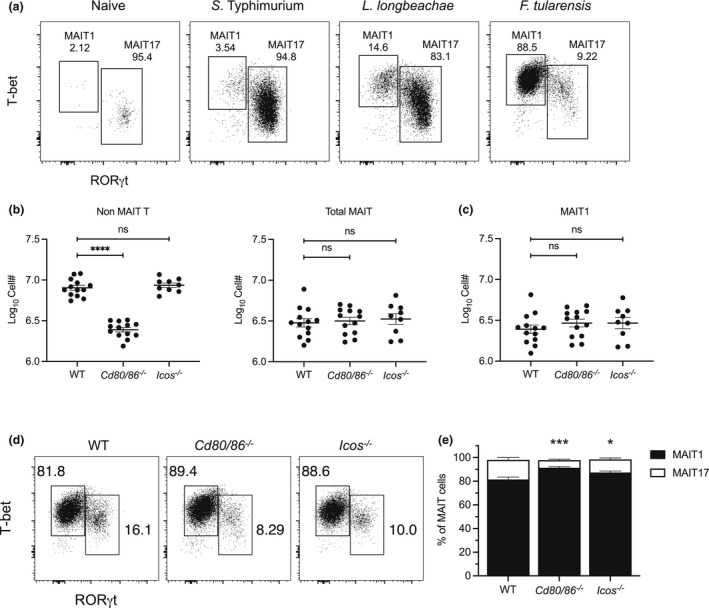
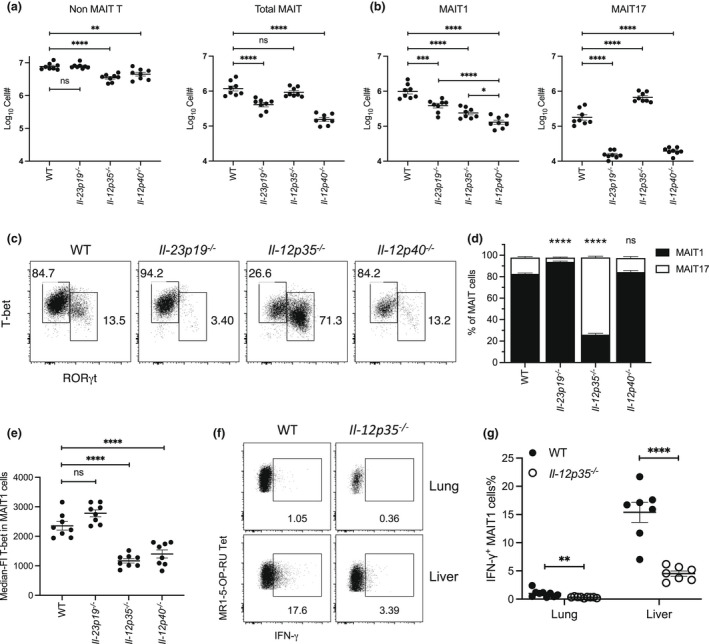
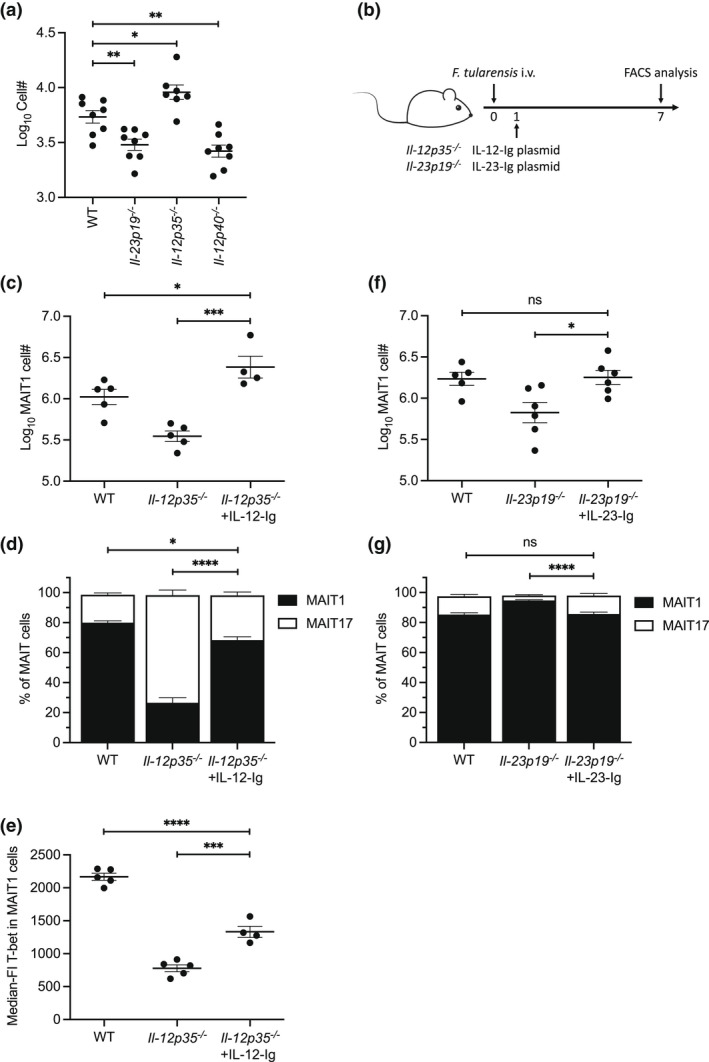
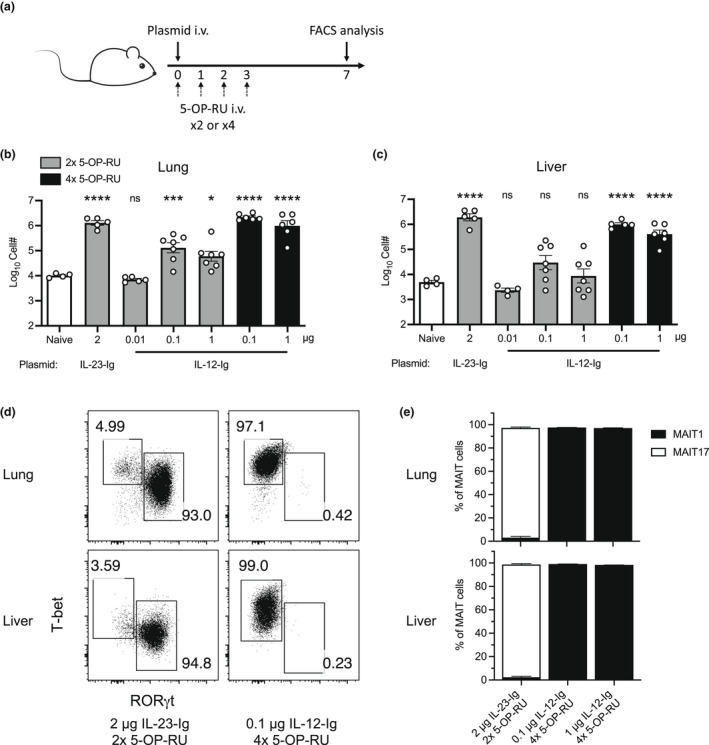
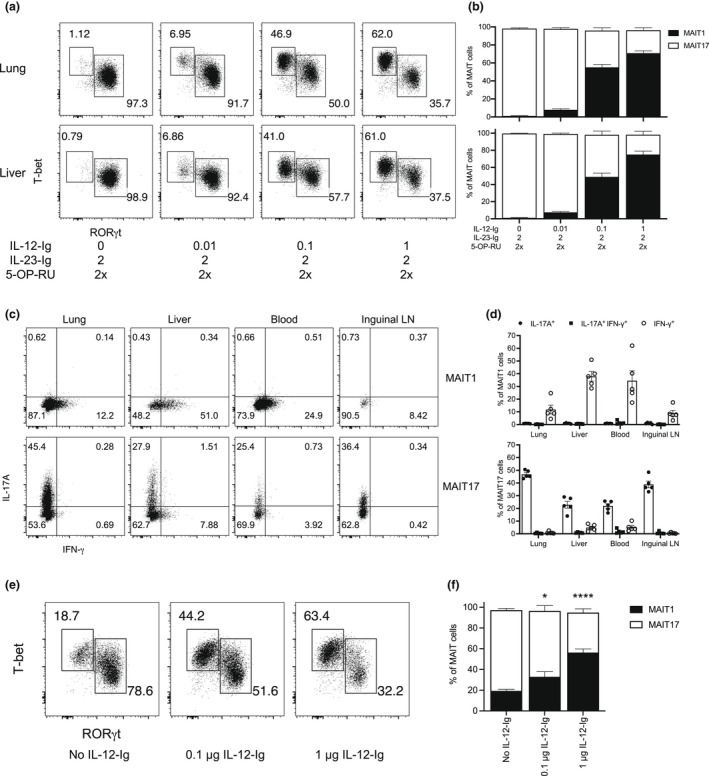
Mucosal-associated invariant T (MAIT) cells are a major subset of innate-like T cells mediating protection against bacterial infection through recognition of microbial metabolites derived from riboflavin biosynthesis. Mouse MAIT cells egress from the thymus as two main subpopulations with distinct functions, namely, T-bet-expressing MAIT1 and RORγt-expressing MAIT17 cells. Previously, we reported that inducible T-cell costimulator and interleukin (IL)-23 provide essential signals for optimal MHC-related protein 1 (MR1)-dependent activation and expansion of MAIT17 cells in vivo. Here, in a model of tularemia, in which MAIT1 responses predominate, we demonstrate that IL-12 and IL-23 promote MAIT1 cell expansion during acute infection and that IL-12 is indispensable for MAIT1 phenotype and function. Furthermore, we showed that the bias toward MAIT1 or MAIT17 responses we observed during different bacterial infections was determined and modulated by the balance between IL-12 and IL-23 and that these responses could be recapitulated by cytokine coadministration with antigen. Our results indicate a potential for tailored immunotherapeutic interventions via MAIT cell manipulation.

Keywords: IL-12; IL-23; MAIT cells; bacterial infection; mucosal-associated invariant T cells.


Conflict of interest statement

SBGE, JYWM, DPF, JM, AJC and ZC are inventors on patents (WO2014/005194 and WO2015/149130) describing MR1 tetramers and MR1 ligands. The other authors declare that they have no competing interests.

Figures

Figure 1
Figure 1
Optimal lung MAIT1 subset response during systemic Francisella tularensis infection is independent of inducible T‐cell costimulator (ICOS) and CD28. (a) Representative flow cytometric plots showing transcription factor profiles of MAIT cells isolated from lungs of C57BL/6 [wild‐type (WT)] mice uninfected, or at day 7 after intranasal infection with 106Salmonella Typhimurium or 104Legionella longbeachae, or at day 7 after intravenous infection with 104 CFU F. tularensis. Frequency of MAIT1 (T‐bet+ RORγt) and MAIT17 (RORγt+) subsets is indicated. (b–e) WT, Cd80/86 −/− and Icos −/− mice were infected with 104F. tularensis via the intravenous route. Lungs and livers were harvested for analysis at day 7 after infection. (b) Absolute numbers of non‐MAIT αβ T cells, MAIT cells and (c) MAIT1 cells in the lungs. Data show means ± s.e.m. and individual mice (n = 9 or 13) from three independent experiments. ****P < 0.0001, one‐way ANOVA with Dunnett's multiple comparisons. (d) Representative plots and (e) stacked plots showing the frequency of MAIT1 and MAIT17 subsets in the lungs. Data show means ± s.e.m. (n = 9) from two independent experiments. *P < 0.05, ***P < 0.001, one‐way ANOVA with Dunnett's multiple comparisons performed on MAIT1 cell% between WT and each genetic knockout strain. See also Supplementary figures 1 and 2. MAIT, mucosal‐associated invariant T; ns, not significant.
Figure 2
Figure 2
IL‐12 and IL‐23 promote MAIT1 cell responses during Francisella tularensis infection. Wild‐type (WT), Il‐23p19 −/− , Il‐12p35 −/− and Il‐12p40 −/− mice were infected with 103 colony‐forming units of F. tularensis via the intravenous route. Lungs and livers were harvested for analysis at day 7 after infection. (a) Absolute numbers of non‐MAIT αβ T cells and MAIT cells in lungs. Data show means ± s.e.m. and individual mice (n = 8) from two independent experiments. **P < 0.01, ****P < 0.0001, one‐way ANOVA with Dunnett's multiple comparisons. (b) Absolute numbers of MAIT1 and MAIT17 cells in lungs. Data show means ± s.e.m. and individual mice (n = 8). *P < 0.05, ***P < 0.001, ****P < 0.0001, one‐way ANOVA with Tukey's multiple comparisons performed between all groups. (c) Representative flow cytometry plots and (d) stacked plots showing frequency of MAIT1 and MAIT17 subsets in lungs. Data show means ± s.e.m. (n = 8). ****P < 0.0001, one‐way ANOVA with Dunnett's multiple comparisons performed on MAIT1 cell percentage between WT and each genetic knockout strain. (e) Expression of T‐bet in lung MAIT1 cells. Data show means ± s.e.m. and individual mice (n = 8). ****P < 0.0001, one‐way ANOVA with Dunnett's multiple comparisons. (f) Representative flow cytometric plots and (g) scatter plots showing IFNγ production in MAIT1 cells isolated from lungs and livers of WT and Il‐12p35 −/− mice. Cells were cultured with Golgi plug for 4 h without any further stimulation. Data show means ± s.e.m. and individual mice (n = 7) from two independent experiments. **P < 0.01, ****P < 0.0001, unpaired t‐test. See also Supplementary figure 3. 5‐OP‐RU, 5‐(2‐oxopropylideneamino)‐6‐d‐ribitylaminouracil; IL, interleukin; MAIT, mucosal‐associated invariant T; MR1, MHC‐related protein 1; ns, not significant.
Figure 3
Figure 3
Exogenous IL‐12 and IL‐23 restores lung mucosal‐associated invariant T (MAIT) cell expansion in IL‐12‐ and IL‐23‐ deficient mice respectively. (a) Absolute numbers of MAIT cells in the lungs of naïve wild‐type (WT), Il‐23p19 −/−, Il‐12p35 −/− and Il‐12p40 −/− mice. Data show means ± s.e.m. and individual mice (n = 7 or 8) from two independent experiments. *P < 0.05, **P < 0.01, one‐way ANOVA with Dunnett's multiple comparisons. (b) Experimental scheme for infection and cytokine reconstitution. (c–e) Il‐12p35 −/− and (F‐G) Il‐23p19 −/− mice were intravenously infected with 103Francisella tularensis and then received 0.02 μg IL‐12‐Ig‐ and 2 μg IL‐23‐Ig‐encoding plasmid, respectively, via hydrodynamic injection on day 1 after infection. Lungs and livers were harvested for analysis at day 7 after infection. (c) Absolute numbers of MAIT cells in lungs of mice from indicated groups. Data show means ± s.e.m. and individual mice (n = 4 or 5) from two independent experiments. *P < 0.05, ***P < 0.001, one‐way ANOVA with Dunnett's multiple comparisons. (d) Stacked plots showing frequency of MAIT1 and MAIT17 subsets in lungs. Data show means ± s.e.m. *P < 0.05, ****P < 0.0001, one‐way ANOVA with Dunnett's multiple comparisons was performed on MAIT1 cell%. (e) Expression of T‐bet protein in lung MAIT1 subsets. Data show means ± s.e.m. and individual mice. ***P < 0.001, ****P < 0.0001, one‐way ANOVA with Dunnett's multiple comparisons. (f) Absolute numbers of MAIT cells in lungs of mice from indicated groups. Data show means ± s.e.m. and individual mice (n = 5 or 6) from two independent experiments. *P < 0.05, one‐way ANOVA with Dunnett's multiple comparisons. (g) Stacked plots showing frequency of MAIT1 and MAIT17 subsets in lungs. Data show means ± s.e.m. ****P < 0.0001, one‐way ANOVA with Dunnett's multiple comparisons was performed on MAIT1 cell%. See also Supplementary figure 4. IL, interleukin; ns, not significant.
Figure 4
Figure 4
Administration of interleukin‐12 (IL‐12) and synthetic mucosal‐associated invariant T (MAIT) antigen drives systemic MAIT1 cell expansion. (a) Experimental scheme for MAIT cell expansion. Wild‐type mice were infused with plasmids coding IL‐12‐Ig or IL‐23‐Ig via hydrodynamic injection on day 0, followed by two or four doses of synthetic antigen 5‐(2‐oxopropylideneamino)‐6‐d‐ribitylaminouracil (5‐OP‐RU) injection (Two doses: days 0 and 2; four doses: days 0, 1, 2 and 3). Lungs and livers were collected and analyzed on day 7. (b, c) Absolute numbers of MAIT cells in (b) lungs and (c) livers of mice untreated or administered with indicated doses of cytokine‐coding plasmids and synthetic antigen. Data show means ± s.e.m. and individual mice (n = 4, 5, 6 or 7) from three independent experiments. Data show means ± s.e.m. and individual mice. *P < 0.05, ***P < 0.001, ****P < 0.0001, one‐way ANOVA with Dunnett's multiple comparisons was performed between naïve and each treated group. (d) Representative flow cytometric plots and (e) stacked plots showing frequency of MAIT1 and MAIT17 subsets in lungs and livers of mice with indicated treatments. Data show means ± s.e.m. (n = 3 or 6) from two independent experiments. See also Supplementary figure 5. IL, interleukin; i.v., intravenous; ns, not significant.
Figure 5
Figure 5
Activation and expansion of mucosal‐associated invariant T (MAIT) cell subsets to synthetic antigen or bacterial infection are modulated by the ratio of IL‐12 to IL‐23. (a) Representative flow cytometric plots and (b) stacked plots showing frequency of MAIT1 and MAIT17 subsets in lungs and livers at day 7 of wild‐type (WT) mice administered with indicated doses of cytokine‐coding plasmid and two doses of 5‐(2‐oxopropylideneamino)‐6‐d‐ribitylaminouracil (5‐OP‐RU). Data show means ± s.e.m. and individual mice (n = 7 or 8) from three independent experiments. (c) Representative FACS plots and (d) scatter plots showing production of IL‐17A and interferon‐gamma (IFNγ) by MAIT1 and MAIT17 cells, as detected by intracellular cytokine staining, ex vivo, from indicated organs of WT mice at day 7 after administration of 0.1 μg IL‐12‐Ig and 2 μg IL‐23‐Ig plasmids and two doses of 5‐OP‐RU. Data show means ± s.e.m. and individual mice (n = 5) from two independent experiments. (e) Representative flow cytometric plots and (f) stacked plots showing frequency of MAIT1 and MAIT17 subsets in lungs of WT mice at day 7 after intranasal infection with 104Legionella longbeachae. Mice were then infused with indicated doses of IL‐12‐Ig plasmid at day 2 after infection. Data show means ± s.e.m. (n = 6 or 7) from two independent experiments. *P < 0.05, ****P < 0.0001, one‐way ANOVA with Dunnett's multiple comparisons performed on MAIT1 cell % compared with the untreated group. See also Supplementary figure 6. IL, interleukin; LN, lymph node.

Similar articles

Cited by

References

    1. McGeachy MJ, Cua DJ. Th17 cell differentiation: the long and winding road. Immunity 2008; 28: 445–453. - PubMed
    1. Ruterbusch M, Pruner KB, Shehata L, Pepper M. In vivo CD4+ T cell differentiation and function: revisiting the Th1/Th2 paradigm. Annu Rev Immunol 2020; 38: 705–725. - PubMed
    1. Saravia J, Chapman NM, Chi H. Helper T cell differentiation. Cell Mol Immunol 2019; 16: 634–643. - PMC - PubMed
    1. Lepore M, Kalinichenko A, Colone A, et al. Parallel T‐cell cloning and deep sequencing of human MAIT cells reveal stable oligoclonal TCRβ repertoire. Nat Commun 2014; 5: 3866. - PubMed
    1. Reantragoon R, Corbett AJ, Sakala IG, et al. Antigen‐loaded MR1 tetramers define T cell receptor heterogeneity in mucosal‐associated invariant T cells. J Exp Med 2013; 210: 2305–2320. - PMC - PubMed

Publication types