

Inhibition of pyrimidine biosynthesis targets protein translation in acute myeloid leukemia
- PMID: 35514210
- PMCID: PMC9260210
- DOI: 10.15252/emmm.202115203
Inhibition of pyrimidine biosynthesis targets protein translation in acute myeloid leukemia
Abstract
The mitochondrial enzyme dihydroorotate dehydrogenase (DHODH) catalyzes one of the rate-limiting steps in de novo pyrimidine biosynthesis, a pathway that provides essential metabolic precursors for nucleic acids, glycoproteins, and phospholipids. DHODH inhibitors (DHODHi) are clinically used for autoimmune diseases and are emerging as a novel class of anticancer agents, especially in acute myeloid leukemia (AML) where pyrimidine starvation was recently shown to reverse the characteristic differentiation block in AML cells. Herein, we show that DHODH blockade rapidly shuts down protein translation in leukemic stem cells (LSCs) and has potent and selective activity against multiple AML subtypes. Moreover, we find that ablation of CDK5, a gene that is recurrently deleted in AML and related disorders, increases the sensitivity of AML cells to DHODHi. Our studies provide important molecular insights and identify a potential biomarker for an emerging strategy to target AML.
Keywords: DHODH; acute myeloid leukemia; leukemic stem cells; protein translation.
© 2022 The Authors. Published under the terms of the CC BY 4.0 license.
Figures
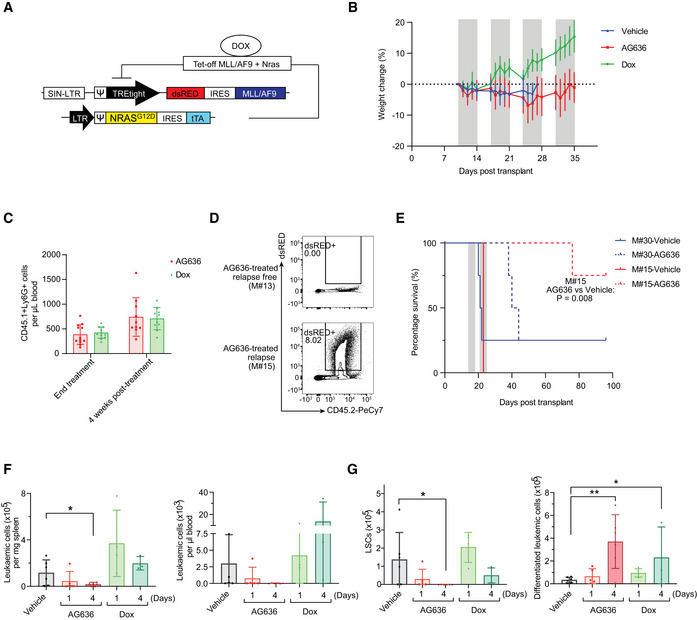
Schematic of MN model.
Body weight of MN tumor‐bearing mice treated with AG636. Gray bars denote treatment. Dotted line defines zero percent weight loss.
Number of recipient‐derived myeloid cells (CD45.1+CD11b+Ly6G+) in the peripheral blood of AG636‐ or doxycycline‐treated recipients at the conclusion of therapy and after 4 weeks (n = 8–10 mice/group).
Representative FACS plots of the bone marrow from a mouse with no detectable disease (M#13) and a relapsed mouse (M#15).
Kaplan–Meier survival curve of secondary recipients transplanted with leukemic cells from the relapsed donor (M#15) or a control donor from the vehicle group (M#30). Gray bars denote treatment (n = 4 mice/group, median survival is 21.5 for vehicle‐treated M#30, 42 for AG636‐treated M#30, 23 for vehicle‐treated M#15, and not reached for AG636‐treated M#15, the P value was calculated by log‐rank test).
Number of MN cells in the spleen and peripheral blood quantified by flow cytometry (n = 3–6 mice/group).
Number of LSCs (CD11blowcKithighFcgR+) and differentiated leukemic cells (CD182+Ly6G+) in the bone marrow (n = 3–6 mice/group).

Frequency of MN leukemic cells expressing the immature marker cKit and mature myeloid marker Ly6G in the peripheral blood following 5 days of treatment (n = 9–10 mice/group; mice with < 2% tumor burden in any condition were censored from the analysis).
Absolute number of MN cells in the peripheral blood quantified by flow cytometry. Gray bars denote treatment (n = 11–12 mice/group).
Kaplan–Meier survival curve of leukemic mice (n = 11–12 mice/group, median survival is 16.5 for vehicle and not reached for AG636 and doxycycline, P < 0.0001 by log‐rank test).
Representative FACS plots showing differentiation induced by AG636 and doxycycline.
Spleen weights of MN tumor‐bearing mice (n = 3–6 mice/group).
Absolute number of MN cells in the bone marrow (n = 3–6 mice/group).
Frequency (as percentage of all MN cells) of LSCs (CD11blowcKithighFcgR+) and differentiated cells (CD182+Ly6G+) in the bone marrow (n = 3–6 mice/group).
May‐Grunwald‐Giemsa‐stained cytospins of sorted MN cells showing myeloid differentiation.
Quantification of functionally defined LSCs using a limiting dilution assay calculated by ELDA (n = 4–8 mice/group).

- A
Spleen weights of RUNX1‐RUNX1T1 or I1DN tumor‐bearing mice treated with AG636 or vehicle for 4 days.
- B, C
Absolute number of leukemic cells in the bone marrow (B) and spleens (C) of RUNX1‐RUNX1T1 or I1DN tumor‐bearing mice treated with AG636 or vehicle for 4 days.
- D, E
Frequency of leukemic cells expressing the immature marker cKit and mature myeloid marker CD11b in the bone marrow and spleens of RUNX1‐RUNX1T1 (D) or I1DN (E) tumor‐bearing mice treated with AG636 or vehicle for 4 days (n = 6 mice/group).

- A
Schematic of hematopoietic differentiation.
- B–D
Various bone marrow populations were quantified by flow cytometry in mice treated with AG636 or vehicle for 1 or 4 days (acute treatment) or for 4 cycles followed by 4 weeks off treatment (post‐recovery).
- E–H
Peripheral blood red blood cells (E), platelets (F), myeloid cells (G), and lymphoid cells (H) were quantified in mice treated with AG636 or vehicle. Gray bars denote treatment.

- A, B
RNA sequencing performed on cKithighCD11blow MN cells sorted from AG636, doxycycline, or vehicle‐treated mice (n = 3 mice/group). Venn diagram showing overlap in DEGs between different treatment conditions (A). Gene set enrichment analysis showing common and differential enrichment of biological pathways in gene expression data from AG636‐ or doxycycline‐treated animals. Gene sets are from C2:CGP and Reactome subcollections in MSigDB database (see methods for more information) (B).
- C
RNA sequencing performed on cKit+CD11b‐ RUNX1‐RUNX1T1 or I1DN cells sorted from mice treated with AG636 or vehicle for 1 day (n = 3 mice/group). Bar code plots showing enrichment of selected pathways.
- D
Venn diagram showing the overlap of genes in the core enrichment within the Reactome Translation gene set in the MN, RUNX1‐RUNX1T1, and I1DN models.
- E, F
qPCR showing downregulation of genes encoding ribosomal proteins in MN cells (E) and human AML cell lines (F) treated for 24 h with AG636 (n = 3 biological replicates for each cell line).
- G, H
Polysome profiling of MN cells treated in vitro with AG636 or vehicle for 24 h. Representative trace (G) and quantification of subpolysome and heavy polysome fractions (H) determined by measuring the area under the curve (AUC) (n = 4 biological replicates).
- I
Nascent protein synthesis quantified using the AHA incorporation assay in MN or MOLM13 cells treated with AG636 for 24 h or cycloheximide for 1 h. Cells that were cultured in the absence of AHA served as a negative control (n = 3 biological replicates).

Venn diagram showing the overlap in DEGs in the MN, RUNX1‐RUNX1T1, and I1DN models.
Gene set enrichment analysis showing the enrichment of selected biological pathways in gene expression data from RUNX1‐RUNX1T1 and I1DN murine AML models following AG636 treatment. Gene sets are from C2:CGP and Reactome subcollections in MSigDB database (see methods for more information).
Barcode plots showing downregulation of TGF‐β signaling in RUNX1‐RUNX1T1 and I1DN murine AML models following AG636 treatment.
Gene expression heat map showing downregulation of genes encoding components of RNA polymerase I in RUNX1‐RUNX1T1 and I1DN murine AML models following AG636 treatment.
Volcano plot of gene expression in MN cells, highlighting the average transcript half‐life of each gene (left) and bar chart of the number of genes with transcript half‐lives in the given interval for significant DEGs (right). Transcript half‐life was provided by (Schwanhäusser et al, 2011).

Western blot of ATF4, DOT1L, and MYC in MN cells treated with AG636 for 24 h.
Violin plot of YY1 ChIPseq enrichment scores at the promoter regions (+1,000 bp to −50 bp from TSS) of genes within the indicated gene sets extracted from ENCODE 3 (n = 24 genes for translation genes, n = 707 genes for AG636 downregulated genes, n = 4,237 for the other genes).
Screenshot from UCSC genome browser (
http://genome.ucsc.edu/index.html ) of YY1 enrichment at the promoter regions of translation genes RPL13A and PRL18A in 11 out of 12 cell lines in ENCODE3 data.Western blot for YY1 in MN cells co‐treated with AG636 and PUGNAc for 24 h.
qPCR showing the expression of translation genes in MOLM13 (right) or MN cells (left) co‐treated with AG636 and PUGNAc or uridine for 24 h.
Nascent protein synthesis quantified using the AHA incorporation assay in MN or MOLM13 cells co‐treated with AG636 and PUGNAc or uridine for 24 h (n = 3 biological replicates).
Proliferation assay in MN or MOLM13 cells co‐treated with AG636 and PUGNAc or uridine for 24 h (n = 3 biological replicates).

- A, B
ATAC sequencing performed on cKithighCD11blow MN cells sorted from mice treated with AG636 or vehicle for 2 days (n = 3 mice/group). HOMER motif analysis showing transcription factor motifs enriched within regions of differential chromatin accessibility (A). HOMER motif analysis showing the enrichment of YY1 motifs within regions of accessible chromatin associated with translation genes. All other regions of open chromatin were used as the background (B).
- C
Rank plots of ChIPseq enrichment scores of transcription factors at the promoter regions (+1,000 bp to −50 bp from TSS) of genes within the indicated gene sets extracted from ENCODE 3 (n = 24 genes for translation genes, n = 707 genes for AG636 downregulated genes, n = 4,237 for the other genes).
- D
ChIPqPCR showing the binding of YY1 at the promoter regions of selected translation genes in MN cells treated with AG636 or DMSO. For each replicate, enrichment was normalized to YY1 pull‐down in DMSO‐treated cells (n = 2 biological replicates).
- E
Time‐course showing global downregulation of O‐GlcNAcylation and YY1 expression in MN cells treated with AG636. The experiment was repeated twice with similar results.
- F
Western blot of YY1 expression in human AML cell lines treated with AG636 for 24 h.
- G
qPCR showing downregulation of genes encoding ribosomal proteins that are putative YY1 targets in Cas9‐expressing MN cells treated with AG636 or DMSO (left), or transduced with sgRNAs targeting YY1 or control sgRNAs (right) (n = 2 biological replicates).
- H
Barcode plots showing downregulation of the Reactome Translation gene set in YY1 knockout pro‐B cells and human melanoma cells upon YY1 knockdown (Kleiman et al, ; Varum et al, 2019).

Distribution of sgRNA counts in the various conditions during the CRISPR screen.
Average fold change in sgRNA counts at time point 10 (top) and at time point 24 (bottom) compared with time point 0 for all sgRNAs targeting components of the INO80 complex in the various conditions in the CRISPR screen.
Gene dependencies in AML cell lines from the DepMap database (Meyers et al, 2017), center line; median; box limits, from the 25th to 75th percentiles; whiskers, from the 5th to 95th percentiles (n = 47 cell lines).

Schematic of the pooled CRISPR screen in MN AML cells.
Rank plot of MAGeCK analysis showing genes that were negatively selected at day 10 in cells treated with 100 or 250 nM AG636.
STRING network analysis showing known interactions between components of the INO80 complex and associated proteins. Blue—INO80 complex genes that are essential (negatively enriched in all conditions); light gray—INO80 complex gene that was positively enriched in all conditions; purple—INO80 complex genes that are AG636 sensitizers (negatively enriched in AG636 condition only); black—other AG636 sensitizers identified in the screen.
Normalized counts for sgRNAs targeting Cdk5, Tfpt, and Morf4l1.
Rank plot of MAGeCK analysis showing genes that were positively selected at day 24 in cells treated with 250 nM AG636.
Normalized counts for sgRNAs targeting Usp22.
Proliferative competition assays in MN cells transduced with individual sgRNAs and cultured in AG636 or DMSO (n = 2 biological replicates).
- A, B
Proliferative competition assays in AML cells transduced with indicated sgRNAs and cultured in AG636 or DMSO (n = 2 biological replicates).
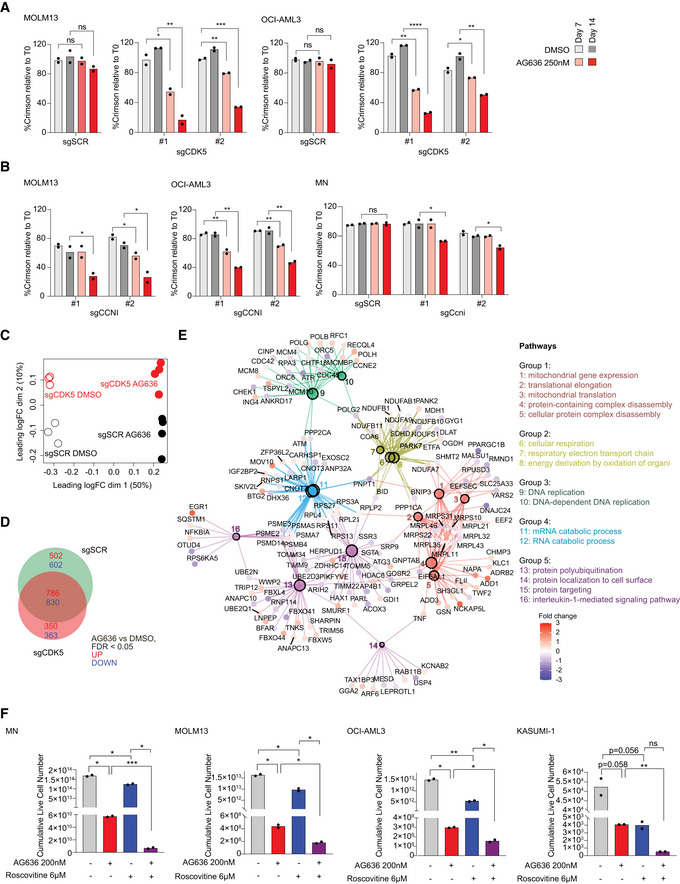
- C–E
RNA sequencing performed on MOLM13 cells transduced with CDK5 or control sgRNAs and treated with AG636 or DMSO (n = 3–4 biological replicates). Multidimensional scaling (MDS) analysis showing the separation of samples by genotype and drug treatment (C). Venn diagram showing the overlap in DEGs between different treatment conditions (D). Network analysis showing enriched GO terms within CDK5 KO‐specific DEGs (see Materials and Methods for more information) (E).
- F
AML cells were treated with AG636, Roscovitine, or the combination for 17 days. Cumulative live cell counts are shown (n = 2 biological replicates).

Proliferative competition assays in human AML cell lines transduced with CDK5‐targeting or scrambled sgRNAs and cultured in various inhibitors or DMSO (n = 2 biological replicates). Dashed line defines no changes compared with time point 0.
Proliferative competition assays in human AML cell lines transduced with CDK5R1 sgRNAs and cultured in AG636 or DMSO.
Barcode plots showing downregulation of the Reactome Translation gene set in MOLM13 cells transduced with CDK5‐targeting or scrambled sgRNAs and treated with AG636 or DMSO for 24 h.
Nascent protein synthesis quantified using the AHA incorporation assay in MOLM13 cells transduced with CDK5‐targeting or scrambled sgRNAs and treated with AG636 or DMSO for 24 h. MOLM13 cells treated with cycloheximide for 1 h or cultured in the absence of AHA served as controls (n = 3 biological replicates).
Comment in
-
Targeting the Leukemic stem cell protein machinery by inhibition of mitochondrial pyrimidine synthesis.EMBO Mol Med. 2022 Jul 7;14(7):e16171. doi: 10.15252/emmm.202216171. Epub 2022 Jun 13. EMBO Mol Med. 2022. PMID: 35694783 Free PMC article.
References
-
- Baker A, Gregory GP, Verbrugge I, Kats L, Hilton JJ, Vidacs E, Lee EM, Lock RB, Zuber J, Shortt J et al (2016) The CDK9 inhibitor dinaciclib exerts potent apoptotic and antitumor effects in preclinical models of MLL‐rearranged acute myeloid leukemia. Can Res 76: 1158–1169 - PubMed
-
- Cai Y, Jin J, Yao T, Gottschalk AJ, Swanson SK, Wu SU, Shi Y, Washburn MP, Florens L, Conaway RC et al (2007) YY1 functions with INO80 to activate transcription. Nat Struct Mol Biol 14: 872–874 - PubMed
Publication types
MeSH terms
Substances
Grants and funding
LinkOut - more resources
Full Text Sources
Medical
Molecular Biology Databases
Research Materials
