

Low-Intensity Resistance Exercise Combined With Blood Flow Restriction is More Conducive to Regulate Blood Pressure and Autonomic Nervous System in Hypertension Patients-Compared With High-Intensity and Low-Intensity Resistance Exercise
- PMID: 35514351
- PMCID: PMC9065267
- DOI: 10.3389/fphys.2022.833809
Low-Intensity Resistance Exercise Combined With Blood Flow Restriction is More Conducive to Regulate Blood Pressure and Autonomic Nervous System in Hypertension Patients-Compared With High-Intensity and Low-Intensity Resistance Exercise
Abstract
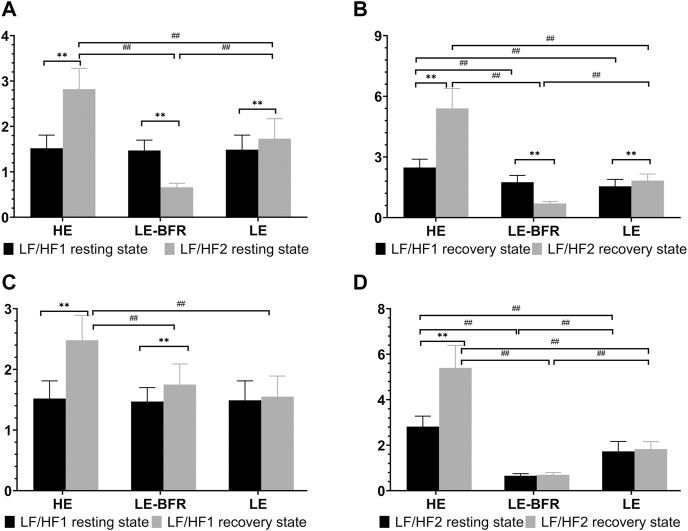
Background: The effect of resistance exercise on the autonomic nervous system of patients with hypertension has not been identified. Objective: To explore a suitable resistance training method for hypertension patients to regulate blood pressure (BP) and autonomic nervous system function. Method: Forty-five hypertension patients aged between 55 and 70 years were randomly equally divided into three groups: the high-intensity resistance exercise (HE) group, the low-intensity resistance exercise combined with blood flow restriction (LE-BFR) group, and the low-intensity resistance exercise (LE) group. All patients performed quadriceps femoris resistance exercise. The exercise intensity of HE, LE-BFR and LE group was 65, 30 and 30% of one repetition maximum (1RM), respectively. The LE-BFR group used pressure cuffs to provide 130% of systolic pressure to the patient's thighs during resistance exercise. The training program was 20 times/min/set with a 1-min break after each set, and was conducted five sets/day and 3 days/week, lasting for 12 weeks. The heart rate (HR), BP, root-mean-square of difference-value of adjacent RR intervals (RMSSD), low frequency (LF) and high frequency (HF) were evaluated before and after the first training and the last training. Result: Significant differences in HR were observed in both recovery states after the first and last training (p < 0.01). After 12 weeks of training, the recovery speed of HR in the LE-BFR group increased significantly (p < 0.01). The systolic blood pressures in the HE and LE-BFR group were significantly reduced (p < 0.05 and p < 0.01), and the differences among groups were significant (p < 0.01). In the last recovery state, the RMSSD of the LE group was significantly lower than that in the first recovery state (p < 0.01). The LF/HF ratios of the HE and LE groups in the resting and recovery states were increased significantly (all p < 0.01). LF/HF ratios in the LE-BFR group in the resting and recovery state were decreased significantly (both p < 0.01). Conclusion: Compared to HE and LE, LE-BFR could effectively decrease systolic pressure and regulate the autonomic nervous system function in hypertension patients.
Keywords: autonomic nervous system; blood flow restriction; blood pressure; hypertension; resistance exercise.
Copyright © 2022 Zhao, Zheng, Ma, Qiang, Lin and Zhou.
Conflict of interest statement
The authors declare that the research was conducted in the absence of any commercial or financial relationships that could be construed as a potential conflict of interest.
Figures


Similar articles
-
Effects of Blood Flow Restriction Resistance Training on Autonomic and Endothelial Function in Persons with Parkinson's Disease.J Parkinsons Dis. 2024;14(4):761-775. doi: 10.3233/JPD-230259. J Parkinsons Dis. 2024. PMID: 38701159 Free PMC article. Clinical Trial.
-
Does Resistance Training with Blood Flow Restriction Affect Blood Pressure and Cardiac Autonomic Modulation in Older Adults?Int J Exerc Sci. 2021 Apr 1;14(3):410-422. doi: 10.70252/OXXF4710. eCollection 2021. Int J Exerc Sci. 2021. PMID: 34055161 Free PMC article.
-
Acute resistance exercise with blood flow restriction in elderly hypertensive women: haemodynamic, rating of perceived exertion and blood lactate.Clin Physiol Funct Imaging. 2018 Jan;38(1):17-24. doi: 10.1111/cpf.12376. Epub 2016 Jun 10. Clin Physiol Funct Imaging. 2018. PMID: 27283375 Clinical Trial.
-
Is There a Minimum Effective Dose for Vascular Occlusion During Blood Flow Restriction Training?Front Physiol. 2022 Apr 8;13:838115. doi: 10.3389/fphys.2022.838115. eCollection 2022. Front Physiol. 2022. PMID: 35464074 Free PMC article.
-
Effect of exercise training on heart rate variability in type 2 diabetes mellitus patients: A systematic review and meta-analysis.PLoS One. 2021 May 17;16(5):e0251863. doi: 10.1371/journal.pone.0251863. eCollection 2021. PLoS One. 2021. PMID: 33999947 Free PMC article.
Cited by
-
Does hypertension exacerbate the age-related exaggerated pressor response to dynamic exercise during post-exercise muscle ischemia?Physiol Rep. 2025 Jun;13(11):e70365. doi: 10.14814/phy2.70365. Physiol Rep. 2025. PMID: 40474786 Free PMC article.
-
Effectiveness of low-load resistance training with blood flow restriction vs. conventional high-intensity resistance training in older people diagnosed with sarcopenia: a randomized controlled trial.Sci Rep. 2024 Nov 18;14(1):28427. doi: 10.1038/s41598-024-79506-9. Sci Rep. 2024. PMID: 39558011 Free PMC article. Clinical Trial.
-
Effects of blood flow restriction training on muscle fitness and cardiovascular risk of obese college students.Front Physiol. 2024 Jan 3;14:1252052. doi: 10.3389/fphys.2023.1252052. eCollection 2023. Front Physiol. 2024. PMID: 38235388 Free PMC article.
-
Hemodynamic analysis of blood flow restriction training: a systematic review.BMC Sports Sci Med Rehabil. 2025 Mar 12;17(1):46. doi: 10.1186/s13102-025-01084-8. BMC Sports Sci Med Rehabil. 2025. PMID: 40075462 Free PMC article.
-
Effects of exercise combined with different dietary interventions on cardiovascular health a systematic review and network meta-analysis.BMC Cardiovasc Disord. 2025 Mar 26;25(1):222. doi: 10.1186/s12872-025-04666-z. BMC Cardiovasc Disord. 2025. PMID: 40140787 Free PMC article.
References
-
- Bellavere F., Cacciatori V., Bacchi E., Gemma M. L., Raimondo D., Negri C., et al. (2018). Effects of Aerobic or Resistance Exercise Training on Cardiovascular Autonomic Function of Subjects with Type 2 Diabetes: A Pilot Study. Nutr. Metab. Cardiovasc. Dis. 28, 226–233. 10.1016/j.numecd.2017.12.008 - DOI - PubMed
-
- Caruso F. R., Arena R., Phillips S. A., Bonjorno J. C., Jr., Mendes R. G., Arakelian V. M., et al. (2015). Resistance Exercise Training Improves Heart Rate Variability and Muscle Performance: a Randomized Controlled Trial in Coronary Artery Disease Patients. Eur. J. Phys. Rehabil. Med. 51, 281–289. - PubMed
LinkOut - more resources
Full Text Sources
Research Materials
Miscellaneous