

A novel water-soluble naked-eye probe with a large Stokes shift for selective optical sensing of Hg2+ and its application in water samples and living cells
- PMID: 35514512
- PMCID: PMC9067316
- DOI: 10.1039/c9ra03924d
A novel water-soluble naked-eye probe with a large Stokes shift for selective optical sensing of Hg2+ and its application in water samples and living cells
Abstract
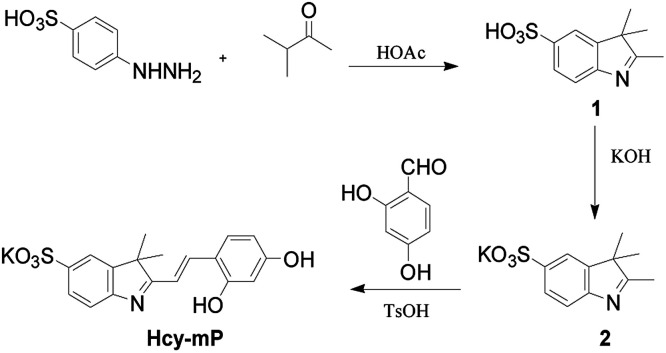
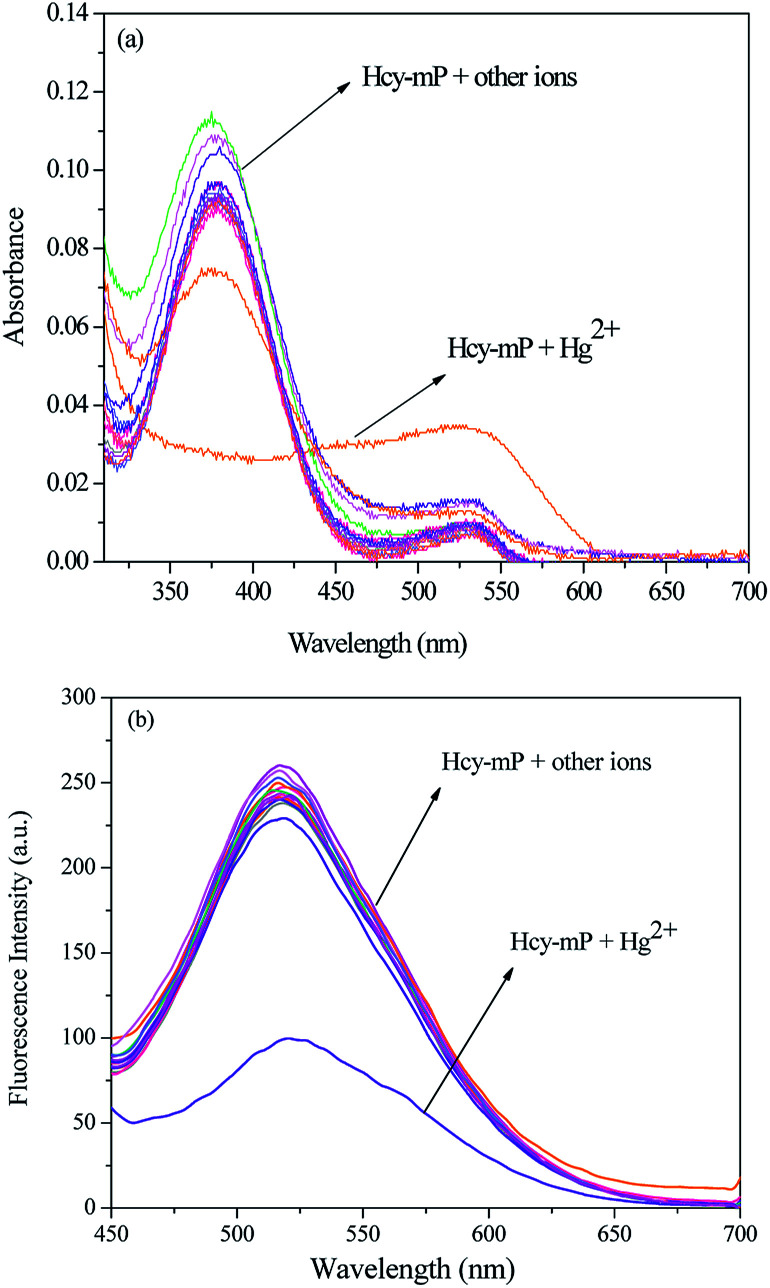
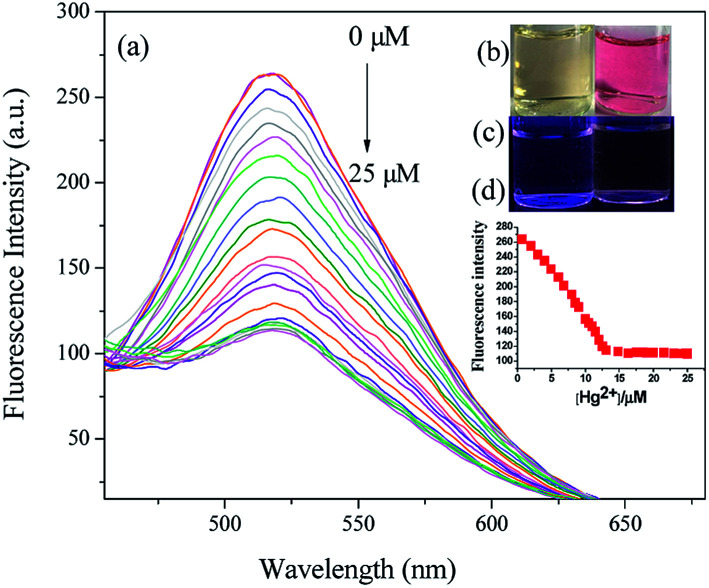
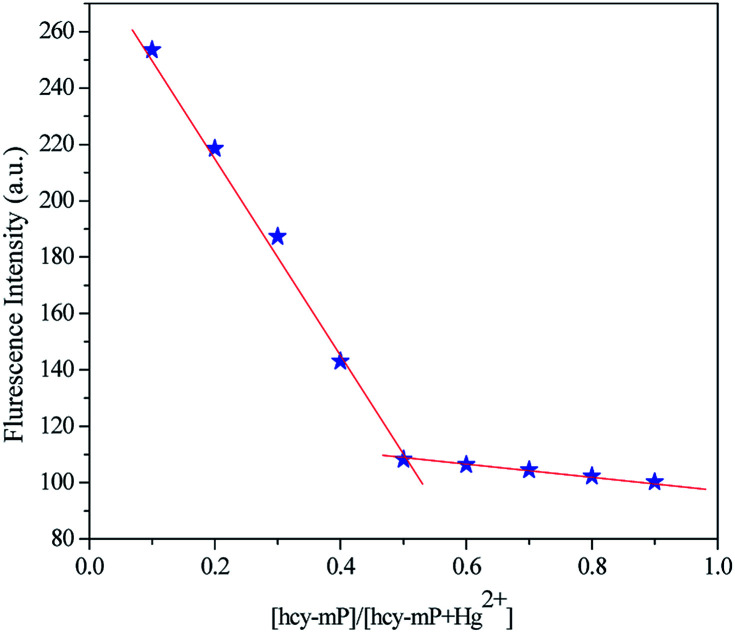
A water-soluble and colorimetric fluorescent probe with a large Stokes shift (139 nm) for rapidly detecting Hg2+, namely Hcy-mP, was synthesized by using an indole derivative and 2,4-dihydroxybenzaldehyde as starting materials. This probe demonstrates good selectivity for Hg2+ over other metal ions including Ag+, Pb2+, Cd2+, Cr3+, Zn2+, Fe3+, Co2+, Ni2+, Cu2+, K+, Na+, Mg2+, and Ca2+ in aqueous solution. With the increase in concentration of Hg2+, the color of the solution changed from pale yellow to pink and the fluorescence intensity decreased slightly. When 5-equivalents of EDTA were added to the solution with Hg2+, the fluorescence intensity of this probe was restored. The probe has been applied to the detection of Hg2+ in real water samples. Moreover, this probe was confirmed to have low cytotoxicity and excellent cell membrane permeability. The effect of Hcy-mP-Hg2+ towards living cells by confocal fluorescence was also investigated.
This journal is © The Royal Society of Chemistry.
Conflict of interest statement
There are no conflicts to declare.
Figures


Similar articles
-
Selective and Sensitive Detection of Hg2+ and Ag+ by a Fluorescent and Colorimetric Probe with Large Stokes Shift.J Fluoresc. 2024 Nov;34(6):2793-2806. doi: 10.1007/s10895-023-03478-8. Epub 2023 Nov 3. J Fluoresc. 2024. PMID: 37922113
-
The new role of dipyrromethene chemosensor for absorbance-ratiometic and fluorescence "turn-on" sensing Zn2+ ions in water-organic solutions and real water samples.Spectrochim Acta A Mol Biomol Spectrosc. 2024 Feb 15;307:123663. doi: 10.1016/j.saa.2023.123663. Epub 2023 Nov 17. Spectrochim Acta A Mol Biomol Spectrosc. 2024. PMID: 37995649
-
An Amidochlorin-Based Colorimetric Fluorescent Probe for Selective Cu(2+) Detection.Molecules. 2016 Jan 18;21(1):E107. doi: 10.3390/molecules21010107. Molecules. 2016. PMID: 26797591 Free PMC article.
-
New NIR spectroscopic probe with a large Stokes shift for Hg2+ and Ag+ detection and living cells imaging.Spectrochim Acta A Mol Biomol Spectrosc. 2022 Apr 15;271:120916. doi: 10.1016/j.saa.2022.120916. Epub 2022 Jan 19. Spectrochim Acta A Mol Biomol Spectrosc. 2022. PMID: 35085998
-
Synthesis and characterization of novel tricyanofuran hydrazone probe: solvatochromism, density-functional theory calculation and selective fluorescence, and colorimetric determination of iron (III).Luminescence. 2021 Aug;36(5):1220-1230. doi: 10.1002/bio.4047. Epub 2021 Apr 13. Luminescence. 2021. PMID: 33792161
Cited by
-
BODIPY-Hg2+ Complex: A Fluorescence "Turn-ON" Sensor for Cysteine Detection.Anal Sci. 2021 Feb 10;37(2):283-292. doi: 10.2116/analsci.20P255. Epub 2020 Aug 28. Anal Sci. 2021. PMID: 32863336
-
A Colorimetric Distinct Color Change Cu(II) 4-{[1-(2,5-dihydroxyphenyl)ethylidene]amino}-1,5-dimethyl-2-phenyl-1,2-dihydro-3H-pyrazol-3-one Chemosensor and its Application as a Paper Test Kit.J Fluoresc. 2023 May;33(3):1089-1099. doi: 10.1007/s10895-022-03034-w. Epub 2022 Dec 27. J Fluoresc. 2023. PMID: 36574186
-
A pH tuning single fluorescent probe based on naphthalene for dual-analytes (Mg2+ and Al3+) and its application in cell imaging.RSC Adv. 2020 Jun 5;10(36):21399-21405. doi: 10.1039/d0ra02101f. eCollection 2020 Jun 2. RSC Adv. 2020. PMID: 35518728 Free PMC article.
References
-
- Yan L. X. Chen Z. P. Zhang Z. Y. Qu C. L. Chen L. X. Shen D. Z. Analyst. 2013;26:4656–4660. - PubMed
-
- Isaad J. Achari A. E. Analyst. 2013;13:83809–83819.
LinkOut - more resources
Full Text Sources
Miscellaneous