

Targeted neurotransmitter metabolomics profiling of oleanolic acid in the treatment of spontaneously hypertensive rats
- PMID: 35514525
- PMCID: PMC9067294
- DOI: 10.1039/c9ra02377a
Targeted neurotransmitter metabolomics profiling of oleanolic acid in the treatment of spontaneously hypertensive rats
Abstract
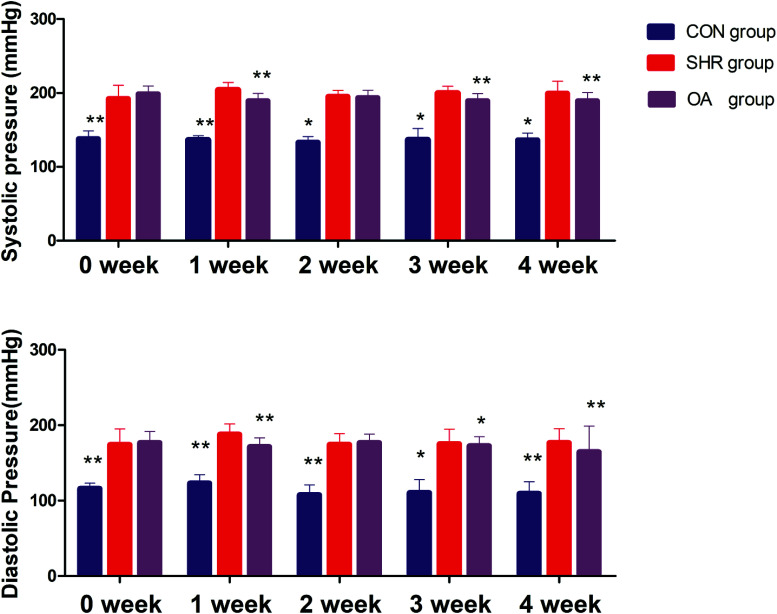
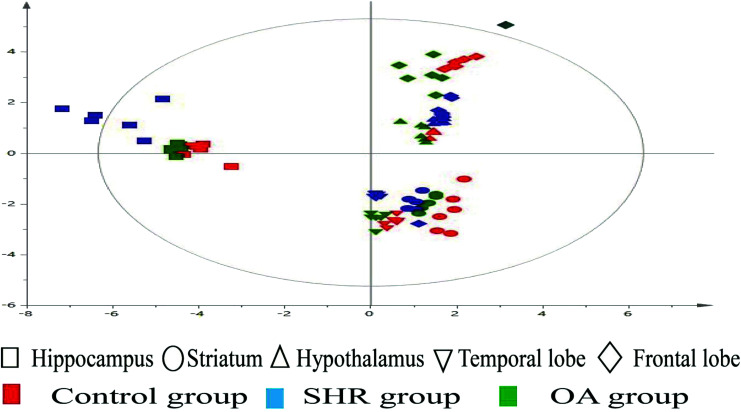
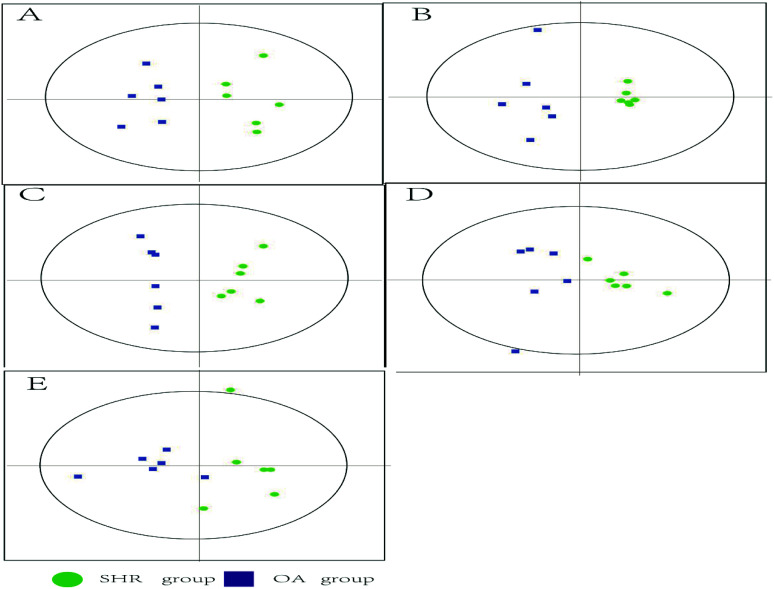
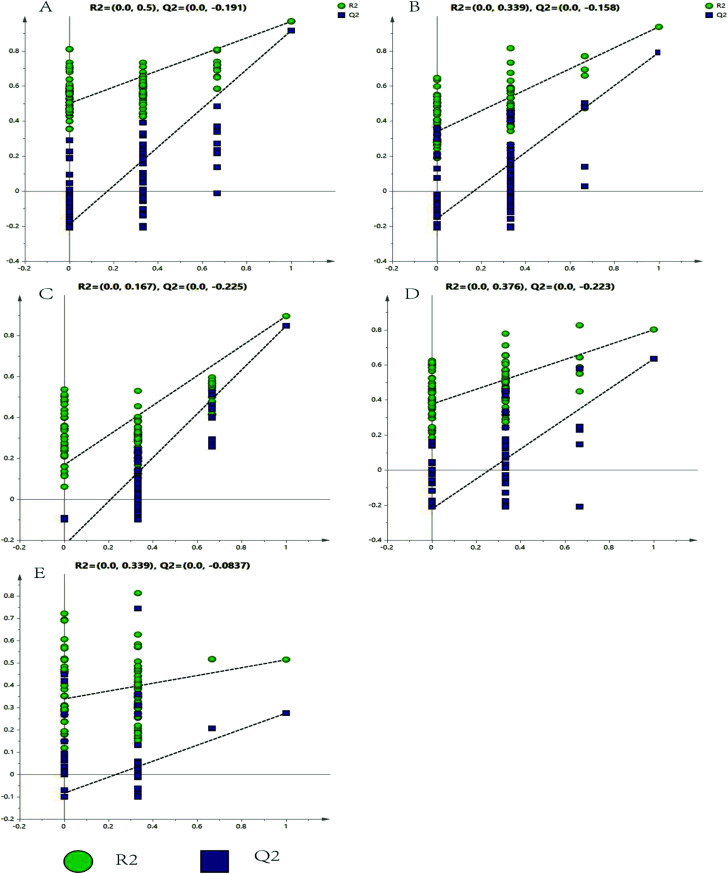
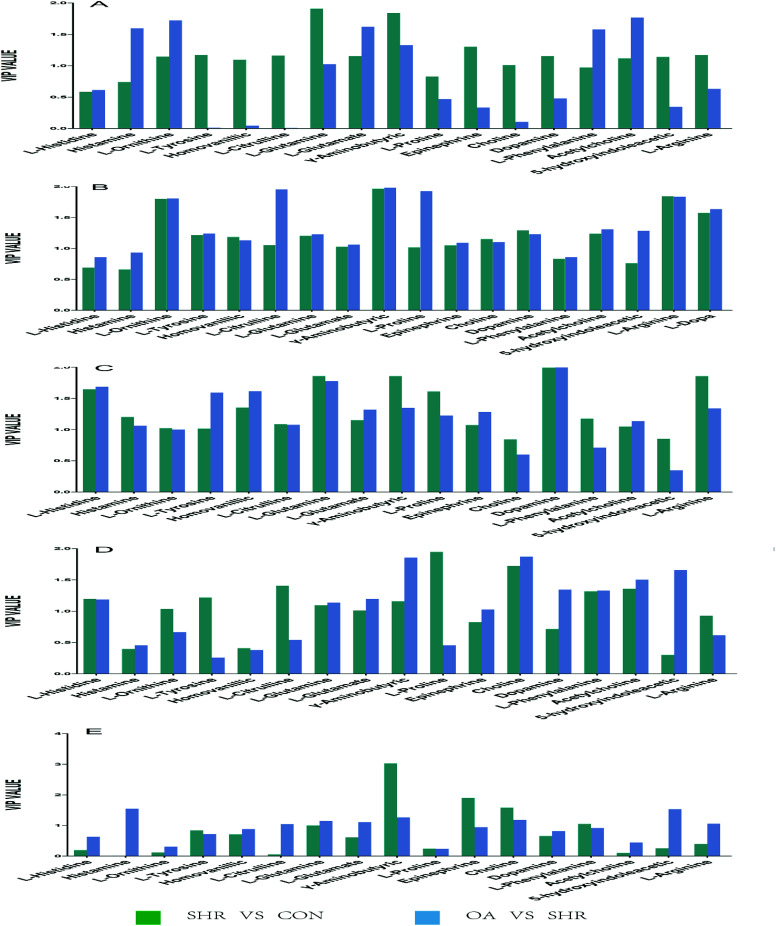
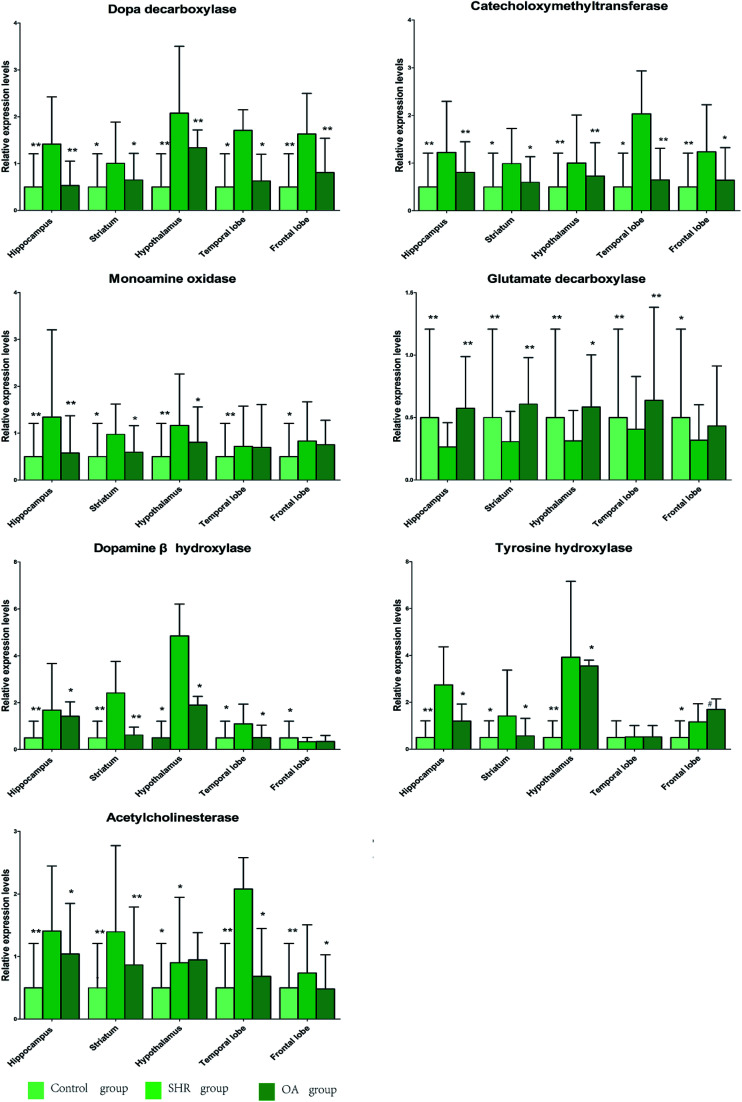
Essential hypertension (EH) is a prevalent chronic medical condition and a major risk factor for cardiovascular morbidity and mortality. Neurotransmitters are involved in the physiological process of blood pressure regulation in the body. Studies have shown that oleanolic acid (OA) can effectively regulate neurotransmitter-related metabolic disorders caused by EH, but the mechanism is still unclear. Here, we studied the neurotransmitter metabolic profiles in five brain regions by targeted metabolomics approaches in spontaneously hypertensive rats (SHRs) treated with OA and vehicle. Samples from five brain regions (hippocampus, striatum, hypothalamus, temporal lobe, and frontal lobe) were collected from the control group, the spontaneously hypertensive rat (SHR) group, and the OA group. Targeted metabolomics based on UPLC-Q-Exactive-MS was employed to characterize the dramatically changed neurotransmitters in the brain regions of SHRs treated with OA and vehicle. The expressions of the key enzymes involved in the neurotransmitter metabolism were detected by the reverse transcription-polymerase chain reaction (RT-PCR). The metabolomic profiles of SHRs pre-protected by OA were significantly different from those of unprotected SHRs. A total of 18 neurotransmitters could be confirmed as significantly altered metabolites, which were involved in tyrosine and glutamate metabolism as well as other pathways. The results showing seven key enzymes in neurotransmitter metabolism further validated the changes in the metabolic pathways. OA could effectively restore tyrosine metabolism in the striatum and hypothalamus, glutamate metabolism in the hippocampus, striatum and temporal lobe, cholinergic metabolism in the striatum, and histidine metabolism in the hypothalamus due to its inhibition of inflammatory reactions, structural damage of the neuronal cells, and increase in sedative activity. This study indicated that brain region-targeted metabolomics can provide a powerful tool to further investigate the possible mechanism of OA in EH.
This journal is © The Royal Society of Chemistry.
Conflict of interest statement
On behalf of all the authors, I declare that we have no conflicts of interest.
Figures
References
LinkOut - more resources
Full Text Sources