

Synthesis and structural studies on (E)-3-(2,6-difluorophenyl)-1-(4-fluorophenyl)prop-2-en-1-one: a promising nonlinear optical material
- PMID: 35514582
- PMCID: PMC9054580
- DOI: 10.1039/d0ra03634j
Synthesis and structural studies on (E)-3-(2,6-difluorophenyl)-1-(4-fluorophenyl)prop-2-en-1-one: a promising nonlinear optical material
Abstract
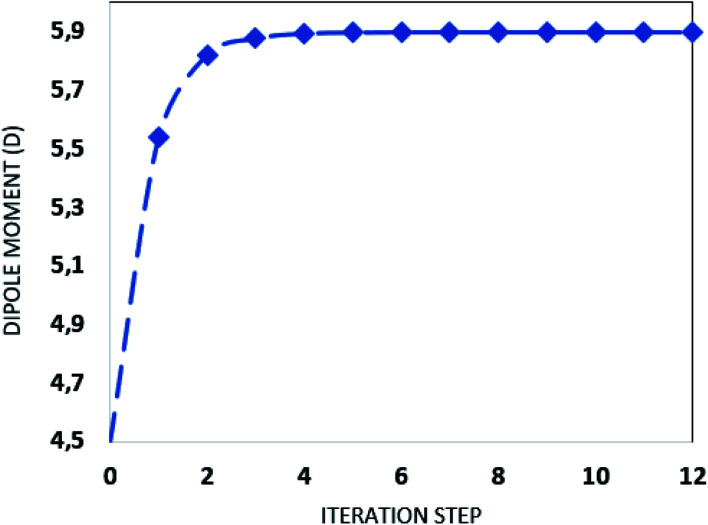
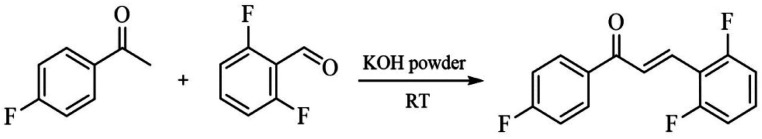
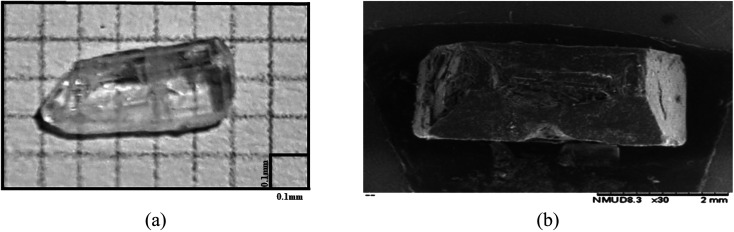
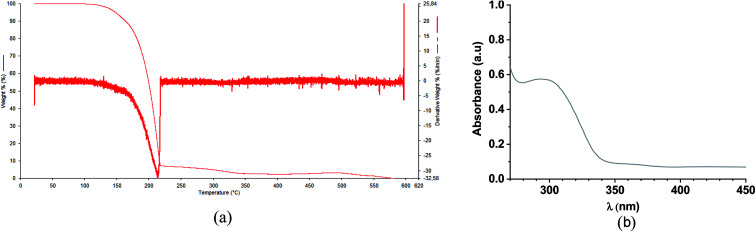
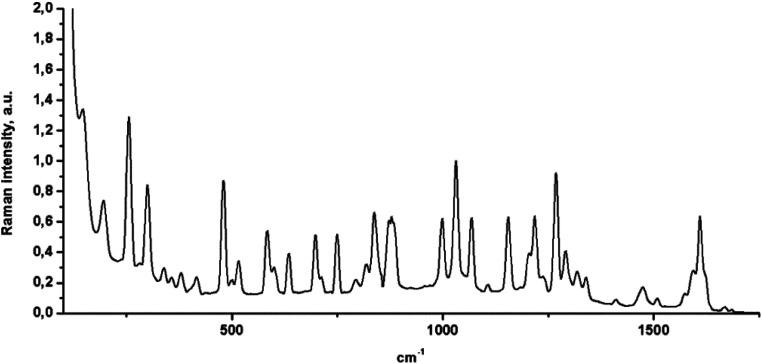
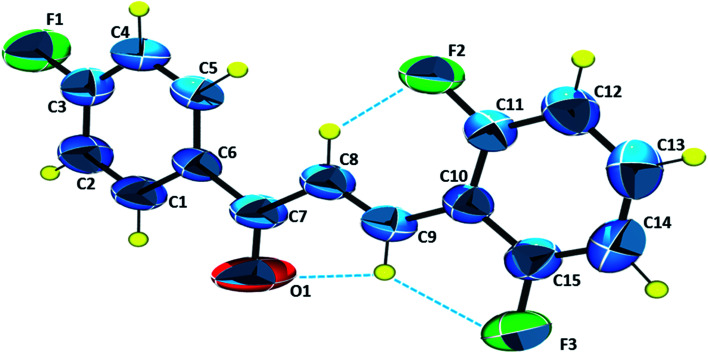
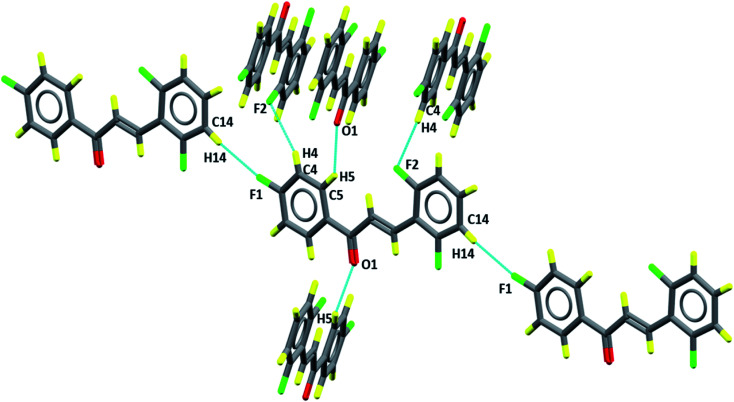
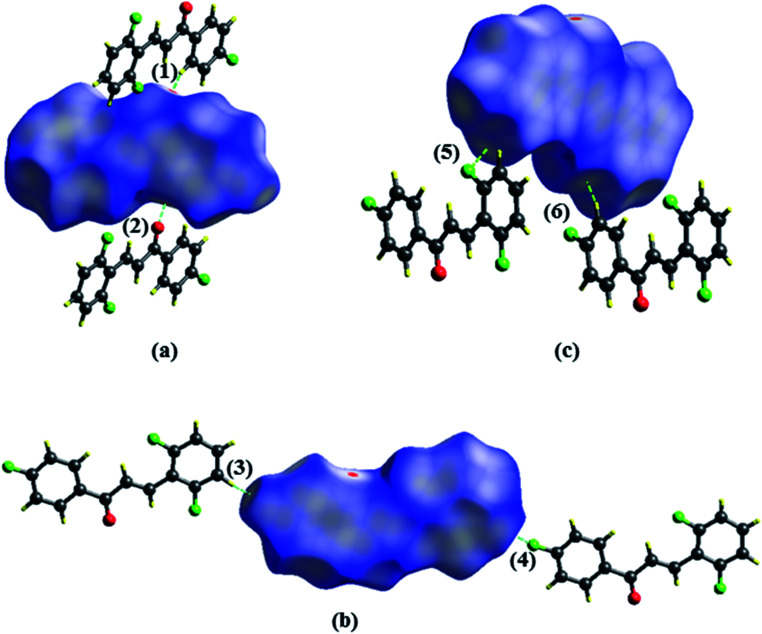
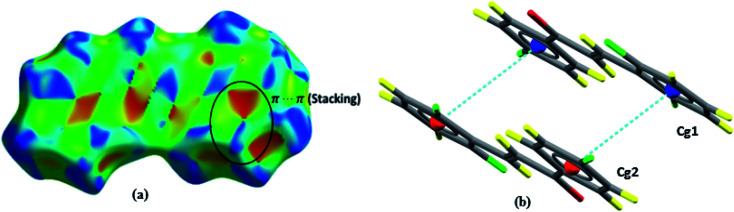
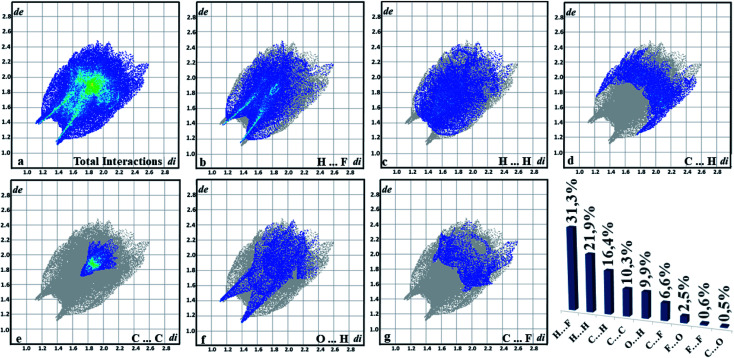
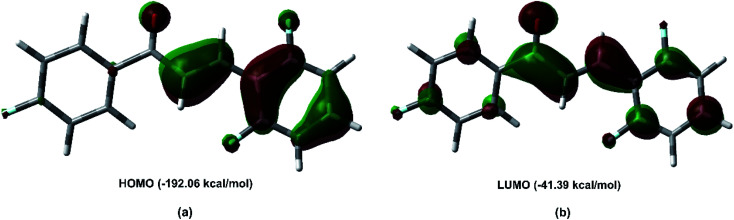
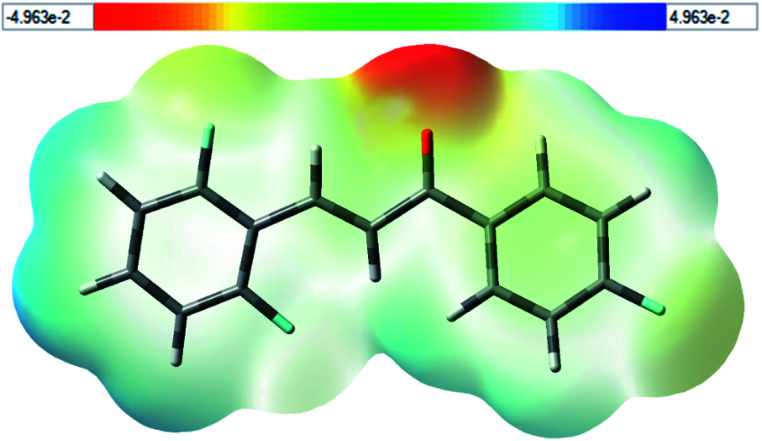
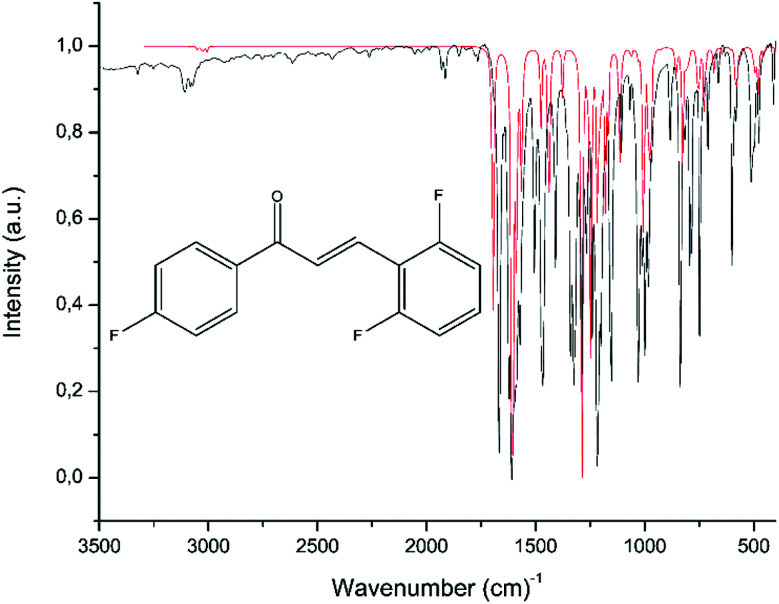
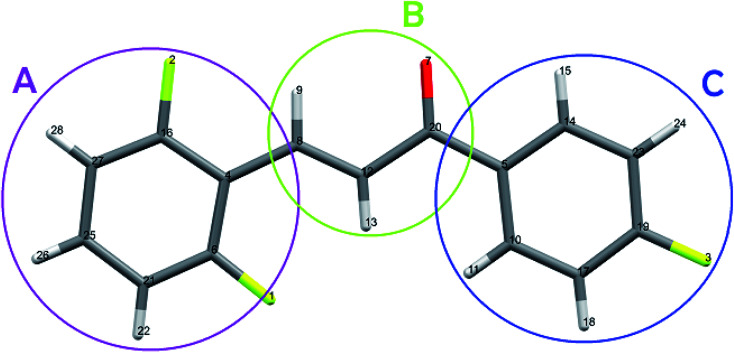
A new fluorinated chalcone (E)-3-(2,6-difluorophenyl)-1-(4-fluorophenyl)prop-2-en-1-one was synthesized in 90% yield and crystallized by a slow evaporation technique. Its full structural characterization and purity were determined by scanning electron microscopy, infrared spectroscopy, gas chromatography-mass spectrometry, 1H, 13C and 19F nuclear magnetic resonance, thermal gravimetric analysis (TGA), differential scanning calorimetry (DSC), Raman microspectroscopy, UV-Vis absorption spectroscopy, single crystal X-ray diffraction (XRD) and Hirshfeld surface (HS) analysis. The fluorinated chalcone crystallized in centrosymmetric space group P21/c stabilized by the C-H⋯O and C-H⋯F interactions and the π⋯π contact. The crystalline environment was simulated through the supermolecule approach where a bulk with 378 000 atoms was built. The electric parameters were calculated at the DFT/CAM-B3LYP/6-311++G(d,p) level as function of the electric field frequency. The macroscopic parameters such as linear refractive index and third-order nonlinear susceptibility (χ (3)) were calculated, and the results were compared with experimental data obtained from the literature. The χ (3)-value for the chalcone crystal is 369.294 × 10⁻²² m2 V-2, higher than those obtained from a few similar types of molecule, showing that the chalcone crystal can be considered as a nonlinear optical material. Also, molecular theoretical calculations such as infrared spectrum assignments, frontier molecular orbital analysis and MEP were implemented, revealing that the most positive region is around the hydrogen atoms of the aromatic rings, and electrophilic attack occurs on the carbonyl group.
This journal is © The Royal Society of Chemistry.
Conflict of interest statement
There are no conflicts to declare.
Figures
References
-
- Wu K. Pan S. Coord. Chem. Rev. 2018;377:191–208. doi: 10.1016/j.ccr.2018.09.002. - DOI
-
- Basu S. Ind. Eng. Chem. Prod. Res. Dev. 1984;23:183–186. doi: 10.1021/i300014a001. - DOI
-
- Raghavendra S. Anil Kumar K. V. Chandra Shekhara Shetty T. Dharmaprakash S. M. J. Mol. Struct. 2014;1074:653–659. doi: 10.1016/j.molstruc.2014.06.050. - DOI
-
- Zaini M. F. Arshad S. Thanigaimani K. Khalib N. C. Zainuri D. A. Abdullah M. Razak I. A. J. Mol. Struct. 2019;1195:606–619. doi: 10.1016/j.molstruc.2019.05.122. - DOI
-
- D'Silva E. D. Podagatlapalli G. K. Rao S. V. Rao D. N. Dharmaprakash S. M. Cryst. Growth Des. 2011;11:5362–5369. doi: 10.1021/cg2009539. - DOI
LinkOut - more resources
Full Text Sources
Research Materials
Miscellaneous