Review
. 2019 Jun 27;9(35):20118-20136.
doi: 10.1039/c9ra02907a. eCollection 2019 Jun 25.

Coated silver nanoparticles: synthesis, cytotoxicity, and optical properties

Affiliations
Review

Coated silver nanoparticles: synthesis, cytotoxicity, and optical properties

Heba Mohamed Fahmy et al. RSC Adv. .

Abstract

Coated silver nanoparticles (AgNPs) have recently become a topic of interest due to the fact that they have several applications such as in electronic, antimicrobial, industrial, optical, and medical fields as biosensors and drug delivery systems. However, the use of AgNPs in medical fields remains somewhat limited due to their probable cytotoxic effect. Researchers have succeeded in reducing the toxicity of silver particles by coating them with different substances. Generally, the coating of AgNPs leads to change in their properties depending on the type of the coating material as well as the layer thickness. This review covers the state-of-the-art technologies behind (a) the synthesis of coated AgNPs including coating methods and coating materials, (b) the cytotoxicity of coated AgNPs and (c) the optical properties of coated AgNPs.


Conflict of interest statement

The authors declare that there is no conflict of interest.

Figures

Fig. 1
Fig. 1. Schematic representation of different coating methods and coating substances of AgNPs. “SILAR: Successive Ionic Layer Adsorption and Reaction”.
Scheme 1
Scheme 1. Schematic representation of PEI-silane structure and two-step synthesis of a AgNP monolayer grafted on PEI SAM (adapted with permission from Royal Society of Chemistry, 2011).
Fig. 2
Fig. 2. (a and b) AFM topography images (500 × 500 nm) of SURF-PEI-NP-modified glass slides prepared at 15 min (a) and 18 h (b) dipping times. (c and d) UV-Vis spectra of the same slides ((c) 15 min, (d) 18 h dipping time) (adapted with permission from Royal Society of Chemistry, 2011).
Fig. 3
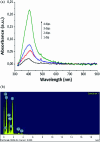
Fig. 3. (a) UV-Vis absorption spectra of the coating with different numbers of loading/reduction cycles; (b) EDX image of the coating with 4 dip/reduction cycles (PAA 20 mM) (adapted with permission from SpringerNature, 2011).
Fig. 4
Fig. 4. (a) UV-Vis extinction spectra and (b) the distinctive color of different-sized silver nanoparticles (adapted with permission from Royal Society of Chemistry, 2013).
Fig. 5
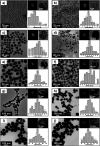
Fig. 5. FEG-TEM images of silver nanoparticles of various size ranges: (a) 5 ± 0.7 nm, (b) 7 ± 1.3 nm, (c) 10 ± 2.0 nm, (d) 15 ± 2.3 nm, (e) 20 ± 2.5 nm, (f) 30 ± 5.1 nm, (g) 50 ± 7.1, (h) 63 ± 7.6, (i) 85 ± 8.2 and (j) 100 ± 11.2. For each image, the corresponding high resolution (HRTEM) image and lattice fringes (d-spacing) are shown. The histograms show the range of particle size distribution (adapted with permission from Royal Society of Chemistry, 2013).
Fig. 6
Fig. 6. TEM images of partly sulfidized Ag-NPs. The right image is at higher magnification and is centered on one of the nanobridges observed at low magnification (left image) (adapted with permission from American Chemical Society, 2012).
Fig. 7
Fig. 7. The grafting process: previously aminated surfaces are immersed into a DEX solution containing AgNPs (DEX-Ag solution). The aldehydes present in DEX react with the amines to form imines, which are further reduced to amines with sodium cyanoborohydride. As the reaction proceeds, the AgNPs are entrapped in the DEX network, which is covalently attached to the surface (adapted with permission from Royal Society of Chemistry, 2011).
Fig. 8
Fig. 8. UV-Vis spectroscopy of silver embedded in dextran (DEX-Ag); concentrations of silver nitrate of 2 mM and 5 mM (A) (λ = 412 ± 2 nm) in solution and (B) (λ = 400 ± 5 nm) grafted on to the surface of DEX-Ag2 and DEX-Ag5, respectively. The peaks are related to the silver surface plasmon resonance. The sharp peak of DEX-Ag2 is related to the distribution of particles with narrow size; however, in the case of DEX-Ag5, a broader band appears. When compared to the solution, DEX containing AgNPs attached onto the surface results in a slight blue shift. The TEM micrograph shows spherical particles (scale bar, 20 nm) of AgNPs embedded in DEX-Ag2, where 4.8 ± 2.6 nm is the average diameter of the AgNPs (adapted with permission from Royal Society of Chemistry, 2011).
Fig. 9
Fig. 9. Top: AFM topography images of grafted DEX (DEX) and grafted DEX with trapped AgNPs prepared using concentrations of 2 mM (DEX-Ag2) and 5 mM (DEX-Ag5). The scan size is 2 × 2 μm2. The grafted dextran surface shows a uniform distribution of ∼50 nm features and 2 nm height across a relatively smooth surface. Individual AgNPs (∼5 nm) and clusters distributed across the film uniformly on the surfaces containing grafted dextran. In the case of DEX-Ag5, aggregates of irregular and larger shapes are observed. The z scales are 4 nm, 15 nm and 40 nm for DEX, DEX-Ag2 and DEX-Ag5 respectively. Bottom: a line scan across the white line of the corresponding upper image of topography (adapted with permission from Royal Society of Chemistry, 2011).
Fig. 10
Fig. 10. The different routes of coating via polymerization methods. “LBL; layer-by-layer”.
Scheme 2
Scheme 2. Two-level dual-functional antibacterial design of coating with silver and quaternary ammonium salts. The coating process begins with the LbL deposition of a reservoir made of bilayers of PAH and PAA. (A) A cap region made of bilayers of PAH and SiO2 NPs is added on the top. (B) The SiO2 NP cap is modified with a quaternary ammonium silane, OQAS. (C) Ag+ can be loaded inside the coating using the available unreacted carboxylic acid groups in the LbL multilayers. Ag NPs are created in situ using the nanoreactor chemistry described previously (adapted with permission from American Chemical Society, 2006).
Fig. 11
Fig. 11. Cross-sectional TEM images showing the two-level antibacterial coating with OQAS and silver. AgNPs resulting from two Ag loading and reduction cycles were embedded inside coatings by a wet-phase reduction method using a complex solution of dimethylamineborane (DMAB) (adapted with permission from American Chemical Society, 2006).
Fig. 12
Fig. 12. FE-SEM images of the (A) spherical, (B) oval, (C) rod and (D) flower-shaped silver nanoparticles at low and (E) high magnifications (adapted with permission from Royal Society of Chemistry, 2015).
Scheme 3
Scheme 3. Graphical representation of synthesis of shape-specific silver nanoparticles using the green synthesis approach (adapted with permission from Royal Society of Chemistry, 2015).
Fig. 13
Fig. 13. (A) Schematic illustration of the procedure for the preparation of mSiO2@NH2@Ag. (B) SEM image of mSiO2 microspheres. (C) SEM image of mSiO2@NH2@Ag. The insets show the low-magnification and high-magnification TEM images of mSiO2@NH2@Ag (adapted with permission from Royal Society of Chemistry, 2015).
Fig. 14
Fig. 14. XPS spectra of (a) mSiO2, (b) mSiO2@NH2 and (c) mSiO2@NH2@Ag; inset is the high resolution Ag 3d XPS spectra of mSiO2@NH2@Ag (adapted with permission from Royal Society of Chemistry, 2015).
Fig. 15
Fig. 15. Schematic representation of the mechanisms of action of the AgNP antimicrobial effect (adapted with permission from American Chemical Society, 2019).
Fig. 16
Fig. 16. Schematic representation of the active transport of nanoparticles into cells (adapted with permission from American Chemical Society, 2019).
Fig. 17
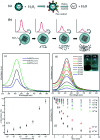
Fig. 17. Possible mechanism and schematic representation of (a) the reaction between PVA-coated AgNPs and H2O2 and (b) the decrease in the absorbance intensity with increasing H2O2 concentration. (c) Optical absorption characteristics of different concentrations of PVA-capped AgNPs. (d) LSPR optical absorbance spectra of AgNPs as a function of time after the addition of 10–3 M H2O2. (Inset: AgNP solution (i) before and (ii) after the addition of H2O2). (e) The correlation between the optical absorbance strength changes after 30 min with respect to different concentrations of H2O2 added to the PVA-AgNPs. (f) Relationship between the absorbance intensity and reaction time for different concentrations of H2O2 (adapted with permission from Royal Society of Chemistry, 2016).
None
Ayaat Mahmoud Mosleh
None
Aya Abd Elghany
None
Engy Shams-Eldin
None
Esraa Samy Abu Serea
None
Ahmed Esmail Shalan

References

    1. Dos Santos C. A. Seckler M. M. Ingle A. P. Gupta I. Galdiero S. Galdiero M. Gade A. Rai M. J. Pharm. Sci. 2014;103:1931–1944. doi: 10.1002/jps.24001. - DOI - PubMed
    1. Guerra F. D. Campbell M. L. Whitehead D. C. Alexis F. ChemistrySelect. 2017a;2:9889–9894.
    1. Guerra F. D. Smith G. D. Alexis F. Whitehead D. C. Aerosol Air Qual. Res. 2017b;17:209–217.
    1. Zhang S. Ren F. Wu W. Zhou J. Sun L. Xiao X. Jiang C. J. Colloid Interface Sci. 2014;427:29–34. doi: 10.1016/j.jcis.2013.12.012. - DOI - PubMed
    1. Alexander C. M. Goodisman J. J. Colloid Interface Sci. 2014;418:103–112. doi: 10.1016/j.jcis.2013.11.074. - DOI - PubMed