. 2022 Apr 20:13:884462.
doi: 10.3389/fimmu.2022.884462. eCollection 2022.

Serum Antigenome Profiling Reveals Diagnostic Models for Rheumatoid Arthritis

Affiliations

Serum Antigenome Profiling Reveals Diagnostic Models for Rheumatoid Arthritis

Peng Han et al. Front Immunol. .

Abstract

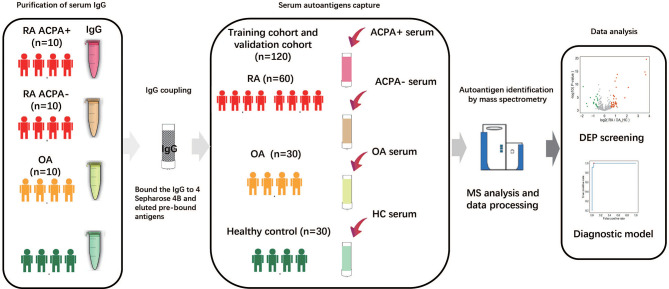
Objective: The study aimed to investigate the serum antigenomic profiling in rheumatoid arthritis (RA) and determine potential diagnostic biomarkers using label-free proteomic technology implemented with machine-learning algorithm.

Method: Serum antigens were captured from a cohort consisting of 60 RA patients (45 ACPA-positive RA patients and 15 ACPA-negative RA patients), together with sex- and age-matched 30 osteoarthritis (OA) patients and 30 healthy controls. Liquid chromatography-tandem mass spectrometry (LC-MS/MS) was then performed. The significantly upregulated and downregulated proteins with fold change > 1.5 (p < 0.05) were selected. Based on these differentially expressed proteins (DEPs), a machine learning model was trained and validated to classify RA, ACPA-positive RA, and ACPA-negative RA.

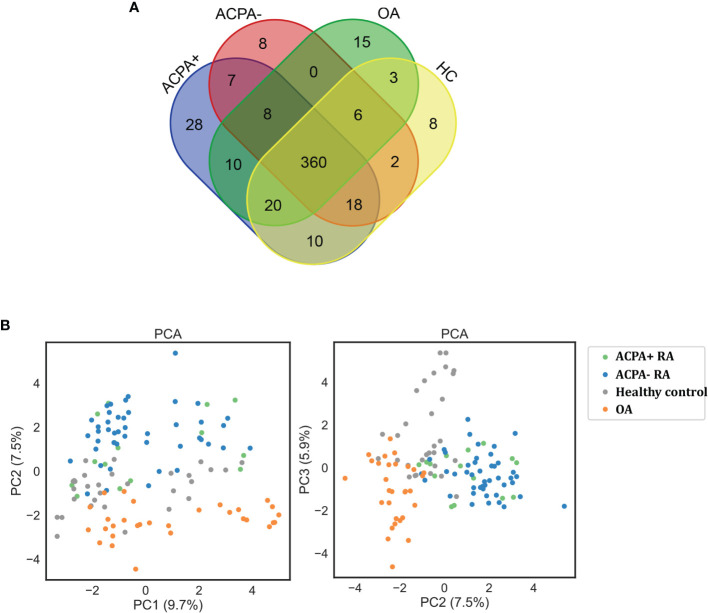
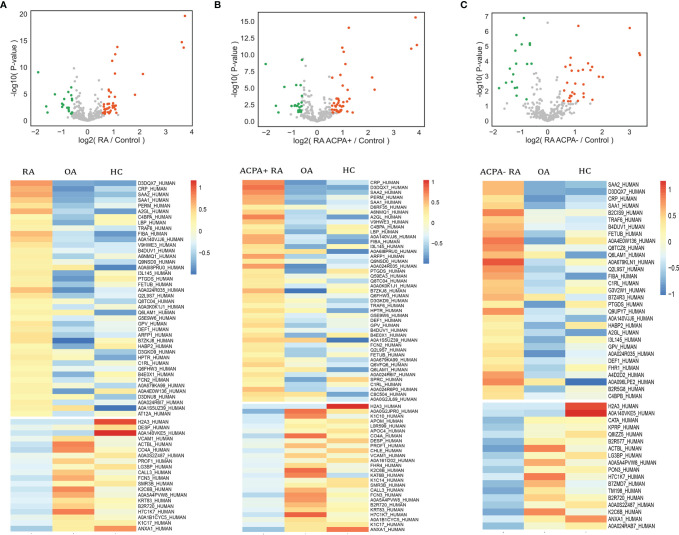
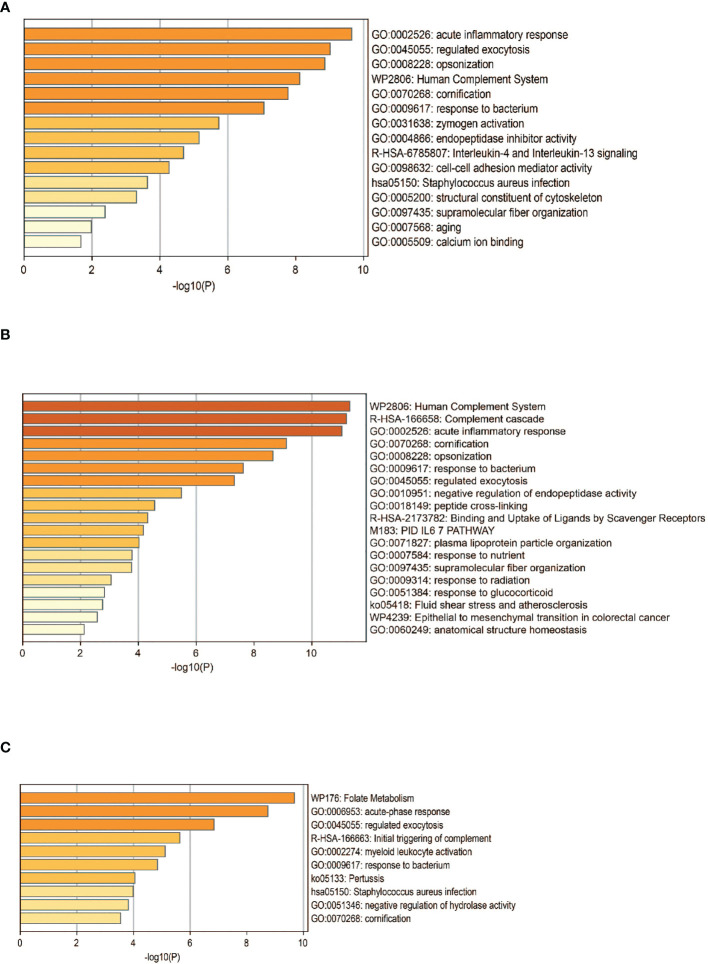
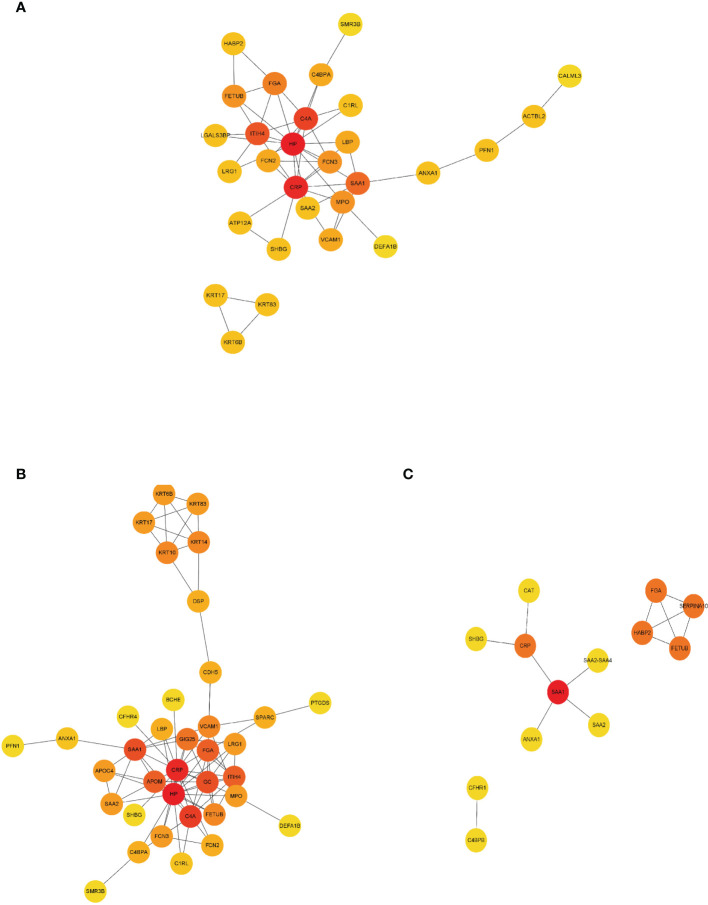
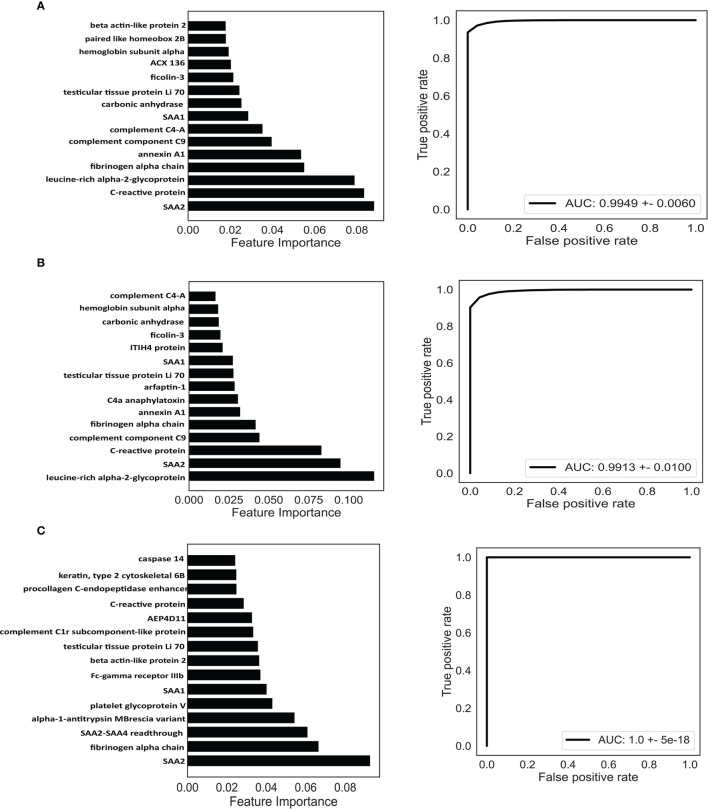
Results: We identified 62, 71, and 49 DEPs in RA, ACPA-positive RA, and ACPA-negative RA, respectively, as compared to OA and healthy controls. Typical pathway enrichment and protein-protein interaction networks were shown among these DEPs. Three panels were constructed to classify RA, ACPA-positive RA, and ACPA-negative RA using random forest models algorithm based on the molecular signature of DEPs, whose area under curve (AUC) were calculated as 0.9949 (95% CI = 0.9792-1), 0.9913 (95% CI = 0.9653-1), and 1.0 (95% CI = 1-1).

Conclusion: This study illustrated the serum auto-antigen profiling of RA. Among them, three panels of antigens were identified as diagnostic biomarkers to classify RA, ACPA-positive, and ACPA-negative RA patients.

Keywords: antigenome; biomarkers; mass spectrometry; random forest; rheumatoid arthritis.


Conflict of interest statement

The authors declare that the research was conducted in the absence of any commercial or financial relationships that could be construed as a potential conflict of interest.

Figures

Figure 1
Figure 1
Study overview and antigenome characterization. Overview of the study cohort and schematic workflow. RA, rheumatoid arthritis; OA, osteoarthritis; ACPA, anti-citrullinated protein antibody; HC, healthy control; MS, mass spectrometry; DEP, differentially expressed protein.
Figure 2
Figure 2
Protein quantification through LC-MS/MS. (A) Venn diagram of the identified proteins among RA patients and controls. (B) Clustering analysis of differentially expressed proteins on PCA analysis. ACPA+, ACPA-positive RA; ACPA-, ACPA-negative RA; PCA, principal component analysis.
Figure 3
Figure 3
Analysis of differential expressed proteins. Volcano plots compare RA (A), ACPA-positive RA (B), ACPA-negative RA (C), and controls. Heatmap analysis of proteins that differ significantly (p < 0.05, fold change > 1.5) in abundance in RA (A), ACPA-positive RA (B), and ACPA-negative RA (C).
Figure 4
Figure 4
Functional analysis of DEPS. Pathway analysis of DEPs in patients with RA (A), ACPA-positive RA (B), and ACPA-negative RA (C). GO, gene ontology.
Figure 5
Figure 5
PPI network construction of DEPs. Interaction network analysis of DEPs in RA (A), ACPA-positive RA (B), and ACPA-negative RA (C) by STRING and Cytoscape. Cytohubba plug-in was applied to identify the hub proteins in the network by protein degrees. Red indicated DEPs were at the center of the network and possessing 5–10 edges. Orange indicated DEPs possessing 3–5 edges. Yellow indicated DEPs possessing 1 to 2 edges. PPI, protein–protein interaction.
Figure 6
Figure 6
Identification of potential biomarkers based on machine learning. Classification of RA (A), ACPA-positive RA (B), and ACPA-negative RA (C). Top 15 proteins prioritized by random forest analysis (left). ROC of the random forest model in the test cohort (right). AUC, area under curve.

Similar articles

Cited by

References

    1. Smolen JS, Aletaha D, McInnes IB. Rheumatoid Arthritis. Lancet (London England) (2016) 388:2023–38. doi: 10.1016/S0140-6736(16)30173-8 - DOI - PubMed
    1. Tobón GJ, Youinou P, Saraux A. The Environment, Geo-Epidemiology, and Autoimmune Disease: Rheumatoid Arthritis. J Autoimmun (2010) 35:10–4. doi: 10.1016/j.jaut.2009.12.009 - DOI - PubMed
    1. Li R, Sun J, Ren LM, Wang HY, Liu WH, Zhang XW, et al. . Epidemiology of Eight Common Rheumatic Diseases in China: A Large-Scale Cross-Sectional Survey in Beijing. Rheumatol (Oxford England) (2012) 51:721–9. doi: 10.1093/rheumatology/ker370 - DOI - PubMed
    1. Scott DL, Steer S. The Course of Established Rheumatoid Arthritis. Best Pract Res Clin Rheumatol (2007) 21:943–67. doi: 10.1016/j.berh.2007.05.006 - DOI - PubMed
    1. Aletaha D, Smolen JS. Diagnosis and Management of Rheumatoid Arthritis: A Review. JAMA (2018) 320:1360–72. doi: 10.1001/jama.2018.13103 - DOI - PubMed

Publication types