. 2020 Jul 21;10(45):27137-27151.
doi: 10.1039/d0ra04788k. eCollection 2020 Jul 15.

Effect of C-terminus amidation of Aβ39-42 fragment derived peptides as potential inhibitors of Aβ aggregation

Affiliations

Effect of C-terminus amidation of Aβ39-42 fragment derived peptides as potential inhibitors of Aβ aggregation

Akshay Kapadia et al. RSC Adv. .

Abstract

The C-terminus fragment (Val-Val-Ile-Ala) of amyloid-β is reported to inhibit the aggregation of the parent peptide. In an attempt to investigate the effect of sequential amino-acid scan and C-terminus amidation on the biological profile of the lead sequence, a series of tetrapeptides were synthesized using MW-SPPS. Peptide D-Phe-Val-Ile-Ala-NH2 (12c) exhibited high protection against β-amyloid-mediated-neurotoxicity by inhibiting Aβ aggregation in the MTT cell viability and ThT-fluorescence assay. Circular dichroism studies illustrate the inability of Aβ42 to form β-sheet in the presence of 12c, further confirmed by the absence of Aβ42 fibrils in electron microscopy experiments. The peptide exhibits enhanced BBB permeation, no cytotoxicity along with prolonged proteolytic stability. In silico studies show that the peptide interacts with the key amino acids in Aβ, which potentiate its fibrillation, thereby arresting aggregation propensity. This structural class of designed scaffolds provides impetus towards the rational development of peptide-based-therapeutics for Alzheimer's disease (AD).


Conflict of interest statement

The authors declare no competing financial interest.

Figures

Scheme 1
Scheme 1. Synthesis of tetrapeptide 12c using MW-assisted Fmoc-solid phase peptide synthesis protocol employing Rink amide resin. Reaction conditions: (i) 20% piperidine in DMF (7 mL), MW (40 W), 60 °C, 2 cycles – 1.5 & 3 min; (ii) 2, 4, 6, 8 (4 equiv.), TBTU (4 equiv.), HoBt (4 equiv.), DIPEA (5 equiv.), DMF (3.5 mL), MW (40 W), 60 °C, 13.5 min; (iii) TFA : TIPS : H2O (95 : 2.5 : 2.5), rt, 2.5 h; reaction monitoring was done by: UV measurement: Fmoc deprotection-dibenzofulvene adduct, Kaiser test: 1° amines; acetaldehyde test: 2° amines.
Fig. 1
Fig. 1. Effect of most active test peptides on Aβ42 aggregation: bar plots depicting the decrease in % RFU of ThT dye when Aβ42 (2 μM) was co-incubated with test peptides at higher doses (A), and lower doses (B). Complete fluorescence was represented by the Aβ42 peptide incubated along with the dye (black) and dye control (grey) represents the dye incubated alone. Subsequent bars represent Aβ peptide co-incubated with the varying concentrations of inhibitor peptides for 24 h. Significance values indicated with respect to the Aβ peptides, *, p < 0.05; **, p < 0.01; ***, p < 0.001. (C) Dose dependent modulation of Aβ42 aggregation-induced-neurotoxicity in PC-12 cells exhibited by the test peptide 12c (black). (D) Concentration dependent % inhibition on Aβ42 aggregation mediated ThT fluorescence exhibited by the test peptide 12c (black). % inhibition of ThT fluorescence was calculated by using the formula: 100 × [100 − (Aβ42 + test peptide RFU485 − control RFU485/Aβ42 RFU485 − control RFU485)]. Readings (λex 440 nm, λem 485 nm) was recorded for triplicate samples from three individual experiments and the readings were averaged (<5% variation). Error bars represent mean ± SD (n = 3). Data were analyzed by one-way anova test.
Fig. 2
Fig. 2. Derived structure–activity-relationship of tetrapeptides.
Fig. 3
Fig. 3. Thioflavin-T fluorescence studies on Aβ species: % RFU exhibiting the effect of peptide 12c on aggregation of (A) Aβ40 (5 μM) and (B) Aβ40 & Aβ42 mixture (5 μM) mediated ThT fluorescence. Complete fluorescence was represented by Aβ40 and the 10 : 1 mixture of Aβ peptides incubated along with the dye (black) and dye incubated alone (grey). Subsequent bars represent the respective concentrations of inhibitor peptide 12c co-incubated with the corresponding Aβ peptides for 24 h. Readings (λex 440 nm, λem 485 nm) was recorded for triplicate samples from three individual experiments and the readings were averaged (<5% variation). Error bars represent mean ± SD (n = 3). Data were analyzed by one-way anova test. Significance values indicated with respect to the Aβ peptides, *, p < 0.05; **, p < 0.01; ***, p < 0.001.
Fig. 4
Fig. 4. Time dependent inhibition of Aβ42: (A) % deformation or disaggregation of preformed Aβ42 fibrils in presence of equimolar concentration of test peptide 12c as evaluated via ThT fluorescence assay. (B) Time and concentration dependent RFU comparison depicting the effect of individual tetrapeptide 12c on Aβ42 mediated-ThT fluorescence. % inhibition of ThT fluorescence was calculated by using the formula: 100 × [100 − (Aβ42 + test peptide RFU485 − control RFU485/Aβ42 RFU485 − control RFU485)]. Readings (λex 440 nm, λem 485 nm) was recorded for triplicate samples and the values were normalized to the ThT dye control and averaged (<5% variation). Data was interpreted from three individual experiments. Error bars represent mean ± SD (n = 3). Data were analyzed by one-way anova test.
Fig. 5
Fig. 5. Additional fluorescence studies: (A) effect of varying concentration of tetrapeptide 12c on inhibition of Aβ42 fibril formation (Set 1) and on pre-aggregated fibrils of Aβ (Set 2). Complete fluorescence was represented by the Aβ42 (2 μM) incubated alone, monomeric (Set 1) and pre-aggregated t = 24 h (Set 2) and in the presence of respective concentrations of the test peptide 12c after 24 h. ANS dye incubated alone was considered as control and % RFU units for individual samples were computed by normalizing to the ANS dye control (λex 480 nm, λem 535 nm). Subsequent bars represent the % RFU of the respective concentrations of the inhibitor peptide 12c co-incubated with the differential states of Aβ42 peptide (2 μM) for 24 h. (B) Fluorescence spectrum showing effect of test peptide on Aβ42 aggregation and its interaction with GUVs. Fluorescence of Aβ42 alone at 0 h (green), 24 h (black); along with test peptides 12c (blue) after 24 h in the presence of GUVs (λex 480 nm, λem 400–600 nm). ANS dye incubated alone was considered as control and relative FL. Intensities for individual samples were computed by normalizing to the ANS dye control. (C) Intrinsic tyrosine fluorescence of Aβ42 during fibrillation and inhibition by test peptide 12c (λex 260 nm, λem 280–410 nm). Fluorescence of 5 μM Aβ42 (t = 0 h, green), 5 μM Aβ42 incubated alone (t = 24 h, black), Aβ42 co-incubated along with 5 μM of the test peptides, 12c (t = 24 h, blue). Readings was recorded for triplicate samples from three individual experiments and were averaged (<5% variation). Error bars represent mean ± SD (n = 3). Data were analyzed by one-way anova test.
Fig. 6
Fig. 6. Secondary structure analysis using CD: CD spectrum showing the conformational changes on Aβ42 aggregation in the presence of active peptide 12c and inactive peptide 13a. Aβ42 (10 μM) at 0 h (black) and 24 h (blue), co-incubated individually with equimolar ratios inhibitor peptide 12c (green) and inactive peptide 13a (red) for 24 h.
Fig. 7
Fig. 7. HRMS Analysis: ESI-MS for Aβ42 (10 μM) incubated alone (A), in presence of equimolar ratios of test peptide 12c (B) for 24 h.
Fig. 8
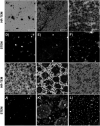
Fig. 8. Electron microscopy studies: HR-TEM and STEM images depicting the effects of active peptide 12c and inactive peptide 13a on the aggregation of Aβ42. Aβ42 (10 μM) was incubated alone t = 0 h (A and D), t = 24 h (B and E); with equimolar concentrations of inhibitor peptide 12c (C and F); inactive peptide 13a (H and K) as well as peptide 12c (G and J) and inactive peptide 13a (I and L) incubated alone, respectively. (Additional images have been provided in the ESI, Section 11.3).
Fig. 9
Fig. 9. Cytotoxicity and bioavailability study: (A) analysis of the cytotoxic effects of the peptide 12c (20 mM) on the viability of PC-12 cells evaluated using MTT cell viability assay. The percentage of untreated cells was considered 100% (positive control) and presence of the test peptides in respective dose concentration for 6 h. (B) BBB-permeability of peptide 12c in comparison to 11a, as determined by the PAMPA-BBB assay. Pe was calculated by using the formula VdVa/[(Vd + Va)St] ln(1 − Aa/Ae), where Vd and Va are the mean volumes of the donor and acceptor solutions, S is the surface area of the artificial membrane, t is the incubation time, and Aa and Ae are the UV absorbance of the acceptor well and the theoretical equilibrium absorbance, respectively. Data was recorded for triplicate samples in three individual experiments and the readings were averaged (<5% variation).
Fig. 10
Fig. 10. Proteolytic stability study: (A) superimposed HPLC chromatograms of most active peptide 12c at time intervals of 0, 2, 4, 8, 12, 18 and 24 h after trypsin treatment; (B) graphical representation showing % degradation for peptide 12c on serum treatment. (C) Mass spectra for peptide 12c at 0, 12, 18 and 24 h of serum treatment. Analyzed by ACD-Mass Fragmenter tool. (D) Predicted susceptible cleavage sites for peptide 12c. Most susceptible peptide bond has been indicated in bold red.
Fig. 11
Fig. 11. In silico study: ligand interaction diagram showing interactions of the ligand with the residues of monomeric unit 1IYT-10 (A and B) and with the proto-fibrillar unit 2NAO-06 (C and D). 3D representation (Left) showed along with 2D representation (Right).

Similar articles

Cited by

References

    1. Gaugler J. James B. Johnson T. Marin A. Weuve J. 2019 Alzheimer's disease facts and figures. Alzheimer's Dementia. 2019;15:321–387. doi: 10.1016/j.jalz.2019.01.010. - DOI
    1. Hardy J. Higgins G. Alzheimer's disease: the amyloid cascade hypothesis. Science. 1992;256:184–186. doi: 10.1126/science.1566067. - DOI - PubMed
    1. Alzheimer's Association, Alzheimer's Disease Facts and Figures, 2019, Please see: http://www.alz.org/facts/, accessed on 20.05.2020
    1. Cummings J. Tong G. Ballard C. Treatment combinations for Alzheimer's disease: Current and future pharmacotherapy options. J. Alzheimer's Dis. 2019;67:779–794. - PMC - PubMed
    1. Wong D. Rosenberg P. Zhou P. Kumar A. Raymont V. Ravert H. Dannals R. F. Nandi A. Brašić J. Ye W. Hilton J. In vivo imaging of amyloid deposition in Alzheimer disease using the radioligand 18F-AV-45 (flobetapir F-18) J. Nucl. Med. 2010;51:913–920. doi: 10.2967/jnumed.109.069088. - DOI - PMC - PubMed