Giant magnetoelectric coupling observed at high frequency in NiFe2O4-BaTiO3 particulate composite
- PMID: 35515802
- PMCID: PMC9055467
- DOI: 10.1039/d0ra05782g
Giant magnetoelectric coupling observed at high frequency in NiFe2O4-BaTiO3 particulate composite
Erratum in
-
Correction: Giant magnetoelectric coupling observed at high frequency in NiFe2O4-BaTiO3 particulate composite.RSC Adv. 2022 Oct 10;12(44):28692. doi: 10.1039/d2ra90101c. eCollection 2022 Oct 4. RSC Adv. 2022. PMID: 36320530 Free PMC article.
Abstract
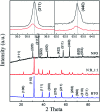
A giant magnetoelectric voltage coupling coefficient without direct current magnetic field observed in NiFe2O4-BaTiO3 particulate composite is reported. The particulate composite was obtained by combining hydrothermal and sol-gel method, and was studied for their crystallographic structure, morphology, magnetic, dielectric and magnetoelectric properties. Results of Mössbauer spectra demonstrated the presence of interface phase in particulate composite, where the changes of the magnetic properties in composite compared to the pure NiFe2O4 also confirmed this. The particulate composite exhibits remarkable magnetoelectric effect through both static measurement and dynamic measurement. The special magnetoelectric property of the particulate composite is beneficial for applications in high frequency devices.
This journal is © The Royal Society of Chemistry.
Conflict of interest statement
There are no conflicts to declare.
Figures


Similar articles
-
Hydrothermal synthesis and properties of NiFe2O4@BaTiO3 composites with well-matched interface.Sci Technol Adv Mater. 2012 Jul 16;13(4):045001. doi: 10.1088/1468-6996/13/4/045001. eCollection 2012 Aug. Sci Technol Adv Mater. 2012. PMID: 27877501 Free PMC article.
-
Correction: Giant magnetoelectric coupling observed at high frequency in NiFe2O4-BaTiO3 particulate composite.RSC Adv. 2022 Oct 10;12(44):28692. doi: 10.1039/d2ra90101c. eCollection 2022 Oct 4. RSC Adv. 2022. PMID: 36320530 Free PMC article.
-
Enhanced Magnetoelectric Coupling in BaTiO3-BiFeO3 Multilayers-An Interface Effect.Materials (Basel). 2020 Jan 2;13(1):197. doi: 10.3390/ma13010197. Materials (Basel). 2020. PMID: 31906580 Free PMC article.
-
Magnetoelectric Composites: Applications, Coupling Mechanisms, and Future Directions.Nanomaterials (Basel). 2020 Oct 20;10(10):2072. doi: 10.3390/nano10102072. Nanomaterials (Basel). 2020. PMID: 33092147 Free PMC article. Review.
-
Predicting Magnetoelectric Coupling in Layered and Graded Composites.Sensors (Basel). 2017 Jul 19;17(7):1651. doi: 10.3390/s17071651. Sensors (Basel). 2017. PMID: 28753956 Free PMC article. Review.
References
-
- Nan C. W. Bichurin M. I. Dong S. Viehland D. Srinivasan G. J. Appl. Phys. 2008;103(3):031101. doi: 10.1063/1.2836410. - DOI
LinkOut - more resources
Full Text Sources

