

Solving the enigma of weak fluorine contacts in the solid state: a periodic DFT study of fluorinated organic crystals
- PMID: 35515880
- PMCID: PMC9063672
- DOI: 10.1039/c9ra02116g
Solving the enigma of weak fluorine contacts in the solid state: a periodic DFT study of fluorinated organic crystals
Abstract
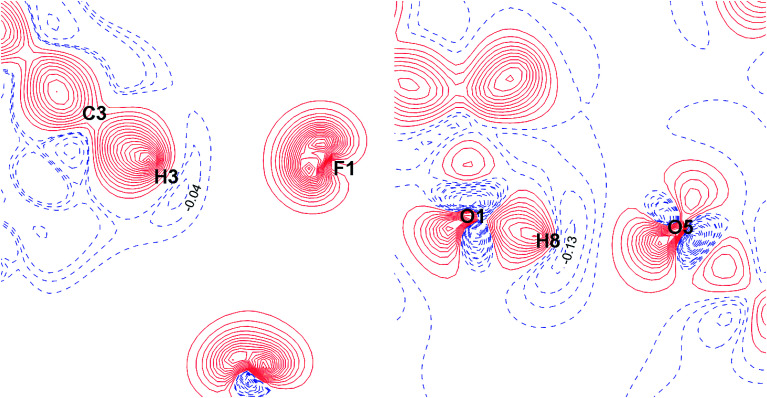
The nature and strength of weak interactions with organic fluorine in the solid state are revealed by periodic density functional theory (periodic DFT) calculations coupled with experimental data on the structure and sublimation thermodynamics of crystalline organofluorine compounds. To minimize other intermolecular interactions, several sets of crystals of perfluorinated and partially fluorinated organic molecules are considered. This allows us to establish the theoretical levels providing an adequate description of the metric and electron-density parameters of the C-F⋯F-C interactions and the sublimation enthalpy of crystalline perfluorinated compounds. A detailed comparison of the C-F⋯F-C and C-H⋯F-C interactions is performed using the relaxed molecular geometry in the studied crystals. The change in the crystalline packing of aromatic compounds during their partial fluorination points to the structure-directing role of C-H⋯F-C interactions due to the dominant electrostatic contribution to these contacts. C-H⋯F-C and C-H⋯O interactions are found to be identical in nature and comparable in energy. The factors that determine the contribution of these interactions to the crystal packing are revealed. The reliability of the results is confirmed by considering the superposition of the electrostatic potential and electron density gradient fields in the area of the investigated intermolecular interactions.
This journal is © The Royal Society of Chemistry.
Conflict of interest statement
There are no conflicts to declare.
Figures


Similar articles
-
Interplay of π-stacking and inter-stacking interactions in two-component crystals of neutral closed-shell aromatic compounds: periodic DFT study.RSC Adv. 2020 Jul 27;10(47):27899-27910. doi: 10.1039/d0ra04799f. eCollection 2020 Jul 27. RSC Adv. 2020. PMID: 35519116 Free PMC article.
-
How do halogen bonds (S-O⋯I, N-O⋯I and C-O⋯I) and halogen-halogen contacts (C-I⋯I-C, C-F⋯F-C) subsist in crystal structures? A quantum chemical insight.J Mol Model. 2017 Jan;23(1):16. doi: 10.1007/s00894-016-3181-z. Epub 2016 Dec 29. J Mol Model. 2017. PMID: 28035643
-
A combined crystallographic and theoretical investigation of noncovalent interactions in 1,3,4-oxadiazole-2-thione-N-Mannich derivatives: in vitro bioactivity and molecular docking.RSC Adv. 2023 Nov 21;13(48):34064-34077. doi: 10.1039/d3ra07169c. eCollection 2023 Nov 16. RSC Adv. 2023. PMID: 38019986 Free PMC article.
-
Tailoring the cavities of hydrogen-bonded amphidynamic crystals using weak contacts: towards faster molecular machines.Chem Sci. 2020 Dec 14;12(6):2181-2188. doi: 10.1039/d0sc05899h. Chem Sci. 2020. PMID: 34163983 Free PMC article.
-
Origami with small molecules: exploiting the C-F bond as a conformational tool.Beilstein J Org Chem. 2025 Apr 2;21:680-716. doi: 10.3762/bjoc.21.54. eCollection 2025. Beilstein J Org Chem. 2025. PMID: 40196389 Free PMC article. Review.
Cited by
-
High-Mobility Naphthalene Diimide Derivatives Revealed by Raman-Based In Silico Screening.Int J Mol Sci. 2022 Nov 1;23(21):13305. doi: 10.3390/ijms232113305. Int J Mol Sci. 2022. PMID: 36362092 Free PMC article.
-
Interplay of π-stacking and inter-stacking interactions in two-component crystals of neutral closed-shell aromatic compounds: periodic DFT study.RSC Adv. 2020 Jul 27;10(47):27899-27910. doi: 10.1039/d0ra04799f. eCollection 2020 Jul 27. RSC Adv. 2020. PMID: 35519116 Free PMC article.
-
Fast Quantum Approach for Evaluating the Energy of Non-Covalent Interactions in Molecular Crystals: The Case Study of Intermolecular H-Bonds in Crystalline Peroxosolvates.Molecules. 2022 Jun 24;27(13):4082. doi: 10.3390/molecules27134082. Molecules. 2022. PMID: 35807323 Free PMC article.
-
Crystal structure of 2,3-dimeth-oxy-meso-tetra-kis(penta-fluoro-phen-yl)morpholino-chlorin methyl-ene chloride 0.44-solvate.Acta Crystallogr E Crystallogr Commun. 2020 Jul 7;76(Pt 8):1222-1228. doi: 10.1107/S2056989020009093. eCollection 2020 Aug 1. Acta Crystallogr E Crystallogr Commun. 2020. PMID: 32844003 Free PMC article.
-
Impact of N-substitution on structural, electronic, optical, and vibrational properties of a thiophene-phenylene co-oligomer.RSC Adv. 2020 Jul 27;10(47):28128-28138. doi: 10.1039/d0ra03343j. eCollection 2020 Jul 27. RSC Adv. 2020. PMID: 35519088 Free PMC article.
References
-
- Meyer F. Dubois P. Halogen bonding at work: recent applications in synthetic chemistry and materials science. CrystEngComm. 2013;15:3058–3071. doi: 10.1039/C2CE26150B. - DOI
LinkOut - more resources
Full Text Sources
Research Materials
Miscellaneous