

Estimating surge in COVID-19 cases, hospital resources and PPE demand with the interactive and locally-informed COVID-19 Health System Capacity Planning Tool
- PMID: 35516164
- PMCID: PMC9052960
- DOI: 10.23889/ijpds.v5i4.1710
Estimating surge in COVID-19 cases, hospital resources and PPE demand with the interactive and locally-informed COVID-19 Health System Capacity Planning Tool
Abstract
Introduction: The COVID-19 pandemic revealed an urgent need for analytic tools to help health system leaders plan for surges in hospital capacity. Our objective was to develop a practical and locally informed Tool to help explore the effects of public health interventions on SARS-CoV-2 transmission and create scenarios to project potential surges in hospital admissions and resource demand.
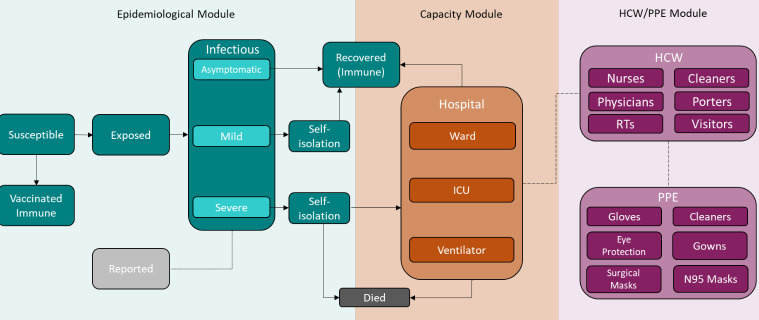
Methods: Our Excel-based Tool uses a modified S(usceptible)-E(xposed)-I(nfected)-R(emoved) model with vaccination to simulate the potential spread of COVID-19 cases in the community and subsequent demand for hospitalizations, intensive care unit beds, ventilators, health care workers, and personal protective equipment. With over 40+ customizable parameters, planners can adapt the Tool to their jurisdiction and changes in the pandemic.
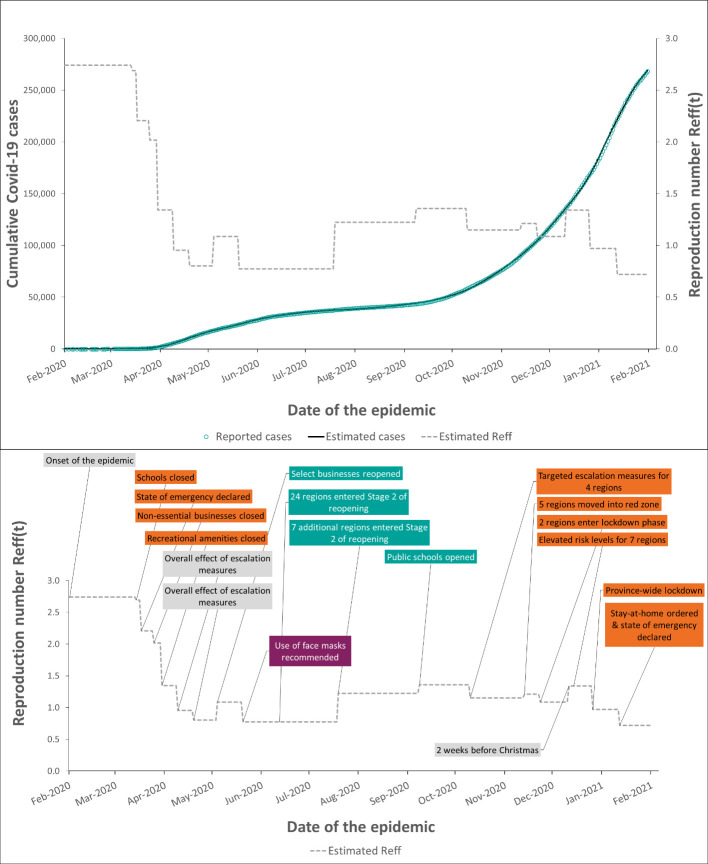
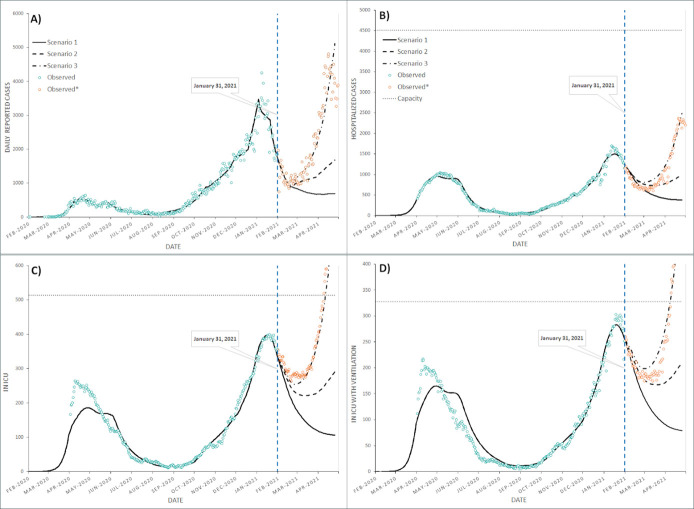
Results: We showcase the Tool using data for Ontario, Canada. Using healthcare utilization data to fit hospitalizations and ICU cases, we illustrate how public health interventions influenced the COVID-19 reproduction number and case counts. We also demonstrate the Tool's ability to project a potential epidemic trajectory and subsequent demand for hospital resources. Using local data, we built three planning scenarios for Ontario for a 3-month period. Our worst-case scenario accurately projected the surge in critical care demand that overwhelmed hospital capacity in Ontario during Spring 2021.
Conclusions: Our Tool can help different levels of health authorities plan their response to the pandemic. The main differentiators between this Tool and other existing tools include its ease of use, ability to build scenarios, and that it provides immediate outcomes that are ready to share with executive decision makers. The Tool is used by provincial health ministries, public health departments, and hospitals to make operational decisions and communicate possible scenarios to the public. The Tool provides educational value for the healthcare community and can be adapted for existing and emerging diseases.
Keywords: COVID-19; PPE demand; epidemiology; health policy; health system capacity; hospital bed demand; infectious diseases; interactive tool; predictive modeling; public health; statistics and research methods.
Conflict of interest statement
Competing interests: None to be declared.
Figures
Similar articles
-
Locally Informed Simulation to Predict Hospital Capacity Needs During the COVID-19 Pandemic.Ann Intern Med. 2020 Jul 7;173(1):21-28. doi: 10.7326/M20-1260. Epub 2020 Apr 7. Ann Intern Med. 2020. PMID: 32259197 Free PMC article.
-
A dynamic modeling tool for estimating healthcare demand from the COVID19 epidemic and evaluating population-wide interventions.Int J Infect Dis. 2020 Jul;96:376-383. doi: 10.1016/j.ijid.2020.05.043. Epub 2020 May 16. Int J Infect Dis. 2020. PMID: 32425631 Free PMC article.
-
Estimation of COVID-19-induced depletion of hospital resources in Ontario, Canada.CMAJ. 2020 Jun 15;192(24):E640-E646. doi: 10.1503/cmaj.200715. Epub 2020 May 14. CMAJ. 2020. PMID: 32409519 Free PMC article.
-
[Provisioning of personal protective equipment in hospitals in preparation for a pandemic].Anaesthesist. 2020 Dec;69(12):909-918. doi: 10.1007/s00101-020-00843-1. Anaesthesist. 2020. PMID: 32936348 Free PMC article. Review. German.
-
Caring for COVID-19 patients through a pandemic in the intensive care setting: A narrative review.WIREs Mech Dis. 2022 Nov;14(6):e1577. doi: 10.1002/wsbm.1577. Epub 2022 Jul 14. WIREs Mech Dis. 2022. PMID: 35835688 Free PMC article. Review.
Cited by
-
Use of Performance Data by Mid-Level Hospital Managers in Ontario: Results of a Province-Wide Survey and a Comparison with Hospital Managers in Europe.Healthc Policy. 2022 Oct;18(2):44-60. doi: 10.12927/hcpol.2022.26971. Healthc Policy. 2022. PMID: 36495534 Free PMC article.
References
Publication types
LinkOut - more resources
Full Text Sources
Miscellaneous