

Robust and cost-effective silver dendritic nanostructures for SERS-based trace detection of RDX and ammonium nitrate
- PMID: 35516256
- PMCID: PMC9058624
- DOI: 10.1039/d0ra08834j
Robust and cost-effective silver dendritic nanostructures for SERS-based trace detection of RDX and ammonium nitrate
Abstract
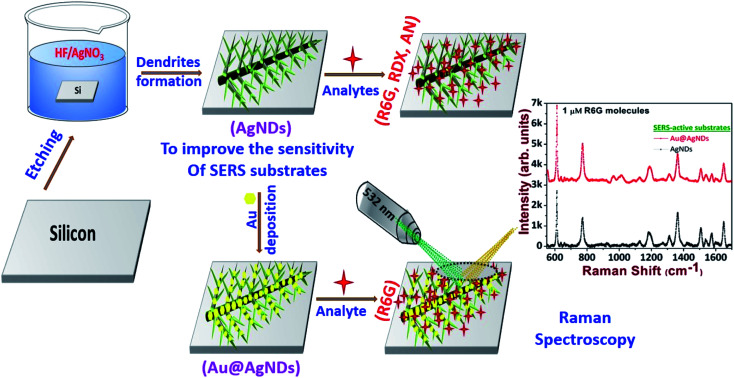
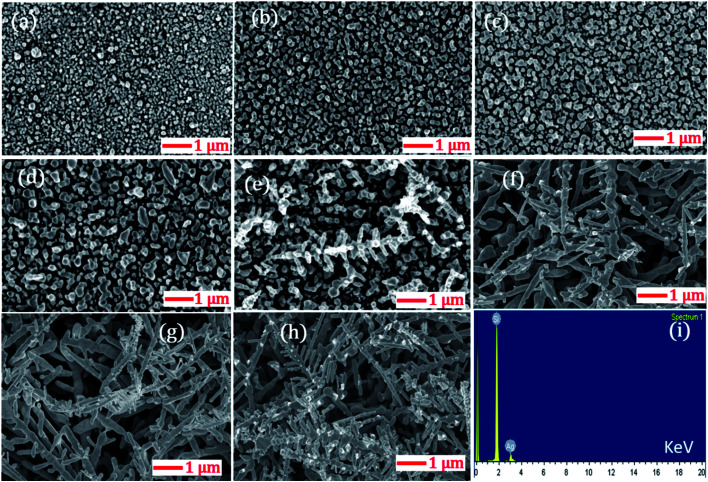
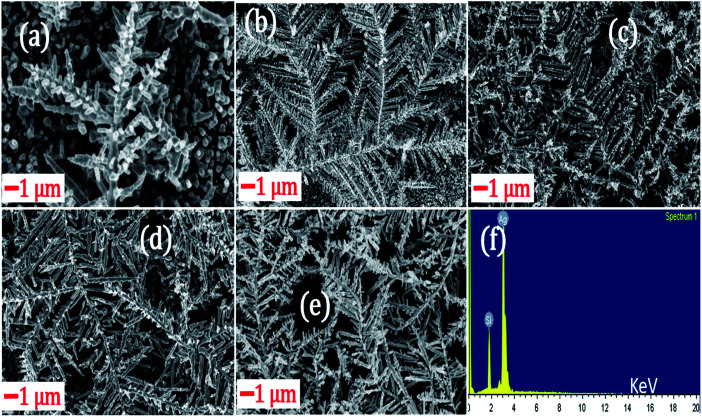
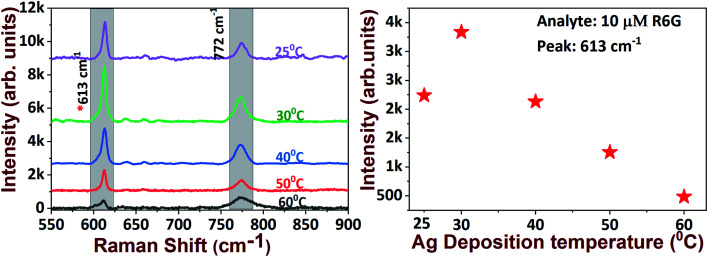
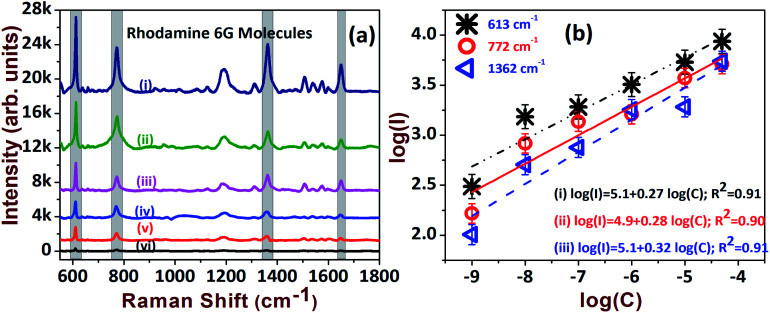
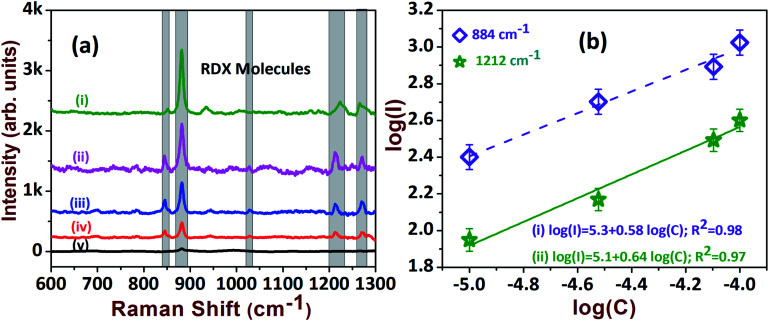
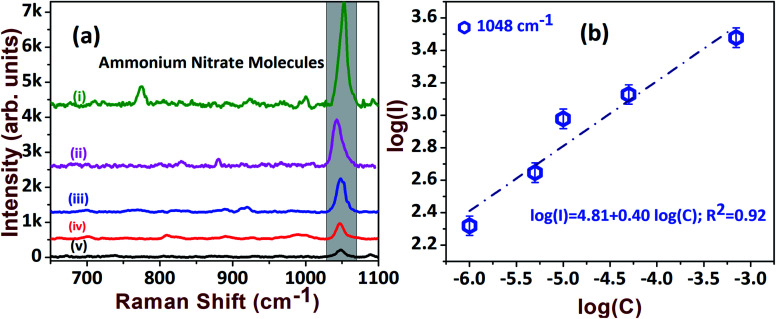
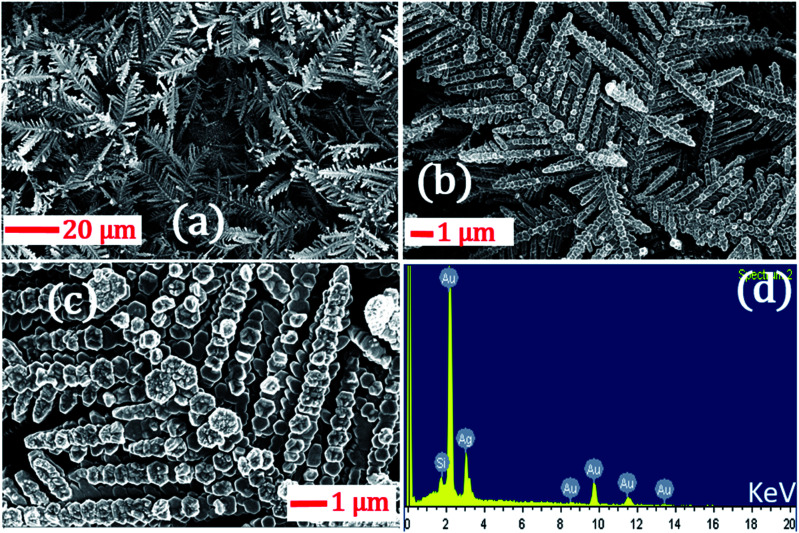
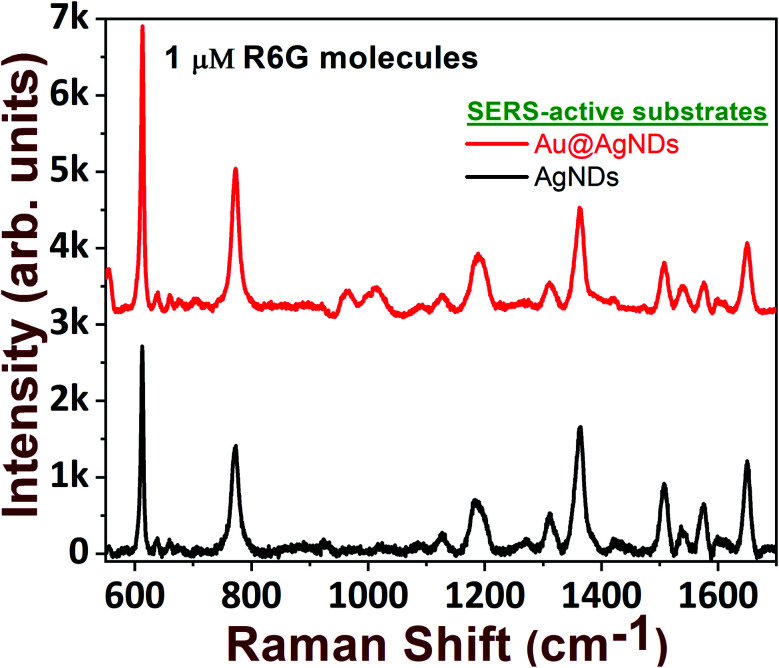
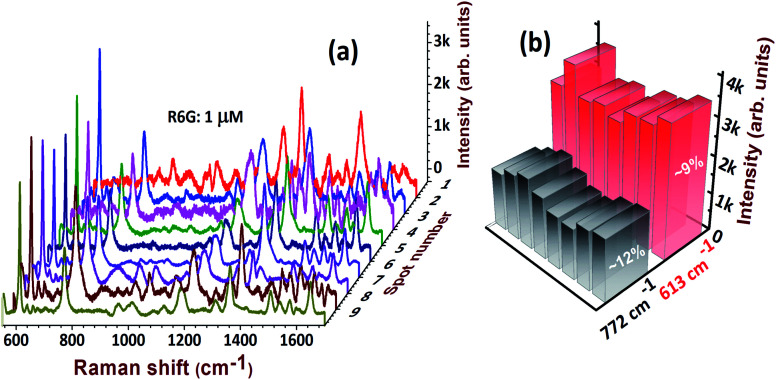
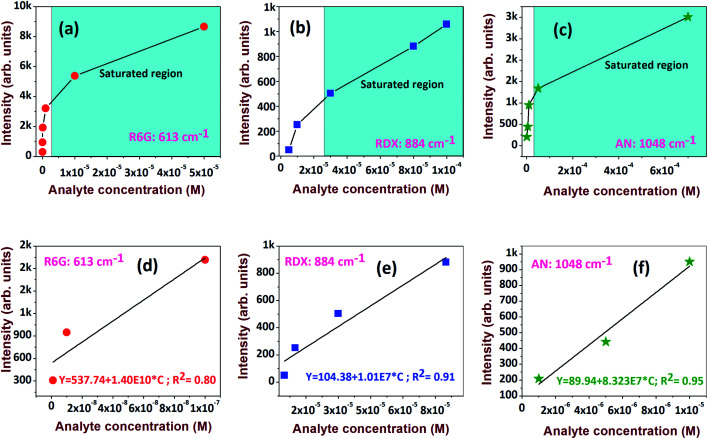
We report the fabrication and performance evaluation of cost-effective, reproducible silver nanodendrite (AgND) substrates, possessing high-density trunks and branches, achieved by a simple electroless etching process and subsequently utilized them for the trace detection of 1,3,5-trinitroperhydro-1,3,5-triazine (Research Development Explosive, RDX) and Ammonium Nitrate (AN). The intricate structural features in AgNDs offer high-density hotspots for effective molecular detection based on the surface enhanced Raman scattering (SERS) technique. The active SERS-substrate was initially tested with standard Rhodamine 6G (R6G) molecules at 1 nM concentration, which established an effective enhancement factor (EF) of ∼108. The AgNDs were subsequently utilized in the detection of the explosives RDX and AN, down to concentrations of 1 μM. The typical EF achieved in the case of RDX and AN was ∼104. The sensitivity of 1 μM R6G was further enhanced by two-fold through the deposition of Au nanoparticles on the AgNDs. The reproducibility of the low-cost substrate was also demonstrated, with a ∼9% RSD value in the measurements.
This journal is © The Royal Society of Chemistry.
Conflict of interest statement
There are no conflicts to declare.
Figures
Similar articles
-
Sensitive and specific detection of explosives in solution and vapour by surface-enhanced Raman spectroscopy on silver nanocubes.Nanoscale. 2017 Nov 2;9(42):16459-16466. doi: 10.1039/c7nr05057g. Nanoscale. 2017. PMID: 29063930
-
Instantaneous trace detection of nitro-explosives and mixtures with nanotextured silicon decorated with Ag-Au alloy nanoparticles using the SERS technique.Anal Chim Acta. 2020 Mar 8;1101:157-168. doi: 10.1016/j.aca.2019.12.026. Epub 2019 Dec 16. Anal Chim Acta. 2020. PMID: 32029107
-
Picosecond Laser-Ablated Nanoparticles Loaded Filter Paper for SERS-Based Trace Detection of Thiram, 1,3,5-Trinitroperhydro-1,3,5-triazine (RDX), and Nile Blue.Nanomaterials (Basel). 2022 Jun 22;12(13):2150. doi: 10.3390/nano12132150. Nanomaterials (Basel). 2022. PMID: 35807985 Free PMC article.
-
Anisotropically Shaped Plasmonic WO3-x Nanostructure-Driven Ultrasensitive SERS Detection and Machine Learning-Based Differentiation of Nitro-Explosives.ACS Appl Mater Interfaces. 2025 Feb 19;17(7):11309-11324. doi: 10.1021/acsami.4c19673. Epub 2025 Feb 10. ACS Appl Mater Interfaces. 2025. PMID: 39927890
-
Hybrid Surface-Enhanced Raman Scattering Substrates for the Trace Detection of Ammonium Nitrate, Thiram, and Nile Blue.ACS Omega. 2022 Apr 28;7(18):15969-15981. doi: 10.1021/acsomega.2c01095. eCollection 2022 May 10. ACS Omega. 2022. PMID: 35571848 Free PMC article.
Cited by
-
Surface-Enhanced Raman Spectroscopy of Ammonium Nitrate Using Al Structures, Fabricated by Laser Processing of AlN Ceramic.Materials (Basel). 2024 May 10;17(10):2254. doi: 10.3390/ma17102254. Materials (Basel). 2024. PMID: 38793320 Free PMC article.
-
Polyacrylonitrile as a versatile matrix for gold nanoparticle-based SERS substrates.Nanoscale Adv. 2024 Jan 18;6(4):1065-1073. doi: 10.1039/d3na01112g. eCollection 2024 Feb 13. Nanoscale Adv. 2024. PMID: 38356638 Free PMC article.
-
Plasmonic nanoparticle sensors: current progress, challenges, and future prospects.Nanoscale Horiz. 2024 Nov 19;9(12):2085-2166. doi: 10.1039/d4nh00226a. Nanoscale Horiz. 2024. PMID: 39240539 Free PMC article. Review.
-
Flexible paper-based Ag dendritic SERS chips for rapid in situ detection of thiram residues on pear skin.RSC Adv. 2024 Nov 20;14(50):36960-36969. doi: 10.1039/d4ra07061e. eCollection 2024 Nov 19. RSC Adv. 2024. PMID: 39569133 Free PMC article.
-
Heat Transfer Enhancement in Tree-Structured Polymer Linked Gold Nanoparticle Networks.J Phys Chem Lett. 2023 Nov 9;14(44):9834-9841. doi: 10.1021/acs.jpclett.3c02367. Epub 2023 Oct 27. J Phys Chem Lett. 2023. PMID: 37890034 Free PMC article.
References
LinkOut - more resources
Full Text Sources
Miscellaneous