

Ginsenoside Rb1 Improves Metabolic Disorder in High-Fat Diet-Induced Obese Mice Associated With Modulation of Gut Microbiota
- PMID: 35516426
- PMCID: PMC9062662
- DOI: 10.3389/fmicb.2022.826487
Ginsenoside Rb1 Improves Metabolic Disorder in High-Fat Diet-Induced Obese Mice Associated With Modulation of Gut Microbiota
Abstract
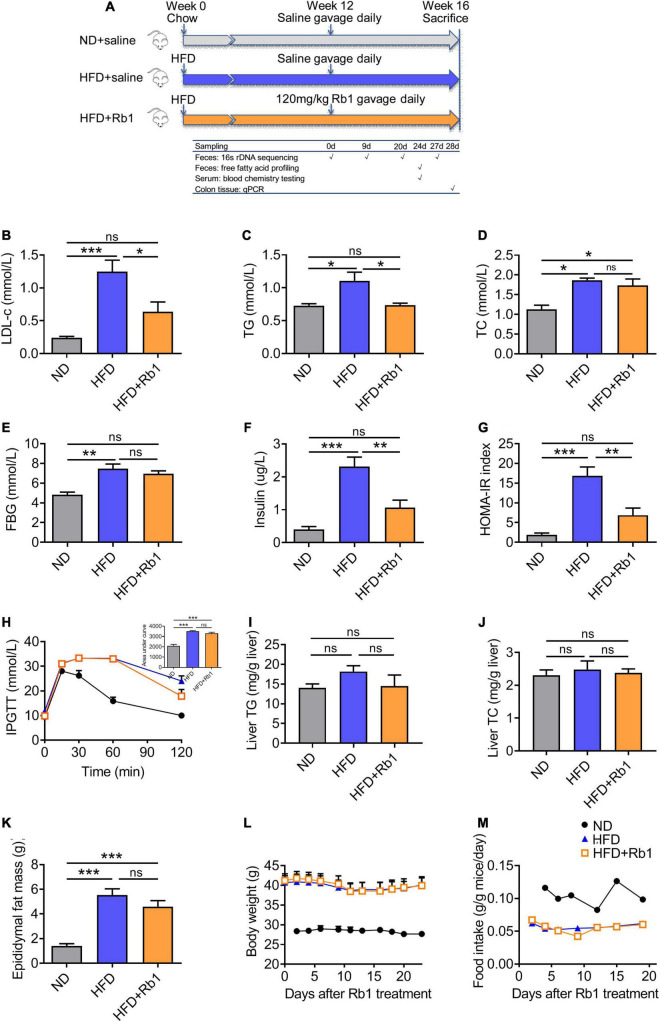
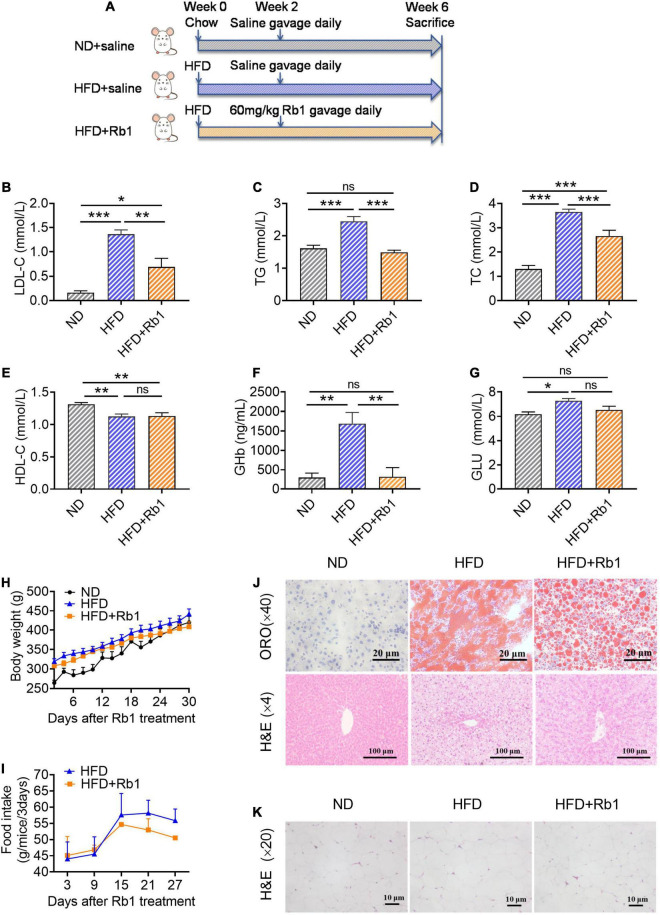
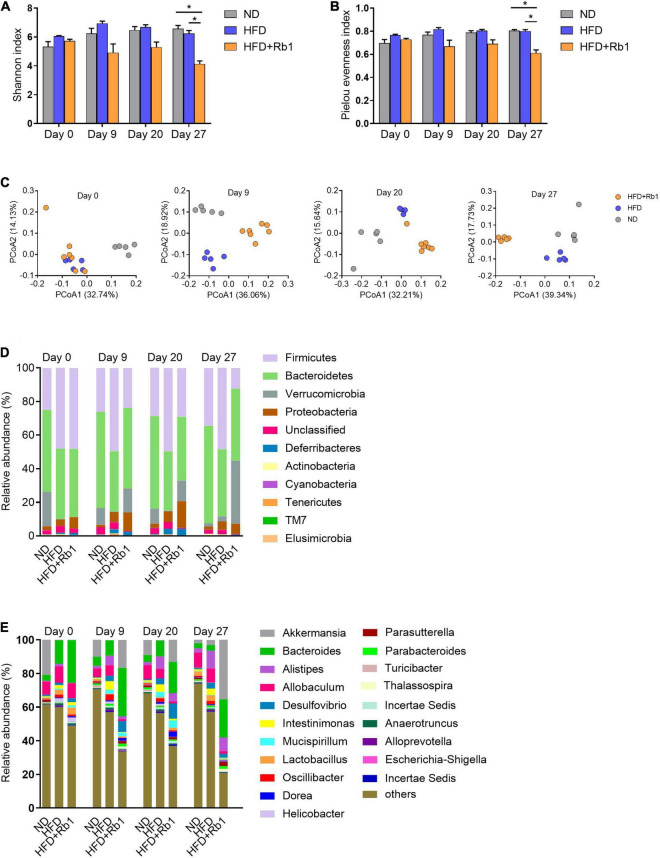
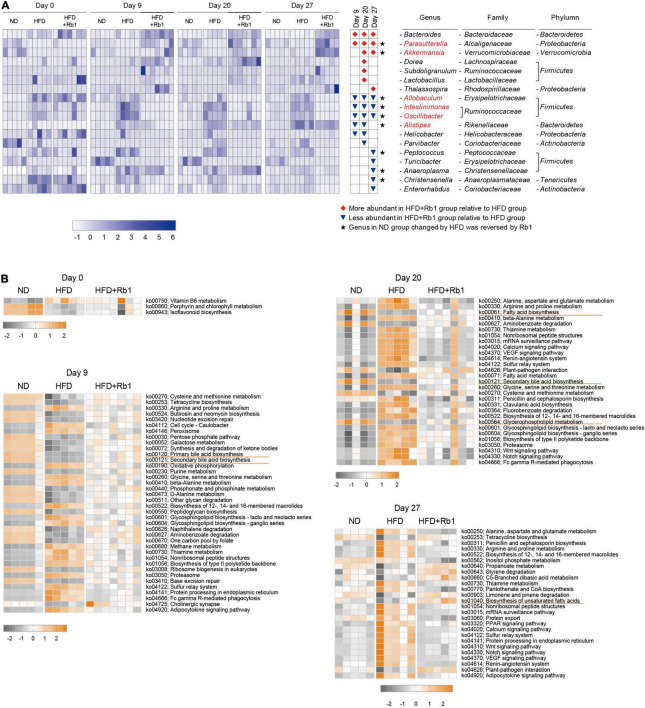
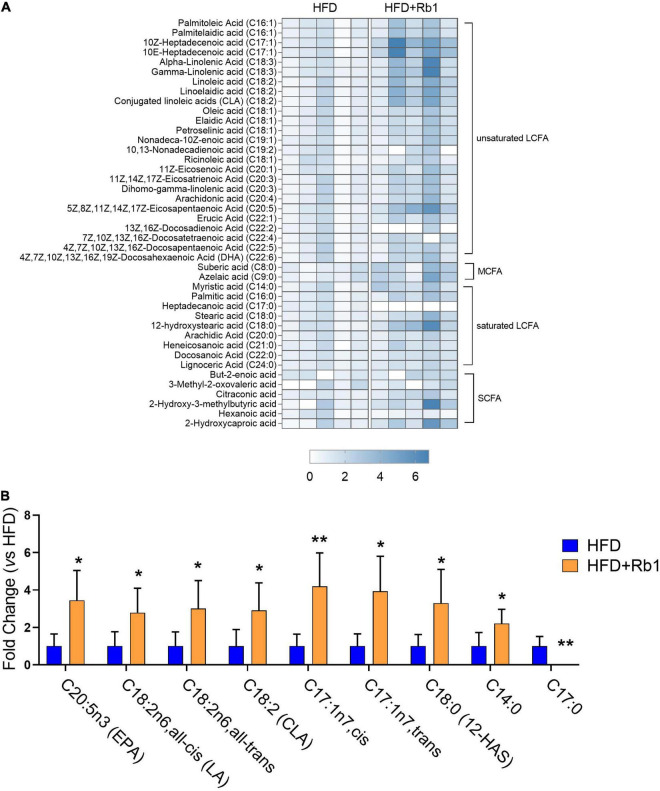
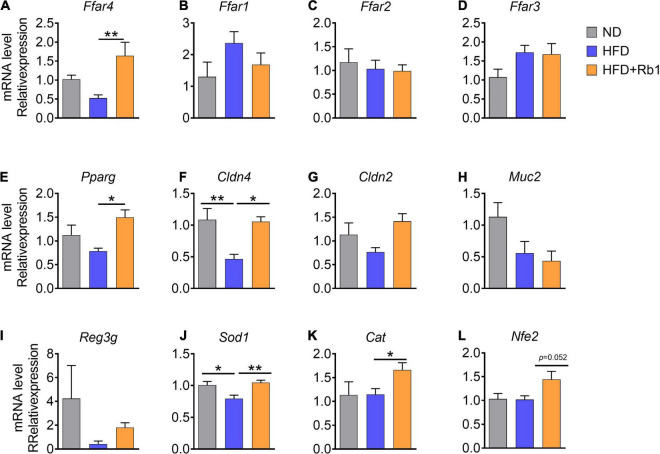
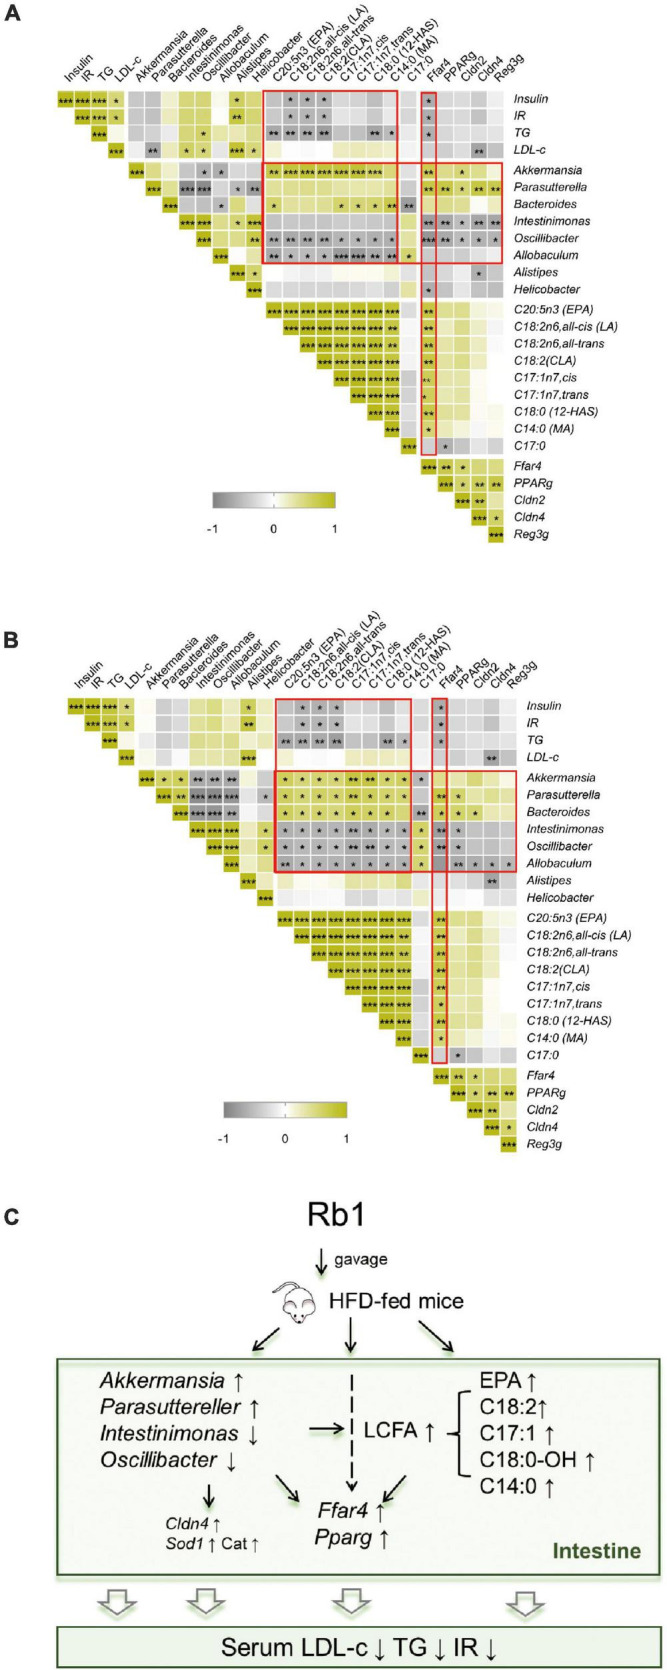
Gut microbiota plays an important role in metabolic homeostasis. Previous studies demonstrated that ginsenoside Rb1 might improve obesity-induced metabolic disorders through regulating glucose and lipid metabolism in the liver and adipose tissues. Due to low bioavailability and enrichment in the intestinal tract of Rb1, we hypothesized that modulation of the gut microbiota might account for its pharmacological effects as well. Here, we show that oral administration of Rb1 significantly decreased serum LDL-c, TG, insulin, and insulin resistance index (HOMA-IR) in mice with a high-fat diet (HFD). Dynamic profiling of the gut microbiota showed that this metabolic improvement was accompanied by restoring of relative abundance of some key bacterial genera. In addition, the free fatty acids profiles in feces were significantly different between the HFD-fed mice with or without Rb1. The content of eight long-chain fatty acids (LCFAs) was significantly increased in mice with Rb1, which was positively correlated with the increase of Akkermansia and Parasuttereller, and negatively correlated with the decrease of Oscillibacter and Intestinimonas. Among these eight increased LCFAs, eicosapentaenoic acid (EPA), octadecenoic acids, and myristic acid were positively correlated with metabolic improvement. Furthermore, the colonic expression of the free fatty acid receptors 4 (Ffar4) gene was significantly upregulated after Rb1 treatment, in response to a notable increase of LCFA in feces. These findings suggested that Rb1 likely modulated the gut microbiota and intestinal free fatty acids profiles, which should be beneficial for the improvement of metabolic disorders in HFD-fed mice. This study provides a novel mechanism of Rb1 for the treatment of metabolic disorders induced by obesity, which may provide a therapeutic avenue for the development of new nutraceutical-based remedies for treating metabolic diseases, such as hyperlipidemia, insulin resistance, and type 2 diabetes.
Keywords: fecal metabolome; free fatty acid receptor; ginsenoside Rb1; gut microbiota; lipidomics; long-chain fatty acids; metabolic disorder.
Copyright © 2022 Zou, Zhang, Zhu, Zhu, Chen, Luo, Xie, Chen, Zhang, Bu, Wei, Ye, Li, Yan, Zhou, Yang, Li, Zhou, Zhang, You, Zheng and Zhao.
Conflict of interest statement
XZ and LZ were employed by the Zhejiang Hongguan Bio-pharma Co., Ltd., Jiaxing, China. QL was employed by the Suzhou BiomeMatch Therapeutics Co., Ltd., Shanghai, China. HZ, GPZ, and YL are inventors of patent application (202210320411.3), related to this work. The remaining authors declare that the research was conducted in the absence of any commercial or financial relationships that could be construed as a potential conflict of interest.
Figures
Similar articles
-
Ginsenoside Rb1 protects against diabetes-associated metabolic disorders in Kkay mice by reshaping gut microbiota and fecal metabolic profiles.J Ethnopharmacol. 2023 Mar 1;303:115997. doi: 10.1016/j.jep.2022.115997. Epub 2022 Dec 9. J Ethnopharmacol. 2023. PMID: 36509256
-
Ginsenoside Rb1 ameliorates Glycemic Disorder in Mice With High Fat Diet-Induced Obesity via Regulating Gut Microbiota and Amino Acid Metabolism.Front Pharmacol. 2021 Nov 24;12:756491. doi: 10.3389/fphar.2021.756491. eCollection 2021. Front Pharmacol. 2021. PMID: 34899310 Free PMC article.
-
Ginsenoside Rb1, Compound K and 20(S)-Protopanaxadiol Attenuate High-Fat Diet-Induced Hyperlipidemia in Rats via Modulation of Gut Microbiota and Bile Acid Metabolism.Molecules. 2024 Mar 1;29(5):1108. doi: 10.3390/molecules29051108. Molecules. 2024. PMID: 38474620 Free PMC article.
-
Beneficial effects of seaweed-derived components on metabolic syndrome via gut microbiota modulation.Front Nutr. 2023 Jun 15;10:1173225. doi: 10.3389/fnut.2023.1173225. eCollection 2023. Front Nutr. 2023. PMID: 37396125 Free PMC article. Review.
-
The interplay between herbal medicines and gut microbiota in metabolic diseases.Front Pharmacol. 2023 Mar 24;14:1105405. doi: 10.3389/fphar.2023.1105405. eCollection 2023. Front Pharmacol. 2023. PMID: 37033634 Free PMC article. Review.
Cited by
-
Effects of Ginsenoside Rb1 on the Crosstalk between Intestinal Stem Cells and Microbiota in a Simulated Weightlessness Mouse Model.Int J Mol Sci. 2024 Aug 12;25(16):8769. doi: 10.3390/ijms25168769. Int J Mol Sci. 2024. PMID: 39201456 Free PMC article.
-
Unlocking ginsenosides' therapeutic power with polymer-based delivery systems: current applications and future perspectives.Front Pharmacol. 2025 Jul 10;16:1629803. doi: 10.3389/fphar.2025.1629803. eCollection 2025. Front Pharmacol. 2025. PMID: 40709093 Free PMC article. Review.
-
Development of the gut microbiota in healthy twins during the first 2 years of life and associations with body mass index z-score: Results from the Wuhan twin birth cohort study.Front Microbiol. 2022 Aug 18;13:891679. doi: 10.3389/fmicb.2022.891679. eCollection 2022. Front Microbiol. 2022. PMID: 36060734 Free PMC article.
-
A mediation analysis of the role of total free fatty acids on pertinence of gut microbiota composition and cognitive function in late life depression.Lipids Health Dis. 2024 Feb 29;23(1):64. doi: 10.1186/s12944-024-02056-6. Lipids Health Dis. 2024. PMID: 38424549 Free PMC article.
-
Gut Microbes Are Associated with the Vascular Beneficial Effects of Dietary Strawberry on Metabolic Syndrome-Induced Vascular Inflammation.Mol Nutr Food Res. 2022 Nov;66(22):e2200112. doi: 10.1002/mnfr.202200112. Epub 2022 Oct 3. Mol Nutr Food Res. 2022. PMID: 36112603 Free PMC article.
References
-
- Akao T., Kida H., Kanaoka M., Hattori M., Kobashi K. (1998b). Intestinal bacterial hydrolysis is required for the appearance of compound K in rat plasma after oral administration of ginsenoside Rb1 from Panax ginseng. J. Pharm. Pharmacol. 50 1155–1160. 10.1111/j.2042-7158.1998.tb03327.x - DOI - PubMed
LinkOut - more resources
Full Text Sources
Research Materials
Miscellaneous