

MicroRNA Profile of MA-104 Cell Line Associated With the Pathogenesis of Bovine Rotavirus Strain Circulated in Chinese Calves
- PMID: 35516441
- PMCID: PMC9062783
- DOI: 10.3389/fmicb.2022.854348
MicroRNA Profile of MA-104 Cell Line Associated With the Pathogenesis of Bovine Rotavirus Strain Circulated in Chinese Calves
Abstract
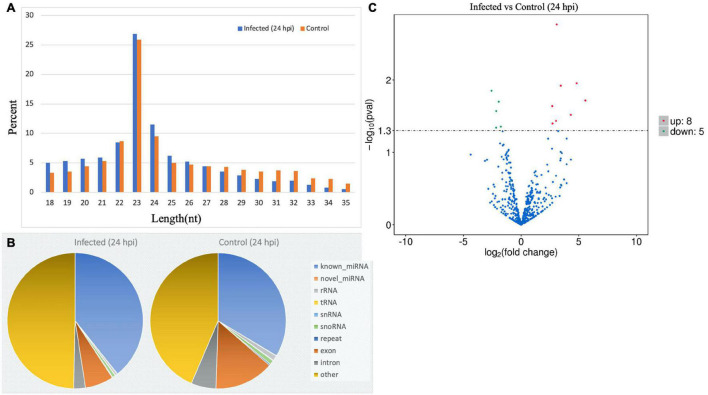
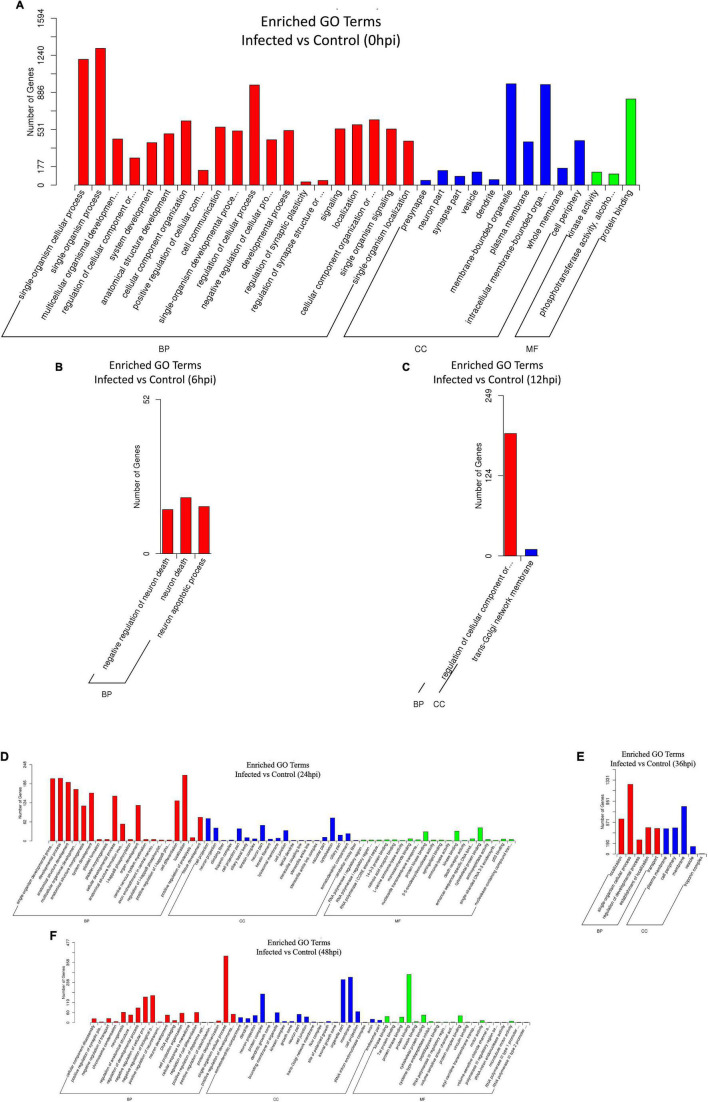
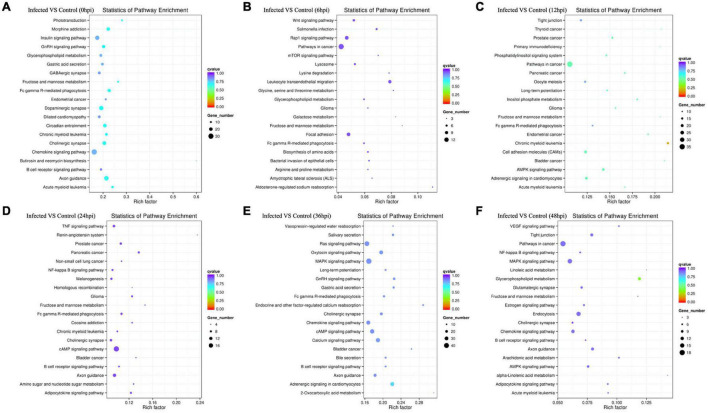
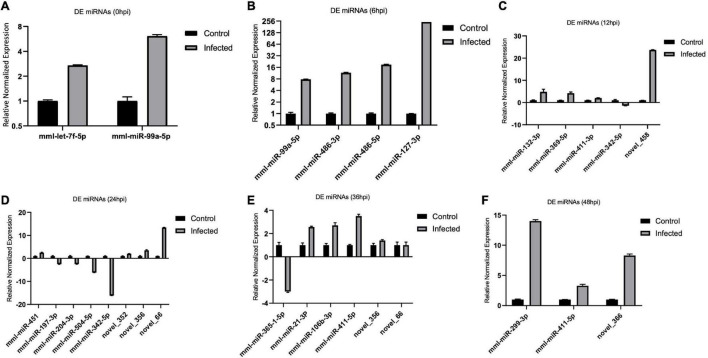
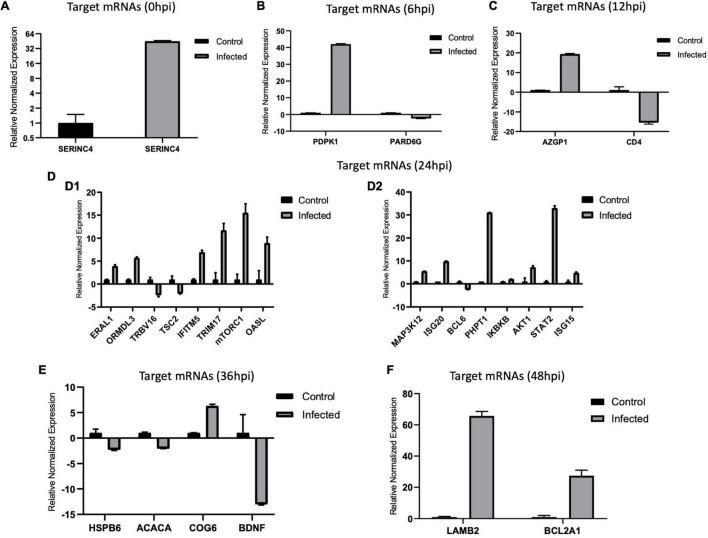
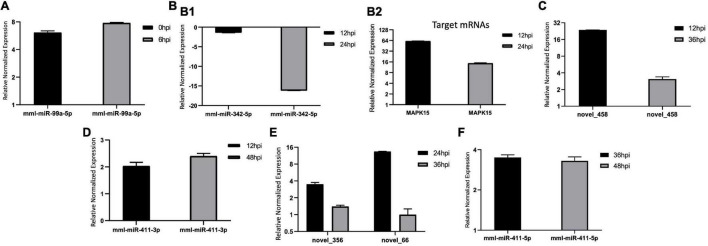
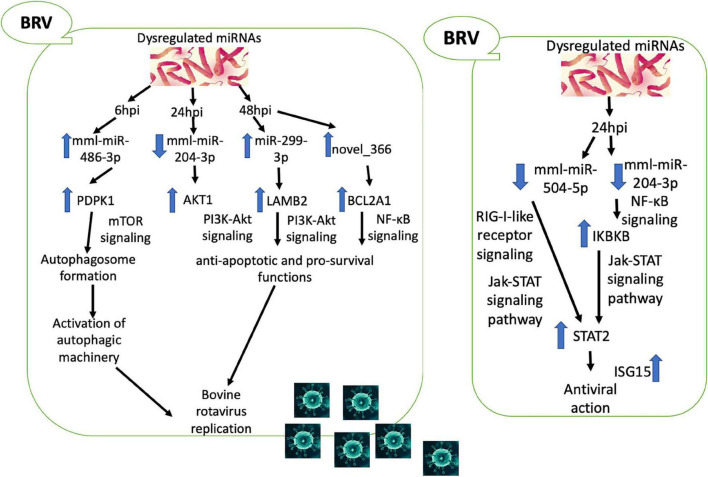
Bovine rotavirus (BRV) causes massive economic losses in the livestock industry worldwide. Elucidating the pathogenesis of BRV would help in the development of more effective measures to control BRV infection. The MA-104 cell line is sensitive to BRV and is thereby a convenient tool for determining BRV-host interactions. Thus far, the role of the microRNAs (miRNAs) of MA-104 cells during BRV infection is still ambiguous. We performed Illumina RNA sequencing analysis of the miRNA libraries of BRV-infected and mock-infected MA-104 cells at different time points: at 0 h post-infection (hpi) (just after 90 min of adsorption) and at 6, 12, 24, 36, and 48 hpi. The total clean reads obtained from BRV-infected and uninfected cells were 74,701,041 and 74,184,124, respectively. Based on these, 579 were categorized as known miRNAs and 144 as novel miRNAs. One hundred and sixty differentially expressed (DE) miRNAs in BRV-infected cells in comparison with uninfected MA-104 cells were successfully investigated, 95 of which were upregulated and 65 were downregulated. The target messenger RNAs (mRNAs) of the DE miRNAs were examined by bioinformatics analysis. Functional annotation of the target genes with Gene Ontology (GO) and Kyoto Encyclopedia of Genes and Genomes (KEGG) suggested that these genes mainly contributed to biological pathways, endocytosis, apoptotic process, trans-Golgi membrane, and lysosome. Pathways such as the mammalian target of rapamycin (mTOR) (mml-miR-486-3p and mml-miR-197-3p), nuclear factor kappa B (NF-κB) (mml-miR-204-3p and novel_366), Rap1 (mml-miR-127-3p), cAMP (mml-miR-106b-3p), mitogen-activated protein kinase (MAPK) (mml-miR-342-5p), T-cell receptor signaling (mml-miR-369-5p), RIG-I-like receptor signaling (mml-miR-504-5p), AMP-activated protein kinase (AMPK) (mml-miR-365-1-5p), and phosphatidylinositol-3-kinase/protein kinase B (PI3K/Akt) signaling (mml-miR-299-3p) were enriched. Moreover, real-time quantitative PCR (qPCR) verified the expression profiles of 23 selected DE miRNAs, which were consistent with the results of deep sequencing, and the 28 corresponding target mRNAs were mainly of regulatory pathways of the cellular machinery and immune importance, according to the bioinformatics analysis. Our study is the first to report a novel approach that uncovers the impact of BRV infection on the miRNA expressions of MA-104 cells, and it offers clues for identifying potential candidates for antiviral or vaccine strategies.
Keywords: bovine rotavirus G8P[7] isolate; deep sequencing; miRNA; miRNA-mRNA interaction; signaling pathway.
Copyright © 2022 Elkady, Chen, Hu, Chen, Chen and Guo.
Conflict of interest statement
The authors declare that the research was conducted in the absence of any commercial or financial relationships that could be construed as a potential conflict of interest.
Figures
Similar articles
-
Human cytomegalovirus latent infection alters the expression of cellular and viral microRNA.Gene. 2014 Feb 25;536(2):272-8. doi: 10.1016/j.gene.2013.12.012. Epub 2013 Dec 18. Gene. 2014. PMID: 24361963
-
Small RNA sequencing and profiling of serum-derived exosomes from African swine fever virus-infected pigs.J Anim Sci. 2023 Jan 3;101:skac400. doi: 10.1093/jas/skac400. J Anim Sci. 2023. PMID: 36478238 Free PMC article.
-
Analysis of microRNA expression profiles in human bronchial epithelial cells infected by Chlamydia psittaci.Microb Pathog. 2021 May;154:104837. doi: 10.1016/j.micpath.2021.104837. Epub 2021 Mar 6. Microb Pathog. 2021. PMID: 33689813
-
Regulation of the MIR155 host gene in physiological and pathological processes.Gene. 2013 Dec 10;532(1):1-12. doi: 10.1016/j.gene.2012.12.009. Epub 2012 Dec 14. Gene. 2013. PMID: 23246696 Review.
-
RNA-Seq Revealed a Circular RNA-microRNA-mRNA Regulatory Network in Hantaan Virus Infection.Front Cell Infect Microbiol. 2020 Mar 13;10:97. doi: 10.3389/fcimb.2020.00097. eCollection 2020. Front Cell Infect Microbiol. 2020. PMID: 32232013 Free PMC article. Review.
Cited by
-
Rotavirus Reverse Genetics Systems and Oral Vaccine Delivery Vectors for Mucosal Vaccination.Microorganisms. 2025 Jul 4;13(7):1579. doi: 10.3390/microorganisms13071579. Microorganisms. 2025. PMID: 40732089 Free PMC article. Review.
-
Lnc-DARVR/miR-365-1-5p/LAMB1 axis regulates rotavirus replication via the complement C3 pathway.J Virol. 2025 May 20;99(5):e0211424. doi: 10.1128/jvi.02114-24. Epub 2025 Apr 16. J Virol. 2025. PMID: 40237496 Free PMC article.
References
-
- Bagchi P., Dutta D., Chattopadhyay S., Mukherjee A., Halder U. C., Sarkar S., et al. (2010). Rotavirus nonstructural protein 1 suppresses virus-induced cellular apoptosis to facilitate viral growth by activating the cell survival pathways during early stages of infection. J. Virol. 84 6834–6845. 10.1128/JVI.00225-10 - DOI - PMC - PubMed
LinkOut - more resources
Full Text Sources
Molecular Biology Databases
Miscellaneous