

A biological condition gradient for Caribbean coral reefs: Part II. Numeric rules using sessile benthic organisms
- PMID: 35516524
- PMCID: PMC9067392
- DOI: 10.1016/j.ecolind.2022.108576
A biological condition gradient for Caribbean coral reefs: Part II. Numeric rules using sessile benthic organisms
Abstract
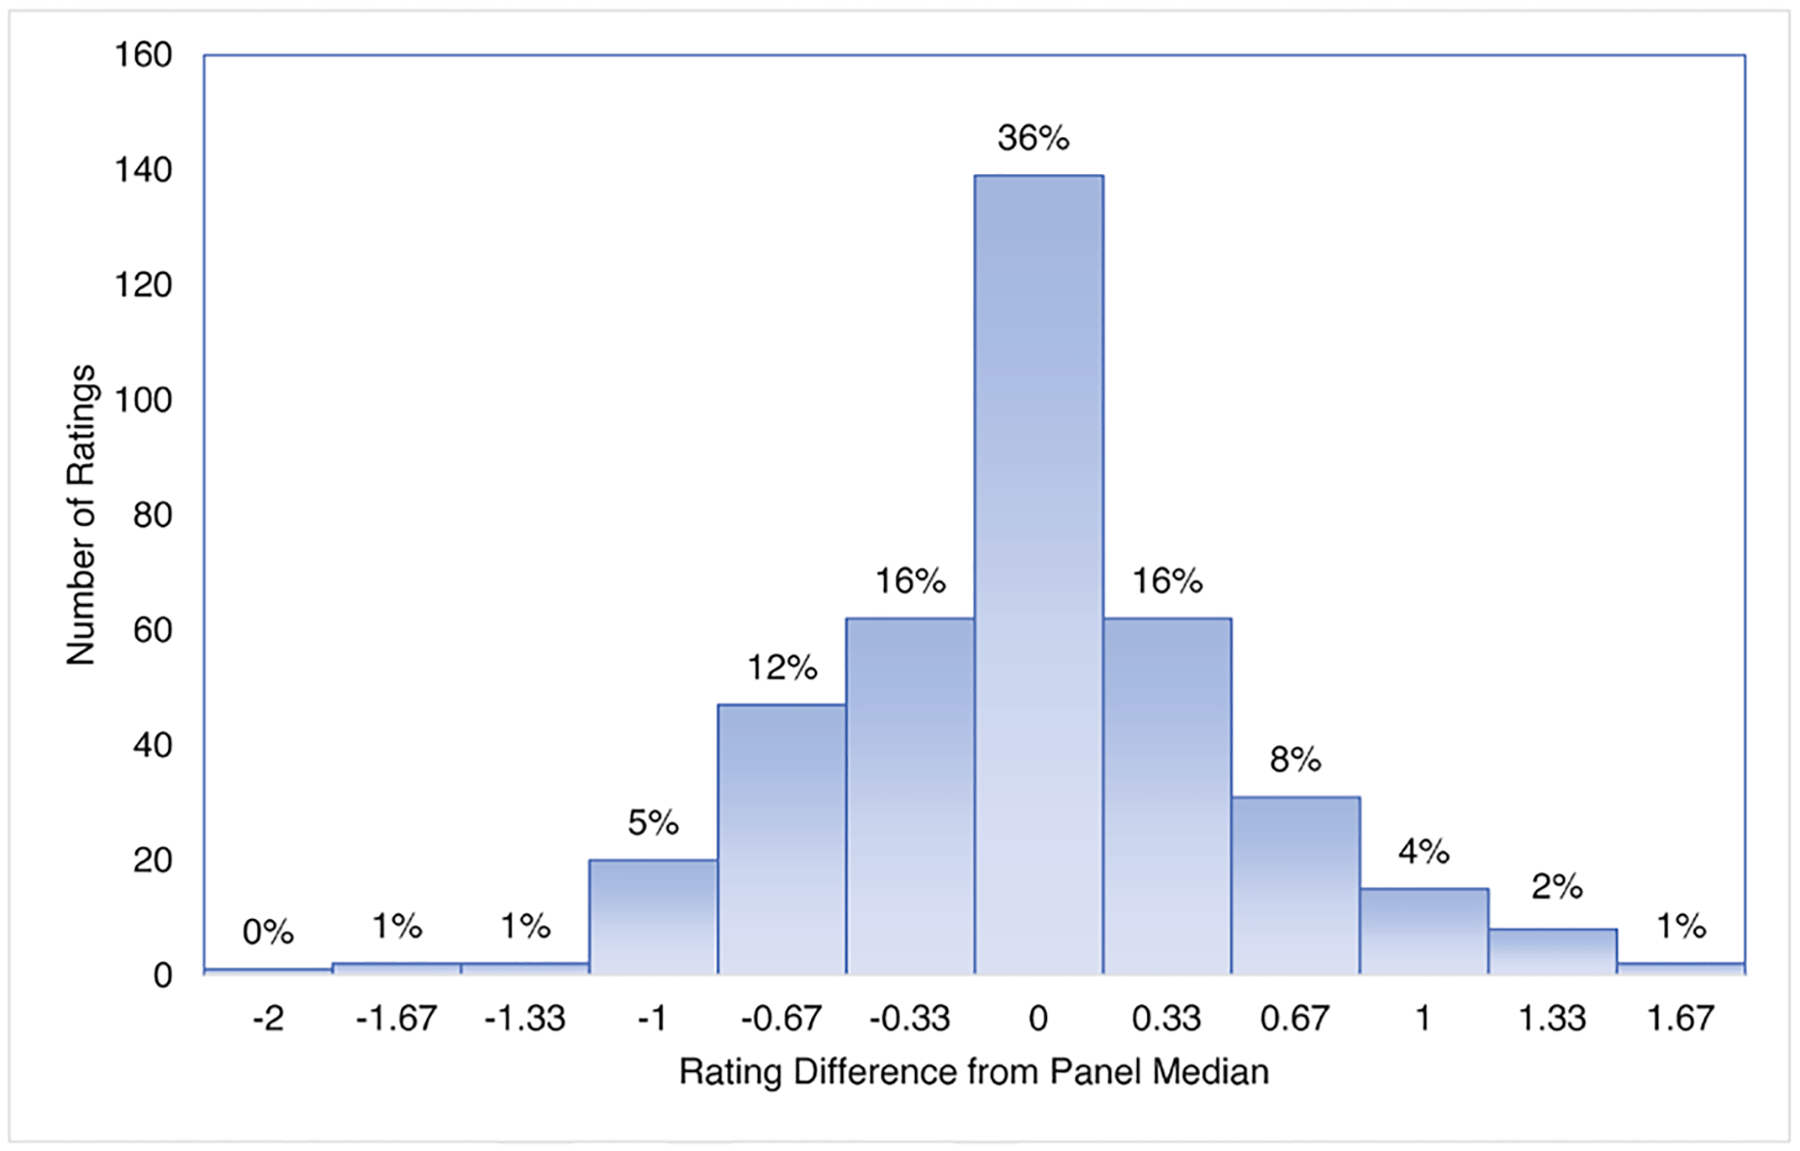
The Biological Condition Gradient (BCG) is a conceptual model used to describe incremental changes in biological condition along a gradient of increasing anthropogenic stress. As coral reefs collapse globally, scientists and managers are focused on how to sustain the crucial structure and functions, and the benefits that healthy coral reef ecosystems provide for many economies and societies. We developed a numeric (quantitative) BGC model for the coral reefs of Puerto Rico and the US Virgin Islands to transparently facilitate ecologically meaningful management decisions regarding these fragile resources. Here, reef conditions range from natural, undisturbed conditions to severely altered or degraded conditions. Numeric decision rules were developed by an expert panel for scleractinian corals and other benthic assemblages using multiple attributes to apply in shallow-water tropical fore reefs with depths <30 m. The numeric model employed decision rules based on metrics (e.g., % live coral cover, coral species richness, pollution-sensitive coral species, unproductive and sediment substrates, % cover by Orbicella spp.) used to assess coral reef condition. Model confirmation showed the numeric BCG model predicted the panel's median site ratings for 84% of the sites used to calibrate the model and 89% of independent validation sites. The numeric BCG model is suitable for adaptive management applications and supports bioassessment and criteria development. It is a robust assessment tool that could be used to establish ecosystem condition that would aid resource managers in evaluating and communicating current or changing conditions, protect water and habitat quality in areas of high biological integrity, or develop restoration goals with stakeholders and other public beneficiaries.
Keywords: Biocriteria; Biological Condition Gradient (BCG); Biological integrity; Coral reef condition; Coral reef protection; numeric model.
Conflict of interest statement
Declaration of Competing Interest The authors declare that they have no known competing financial interests or personal relationships that could have appeared to influence the work reported in this paper.
Figures


Similar articles
-
A biological condition gradient for coral reefs in the US Caribbean Territories: Part I. Coral narrative rules.Ecol Indic. 2022 May;138:1-13. doi: 10.1016/j.ecolind.2022.108805. Ecol Indic. 2022. PMID: 36761828 Free PMC article.
-
Development of a reef fish biological condition gradient model with quantitative decision rules for the protection and restoration of coral reef ecosystems.Mar Pollut Bull. 2020 Oct;159:111387. doi: 10.1016/j.marpolbul.2020.111387. Epub 2020 Aug 19. Mar Pollut Bull. 2020. PMID: 32827871 Free PMC article.
-
Hydroids (Cnidaria, Hydrozoa) from Mauritanian Coral Mounds.Zootaxa. 2020 Nov 16;4878(3):zootaxa.4878.3.2. doi: 10.11646/zootaxa.4878.3.2. Zootaxa. 2020. PMID: 33311142
-
A geological perspective on the degradation and conservation of western Atlantic coral reefs.Conserv Biol. 2016 Aug;30(4):706-15. doi: 10.1111/cobi.12725. Epub 2016 Apr 29. Conserv Biol. 2016. PMID: 27029403 Review.
-
Do coral reefs act as sinks for microplastics?Environ Pollut. 2023 Nov 15;337:122509. doi: 10.1016/j.envpol.2023.122509. Epub 2023 Sep 9. Environ Pollut. 2023. PMID: 37690465 Review.
Cited by
-
Comparison of coral reef communities in proximity to ocean effluent pipes off the north coast of Puerto Rico.Environ Monit Assess. 2022 Nov 29;195(1):162. doi: 10.1007/s10661-022-10756-8. Environ Monit Assess. 2022. PMID: 36445503 Free PMC article.
-
Exploring coral reef communities in Puerto Rico using Bayesian networks.Ecol Inform. 2024 Jun 5;82:102665. doi: 10.1016/j.ecoinf.2024.102665. Ecol Inform. 2024. PMID: 39377040 Free PMC article.
-
Reef structure of the Florida Reef Tract for the period 2005-2020.Environ Monit Assess. 2023 Sep 22;195(10):1242. doi: 10.1007/s10661-023-11819-0. Environ Monit Assess. 2023. PMID: 37737940 Free PMC article.
-
Relating fish populations to coral colony size and complexity.Ecol Indic. 2023 Mar 12;148:110117. doi: 10.1016/j.ecolind.2023.110117. Ecol Indic. 2023. PMID: 39376477 Free PMC article.
-
A biological condition gradient for coral reefs in the US Caribbean Territories: Part I. Coral narrative rules.Ecol Indic. 2022 May;138:1-13. doi: 10.1016/j.ecolind.2022.108805. Ecol Indic. 2022. PMID: 36761828 Free PMC article.
References
-
- Alvarez-Filip L, Dulvy NK, Côté IM, Watkinson AR, Gill JA, 2011. Coral identity underpins architectural complexity on Caribbean reefs. Ecol. Appl 21, 2223–2231. - PubMed
-
- Bozec YM, Alvarez-Filip L, Mumby PJ, 2015. The dynamics of architectural complexity on coral reefs under climate change. Glob. Change Biol 21, 223–235. - PubMed
-
- Brandt ME, Zurcher N, Acosta A, Ault JS, Bohnsack JA, Feeley MW, Harper DE, Hunt JH, Kellison T, McClellan DB, Patterson ME, Smith SG 2009. A cooperative multi-agency reef fish monitoring protocol for the Florida Keys coral reef ecosystem. Natural Resource Report NPS/SFCN/NRR-2009/150, Fort Collins, Colorado, National Park Service.
-
- Bradley P, Jessup B, Pittman SJ, Jeffrey CFJ, Ault JS, Carrubba L, Lilyestrom C, Appeldoorn R, McField M, Schärer MT, Santavy DL, Wojtenko I, Smith T, Garcia G, Huertas E, Murry B, Walker BK, Ramos A, Gerritsen J, Jackson SK, 2020. Using reef fish as biocriteria to protect Caribbean coral reef ecosystems. Mar. Pollut. Bull 159, 111287. - PMC - PubMed
-
- Costa BM, Bauer LJ, Battista TA, Mueller PW, Monaco ME 2009. Moderate-Depth Benthic Habitats of St. John, U.S. Virgin Islands. NOAA Technical Memorandum NOS NCCOS 105. NCCOS Center for Coastal Monitoring and Assessment Biogeography Branch Silver Spring, MD.
Grants and funding
LinkOut - more resources
Full Text Sources
Research Materials
Miscellaneous