. 2022 Apr 19:4:864441.
doi: 10.3389/ftox.2022.864441. eCollection 2022.

Application of the Adverse Outcome Pathway Concept to In Vitro Nephrotoxicity Assessment: Kidney Injury due to Receptor-Mediated Endocytosis and Lysosomal Overload as a Case Study

Affiliations

Application of the Adverse Outcome Pathway Concept to In Vitro Nephrotoxicity Assessment: Kidney Injury due to Receptor-Mediated Endocytosis and Lysosomal Overload as a Case Study

Sebastian Jarzina et al. Front Toxicol. .

Abstract

Application of adverse outcome pathways (AOP) and integration of quantitative in vitro to in vivo extrapolation (QIVIVE) may support the paradigm shift in toxicity testing to move from apical endpoints in test animals to more mechanism-based in vitro assays. Here, we developed an AOP of proximal tubule injury linking a molecular initiating event (MIE) to a cascade of key events (KEs) leading to lysosomal overload and ultimately to cell death. This AOP was used as a case study to adopt the AOP concept for systemic toxicity testing and risk assessment based on in vitro data. In this AOP, nephrotoxicity is thought to result from receptor-mediated endocytosis (MIE) of the chemical stressor, disturbance of lysosomal function (KE1), and lysosomal disruption (KE2) associated with release of reactive oxygen species and cytotoxic lysosomal enzymes that induce cell death (KE3). Based on this mechanistic framework, in vitro readouts reflecting each KE were identified. Utilizing polymyxin antibiotics as chemical stressors for this AOP, the dose-response for each in vitro endpoint was recorded in proximal tubule cells from rat (NRK-52E) and human (RPTEC/TERT1) in order to (1) experimentally support the sequence of key events (KEs), to (2) establish quantitative relationships between KEs as a basis for prediction of downstream KEs based on in vitro data reflecting early KEs and to (3) derive suitable in vitro points of departure for human risk assessment. Time-resolved analysis was used to support the temporal sequence of events within this AOP. Quantitative response-response relationships between KEs established from in vitro data on polymyxin B were successfully used to predict in vitro toxicity of other polymyxin derivatives. Finally, a physiologically based kinetic (PBK) model was utilized to transform in vitro effect concentrations to a human equivalent dose for polymyxin B. The predicted in vivo effective doses were in the range of therapeutic doses known to be associated with a risk for nephrotoxicity. Taken together, these data provide proof-of-concept for the feasibility of in vitro based risk assessment through integration of mechanistic endpoints and reverse toxicokinetic modelling.

Keywords: In vitro toxicity testing; QIVIVE; adverse outcome pathway (AOP); key event relationship; nephrotoxicity; risk assessment.


Conflict of interest statement

The authors declare that the research was conducted in the absence of any commercial or financial relationships that could be construed as a potential conflict of interest.

Figures

FIGURE 1
FIGURE 1
AOP receptor-mediated endocytosis and lysosomal overload. The AOP describes the sequence of key events leading to kidney injury as an AO initiated by receptor-mediated endocytosis (MIE), subsequent disturbance of lysosomal function (KE1), disruption of lysosomes (KE2) and proximal tubule cell toxicity (KE3).
FIGURE 2
FIGURE 2
Schematic representation of the model (A) and the distribution mechanisms of compounds in the kidneys (C) or to the other tissue compartments (B). Figure (A) was adapted from Bouchene et al. (2018). Figure (B,C) were adapted from Viel et al. (2018). The terms refer to: VTISSUE, tissue volume; QTISSUE, tissue blood flow; Kp-tissue, partition coefficient; KKID, partition coefficient for kidneys; QKID, kidney blood flow; QTUB, tubular fluid flow; CLGFR_CMS and CLGFR_COLI, glomerular filtration clearance of CMS and colistin. CLbaso_CMS, clearance of CMS from the blood to PTC across the basolateral membrane of PTC; Kreab_coli, reabsorption rate of colistin from the tubular lumen to PTC across the apical membrane of PTC; Ksec_CMS, secretion rate of CMS from PTC to the tubular lumen across the apical membrane of PTC.
FIGURE 3
FIGURE 3
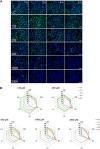
Time-resolved analysis of the effect of polymyxin B on RPTEC/TERT1 cells. (A) Representative confocal microscopy images of cells treated with polymyxin B (only selected concentrations are shown). Each row shows a different concentration (µM), each column represents a treatment time. Lysosomes stained with the fluorescent dye LysoTracker™ Red are shown in green. Nuclei stained with the fluorescent dye Hoechst 33342 are shown in blue. Scale bar = 20 μm. (B) Radar or spider-web diagrams based on relative values for selected image analysis parameters normalized against untreated control cells (UC) set to 100% (black dashed line). Each coloured line represents a time point between 1 and 6 h treatment. Each diagram refers to a selected concentration (only concentrations between 125 and 2000 µM are shown). UC = untreated control cells; CW = cells per well; NA = nuclei area; NI = nuclei intensity; LC = lysosomes per cell area; LI = lysosome integrated intensity; LA = total lysosome area.
FIGURE 4
FIGURE 4
Time-resolved analysis of the effect of polymyxin B on NRK-52E cells. (A) Representative confocal microscopy images of cells treated with polymyxin B (only selected concentrations are shown). Each row shows a different concentration (µM), each column represents a treatment time. Lysosomes stained with the fluorescent dye LysoView™ 633 are shown in green. Nuclei stained with the fluorescent dye SYTO16 are shown in blue. Scale bar = 20 μm. (B) Radar or spider-web diagrams based on relative values for selected image analysis parameters normalized against untreated control cells (UC) set to 100% (black dashed line). Each coloured line represent a time point between 4 and 24 h treatment. Each diagram refers to a selected concentration (only concentrations between 250 and 2000 µM are shown). UC = untreated control cells; CW = cells per well; NA = nuclei area; NI = nuclei intensity; LC = lysosomes per cell area; LI = lysosome integrated intensity; LA = total lysosome area.
FIGURE 5
FIGURE 5
Quantitative analysis of the effect of polymyxin B across the KEs of the AOP receptor-mediated endocytosis and lysosomal overload. Confocal immunofluorescence images of LAMP-1/2 (green; scale bar: 15 µm) and cathepsin D (green, scale bar: 10 µm) in RPTEC/TERT1 and NRK-52E cells treated with polymyxin B for 24 h (A). Cell nuclei were stained with DAPI (blue). Untreated kidney tubule cells showed poor LAMP-1/2 staining, while treatment with polymyxin B resulted in a concentration-dependent increase in LAMP-1/2 (A,B). Cathepsin D staining in untreated cells appeared with characteristic punctual structures throughout the cytosol, consistent with its lysosomal localization. Treatment with polymyxin B caused a concentration-dependent re-distribution of the punctate cathepsin D staining to a more diffuse staining throughout the cytosol, indicative for lysosomal membrane permeabilization with release of cathepsin D (A,C). Concentration-response curves obtained from LAMP-1/2 (KE1) and cathepsin D (KE1) immunofluorescence analysis (B,C) and cell viability (KE3) (D) following treatment of RPTEC/TERT1 (solid lines, solid symbols) and NRK-52E cells (dashed lines, open symbols) with polymyxin B, colistin, polymyxin B nonapeptide and CdCl2 as putative stressors for this AOP. Note that technical issues precluded generation of cathepsin D data on colistin, PBNP, and CdCl2 in RPTEC/TERT1 cells (C). All experiments were performed in three independent experiments carried out in triplicates. Data are presented as mean ± SD fold change (n = 3).
FIGURE 6
FIGURE 6
LC-MS/MS analysis of intracellular concentrations of polymyxin B and colistin in RPTEC/TERT1 (―) and NRK-52E (---) cells, showing time-dependent accumulation of polymyxins and significantly higher uptake into RPTEC/TERT1 cells as compared to NRK-52E cells. (A,B). Confocal fluorescence images (scale bar: 25 µm) and fluorescence intensity analysis of Alexa-488 labeled aprotinin uptake (green, left panel) after 4 h incubation of NRK-52E and RPTEC/TERT1 cells with Alexa-488 labeled aprotinin to assess endocytic activity (C), showing increased accumulation of Alexa-488 labeled aprotinin in RPTEC/TERT1 cells as compared to NRK-52E cells. Nuclei were stained with DAPI (blue). Images were acquired with a 63 × 1.4 oil UV objective (scale bar: 25 µm). Data are representative of three independent experiments carried out in triplicates. Data are presented as mean ± SD fold change (n = 3).
FIGURE 7
FIGURE 7
Response-response analysis of polymyxin B KE data obtained in RPTEC/TERT1 (A) and NRK-52E (B) cells. Based on experimental in vitro data on KE1 (LAMP-1/2 intensity), KE2 (cathepsin D intensity), and KE3 (cell viability), additional data points were computed to establish quantitative KER. To this end, KE2 was plotted as a function of KE1 (f(x)), while KE3 was plotted as a function of KE2 (g(x)).
FIGURE 8
FIGURE 8
Prediction of colistin, polymyxin B nonapeptide, and CdCl2 cytotoxicity using response-response relationships based on polymyxin B data in RPTEC/TERT1 (A) and NRK-52E (B). Experimentally determined KE1 data (disturbance of lysosomal function) obtained after treatment of cells with colistin (black), PBNP (grey), and CdCl2 (brown) represented by solid lines were used to calculate additional data points (dotted lines) from the obtained mathematical equations for KE1 (disturbance of lysosomal function). Computed KE1 data were then used to predict KE2 (disruption of lysosomes) (dotted lines) using qKER1 (f(x)) obtained from polymyxin B data. As a final step, the predicted KE2 data were utilized using qKER2 (g(x)) from polymyxin B data to predict KE3 (cytotoxicity) (dotted lines). For better comparison, the dose-response curves of the experimentally determined cytotoxicity (solid lines) and the predicted cytotoxicity (dotted lines) were merged into a single graph.
FIGURE 9
FIGURE 9
PBPK-model simulated plasma concentrations of 1.0 mg/kg bodyweight polymyxin B, administered by intravenous infusion over 1 h in humans (A). The blue line is the simulation without transporter kinetics (assuming only glomerular filtration). The red line includes active transport to proximal tubule cells. Separate points are measured plasma concentrations obtained from three female patients (Zavascki et al., 2008). QIVIVE based on nominal (solid lines) and cell-associated (dashed lines) polymyxin B in vitro effect concentrations (B). The red lines are human bioequivalent dose-response relationships for polymyxin B using results from the in vitro LAMP-2 assay in RPTEC/TERT1 cells, the blue lines are human bioequivalent dose-response relationships using results from the in vitro CellTiter-Glo® assay with RPTEC/TERT1 cells. The pink bar highlights the clinical authorized dose of polymyxin B, which is associated with nephrotoxic side effects in patients. Note that biological effects on both KEs kick in at similar concentrations, whereas the dose-response concordance between both KE appears to be poorer at higher concentrations at which pronounced cytotoxicity is recorded. This may be due to disruption of lysosomes at these concentrations and time-points. A better concordance between both KEs may be expected when integrating the aspect of time, i.e. assessing LAMP expression at an earlier time-point at which cytotoxicity does not yet occur.

Similar articles

Cited by

References

    1. Appelqvist H., Nilsson C., Garner B., Brown A. J., Kågedal K., Öllinger K. (2011). Attenuation of the Lysosomal Death Pathway by Lysosomal Cholesterol Accumulation. Am. J. Pathol. 178 (2), 629–639. 10.1016/j.ajpath.2010.10.030 - DOI - PMC - PubMed
    1. Birk B., Haake V., Sperber S., Herold M., Wallisch S. K., Huener H.-A., et al. (2021). Use of In Vitro Metabolomics in NRK Cells to Help Predicting Nephrotoxicity and Differentiating the MoA of Nephrotoxicants. Toxicol. Lett. 353, 43–59. 10.1016/j.toxlet.2021.09.011 - DOI - PubMed
    1. Bouchene S., Marchand S., Couet W., Friberg L. E., Gobin P., Lamarche I., et al. (2018). A Whole-Body Physiologically Based Pharmacokinetic Model for Colistin and Colistin Methanesulfonate in Rat. Basic Clin. Pharmacol. Toxicol. 123 (4), 407–422. 10.1111/bcpt.13026 - DOI - PubMed
    1. Brown R. P., Delp M. D., Lindstedt S. L., Rhomberg L. R., Beliles R. P. (1997). Physiological Parameter Values for Physiologically Based Pharmacokinetic Models. Toxicol. Ind. Health 13 (4), 407–484. 10.1177/074823379701300401 - DOI - PubMed
    1. Conolly R. B., Ankley G. T., Cheng W., Mayo M. L., Miller D. H., Perkins E. J., et al. (2017). Quantitative Adverse Outcome Pathways and Their Application to Predictive Toxicology. Environ. Sci. Technol. 51 (8), 4661–4672. 10.1021/acs.est.6b06230 - DOI - PMC - PubMed

LinkOut - more resources