. 2019 Jun 17;9(33):18874-18887.
doi: 10.1039/c9ra00541b. eCollection 2019 Jun 14.

Folic acid-conjugated gold nanorod@polypyrrole@Fe3O4 nanocomposites for targeted MR/CT/PA multimodal imaging and chemo-photothermal therapy

Affiliations

Folic acid-conjugated gold nanorod@polypyrrole@Fe3O4 nanocomposites for targeted MR/CT/PA multimodal imaging and chemo-photothermal therapy

Wei Cao et al. RSC Adv. .

Abstract

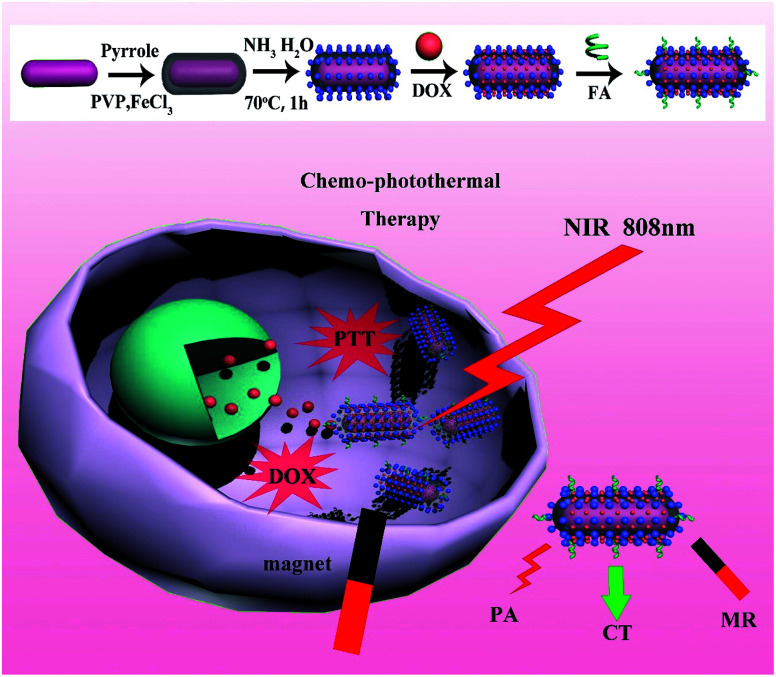
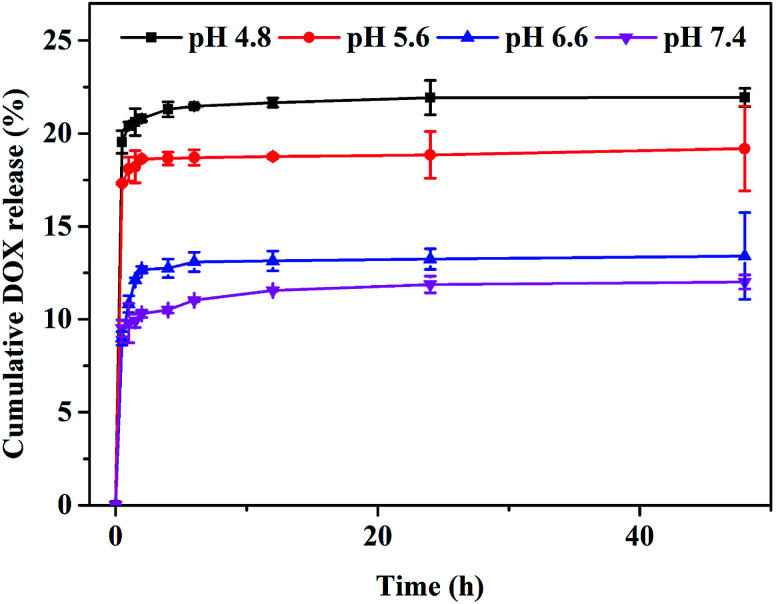
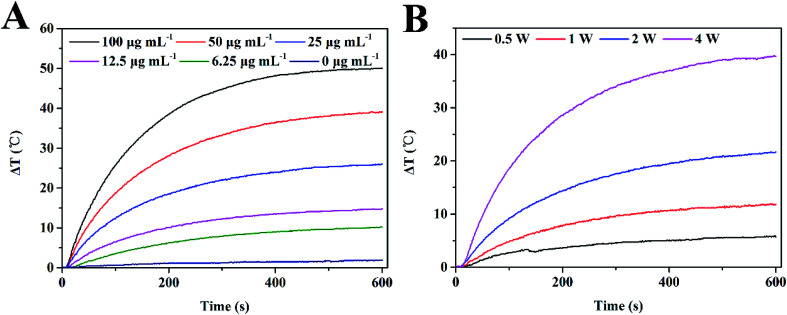
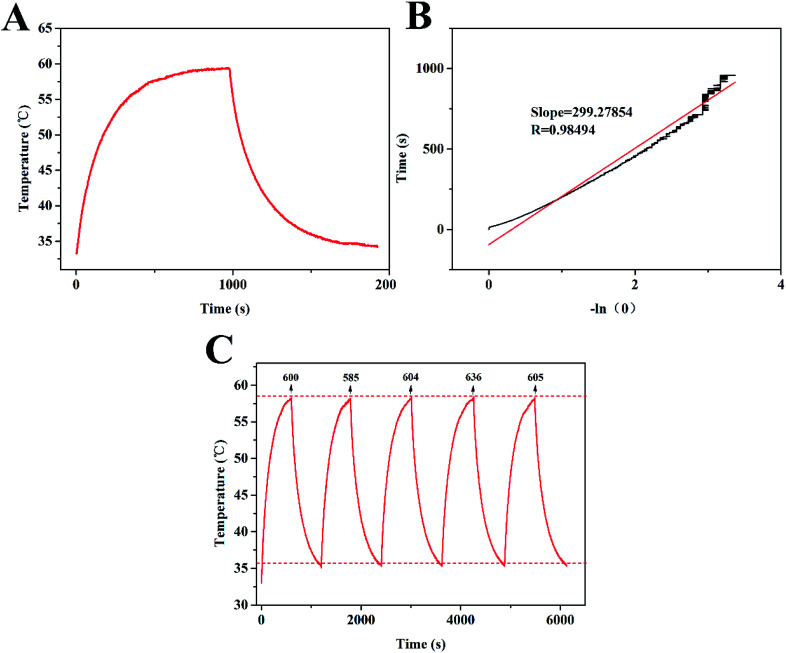
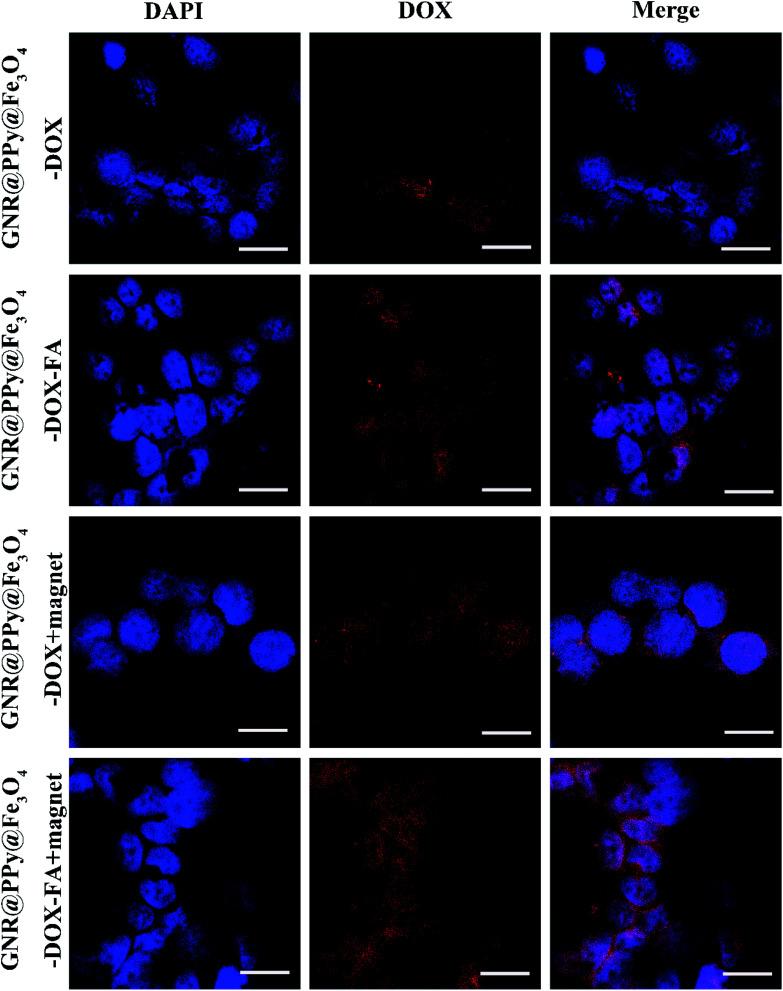
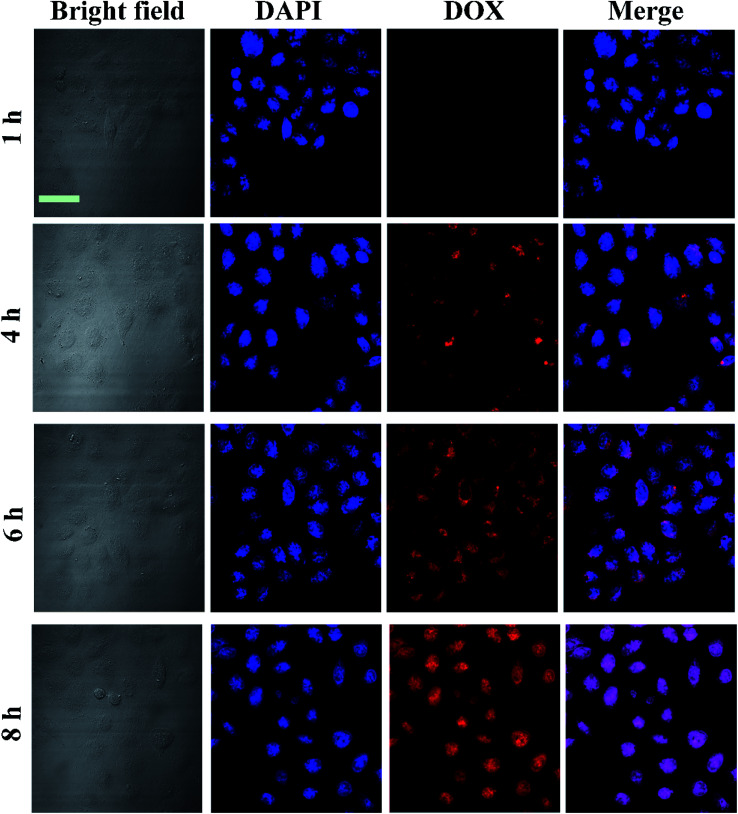
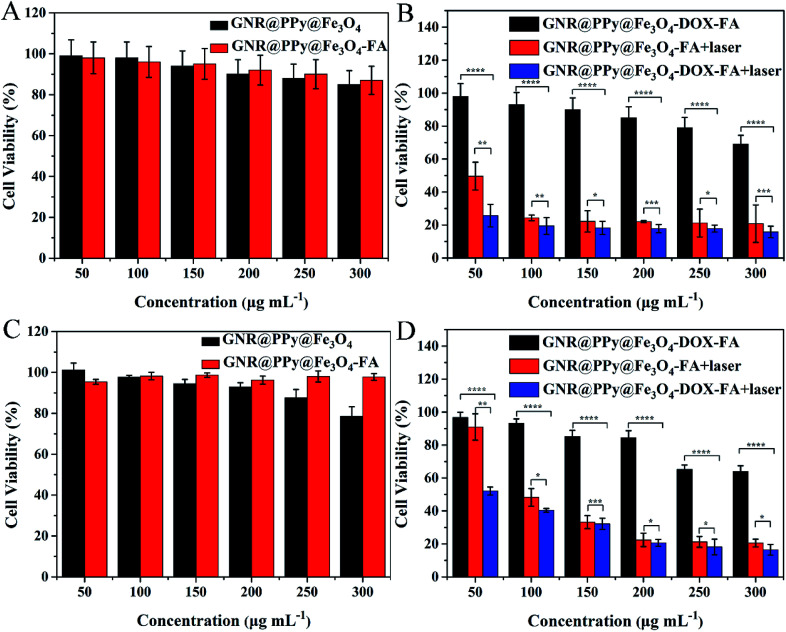
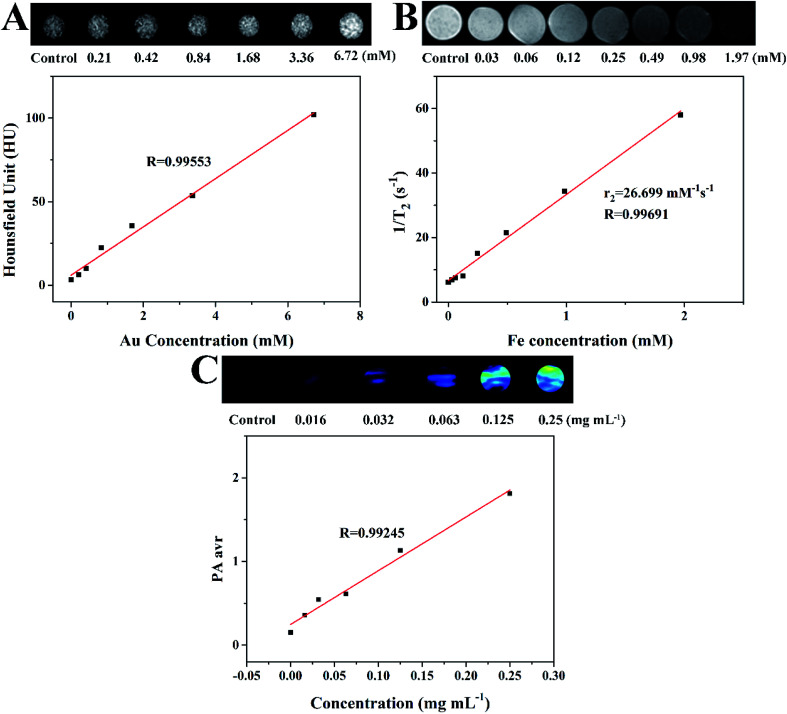
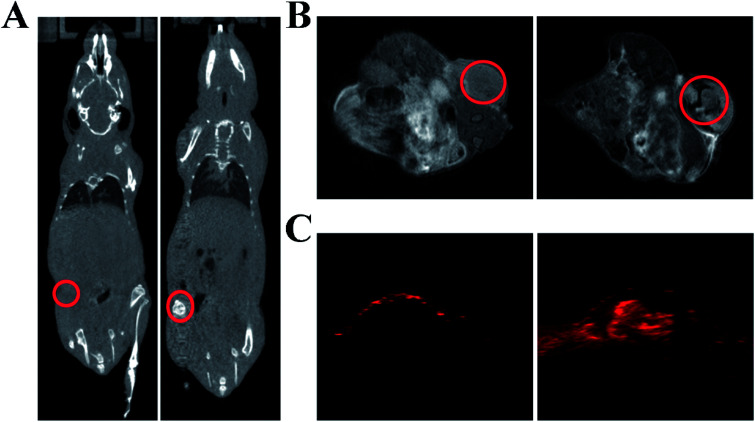
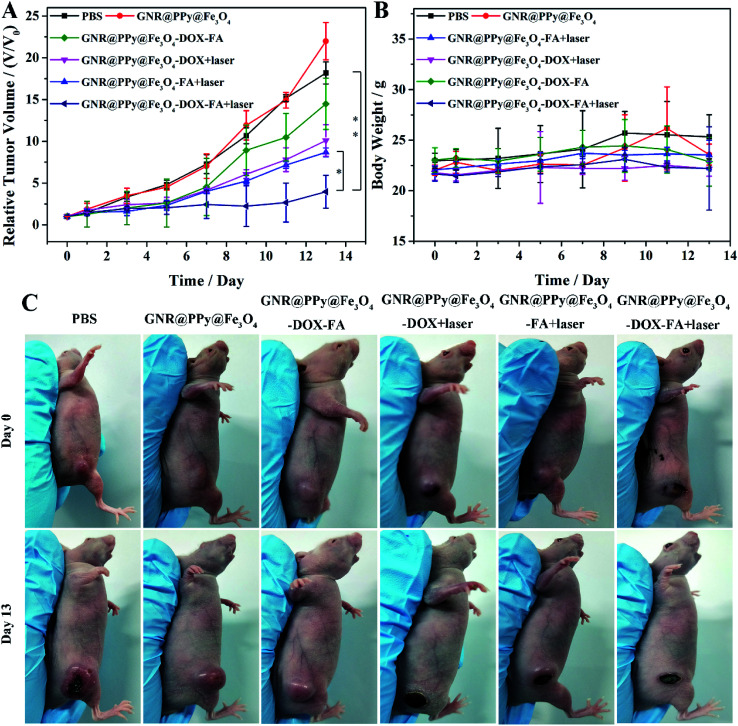
Integrating multimodal bioimaging and different therapies into one nanoplatform is a promising strategy for biomedical applications, but remains a great challenge. Herein, we have synthesized a biocompatible folic acid (FA) functionalized gold nanorod@polypyrrole@Fe3O4 (GNR@PPy@Fe3O4-FA) nanocomposite through a facile method. The conjugated FA has endowed the nanocomposite with the ability to recognize targeted cancer cells. Importantly, the nanocomposite has been successfully utilized for magnetic resonance (MR), computed tomography (CT) and photoacoustic (PA) multimodal imaging. Moreover, the GNR@PPy@Fe3O4-DOX nanocomposite shows pH-responsive chemotherapy and enables the integration of photothermal therapy and chemotherapy to achieve superior antitumor efficacy. The GNR@PPy@Fe3O4-DOX nanocomposites have a drug release of 23.64%, and the photothermal efficiency of the GNR@PPy@Fe3O4 nanocomposites reaches 51.46%. Cell viability decreases to 15.83% and 16.47% because of the combination of chemo-photothermal therapy effects. Moreover, the GNR@PPy@Fe3O4-DOX-FA nanocomposite could target cancer cells via folic acid and under a magnetic field. The in vivo multimodal imaging and chemo-photothermal therapy effects showed that the GNR@PPy@Fe3O4-DOX-FA nanocomposites are a good contrast and theranostic agent. Thus, this multifunctional nanocomposite could be a promising theranostic platform for cancer diagnosis and therapy.


Conflict of interest statement

The authors declare no competing financial interest.

Figures

Fig. 1
Fig. 1. Schematic illustration of synthetic route and chemo-photothermal therapy for GNR@PPy@Fe3O4-DOX-FA nanocomposites.
Fig. 2
Fig. 2. TEM images of (A) GNRs, (B) GNR@PPy nanoparticles, and (C) GNR@PPy@Fe3O4 nanocomposites.
Fig. 3
Fig. 3. (A) UV-Vis-NIR absorption spectra of GNRs (a), GNR@PPy (b), GNR@PPy@Fe3O4 (c), GNR@PPy@Fe3O4-DOX (d), GNR@PPy@Fe3O4-DOX-FA (e), DOX (f) and FA (g) nanocomposites, where the concentrations of these nanocomposites were about 40 μg mL−1; (B) the FTIR spectra of the prepared GNR@PPy (a), GNR@PPy@Fe3O4 (b), GNR@PPy@Fe3O4-DOX (c) and GNR@PPy@Fe3O4-DOX-FA (d) nanocomposites. The inset shows the characteristic peaks of GNR@PPy@Fe3O4-DOX-FA nanocomposites at 1646 cm−1, 1606 cm−1 and 1574 cm−1. Inset is the spectrum in the wavenumber range of 1550–1660 cm−1.
Fig. 4
Fig. 4. DOX release profile of GNR@PPy@Fe3O4-DOX nanocomposites at different pH values.
Fig. 5
Fig. 5. Photothermal effect of GNR@PPy@Fe3O4 nanocomposites. (A) Photothermal heating curves of GNR@PPy@Fe3O4 nanocomposites with different concentrations exposed to 808 nm laser irradiation for 10 min at a power of 2 W; (B) photothermal characteristics of 25 μg mL−1 GNR@PPy@Fe3O4 nanocomposites under 808 nm laser irradiation at various powers for 10 min.
Fig. 6
Fig. 6. (A) The temperature change curve of GNR@PPy@Fe3O4 aqueous solutions under 808 nm laser irradiation for 10 min; (B) the corresponding linear fitting of the irradiation time obtained from the cooling phase and −ln (θ); (C) evaluation of photothermal stability of GNR@PPy@Fe3O4 nanocomposites at a concentration of 25 μg mL−1 through five cycles of an on-and-off laser.
Fig. 7
Fig. 7. CLSM images of HepG2 cells incubated with 200 μg mL−1 GNR@PPy@Fe3O4-DOX and GNR@PPy@Fe3O4-DOX-FA nanocomposites for 4 h with or without an external magnetic field. Scale bar: 20 μm.
Fig. 8
Fig. 8. CLSM images of HepG2 cells incubated with 300 μg mL−1 GNR@PPy@Fe3O4-DOX-FA nanocomposites for 1, 4, 6 and 8 h. Scale bar: 50 μm.
Fig. 9
Fig. 9. Cell viabilities of HepG2 (A) and SMMC-7721 (C) cells treated with different concentrations of GNR@PPy@Fe3O4 and GNR@PPy@Fe3O4-FA nanocomposites. Viabilities of HepG2 (B) and SMMC-7721 (D) cells after incubation with different concentrations of GNR@PPy@Fe3O4-FA and GNR@PPy@Fe3O4-DOX-FA nanocomposites with or without 808 nm laser irradiation. The p values were calculated using multiple t tests (*p < 0.05, **p < 0.01, ***p < 0.001, ****p < 0.0001).
Fig. 10
Fig. 10. (A) CT images of GNR@PPy@Fe3O4-FA nanocomposites with different Au concentrations and their CT values (HU) as a function of Au concentration. (B) T2-weighted MRI photographs of GNR@PPy@Fe3O4-FA nanocomposites dispersed in water with different Fe concentrations and the transverse relaxation rate (1/T2) as a function of Fe concentration (C) PA images and corresponding PA intensity of GNR@PPy@Fe3O4-FA nanocomposites of different concentrations. The PA signal values at different concentrations were obtained by using an 808 nm laser.
Fig. 11
Fig. 11. In vivo CT images (A), MR images (B) and PA images (C) of GNR@PPy@Fe3O4-FA nanocomposites before and 24 h after injection.
Fig. 12
Fig. 12. (A) Tumor growth curves of different groups after various treatments. The p values were calculated using multiple t tests (*p < 0.05, **p < 0.01). (B) Body weights of mice in different treatment groups; (C) representative photographs of different groups of mice on days 0 and 13 after various treatments.

References

    1. Jo S. D. Ku S. H. Won Y. Y. Kim S. H. Kwon I. C. Theranostics. 2016;6:1362–1377. doi: 10.7150/thno.15335. - DOI - PMC - PubMed
    1. Muhamad N. Plengsuriyakarn T. Na-Bangchang K. Int. J. Nanomed. 2018;13:3921–3935. doi: 10.2147/IJN.S165210. - DOI - PMC - PubMed
    1. Shanmugam V. Selvakumar S. Yeh C. S. Chem. Soc. Rev. 2015;45:6254–6287. - PubMed
    1. Cheng L. Wang C. Liu Z. University S. Chin. J. Clin. Oncol. 2014;114:10869–10939. - PubMed
    1. Tang J. Zhang R. Guo M. Shao L. Liu Y. Zhao Y. Zhang S. Wu Y. Chen C. Biomaterials. 2018;167:205–215. doi: 10.1016/j.biomaterials.2018.03.015. - DOI - PubMed