. 2022 May 1;6(5):e2021GH000568.
doi: 10.1029/2021GH000568. eCollection 2022 May.

Lower COVID-19 Incidence in Low-Continentality West-Coast Areas of Europe

Affiliations

Lower COVID-19 Incidence in Low-Continentality West-Coast Areas of Europe

Karin Ebert et al. Geohealth. .

Abstract

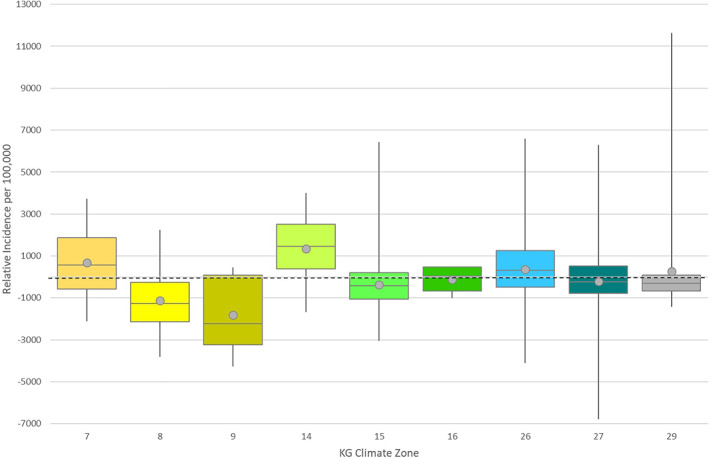
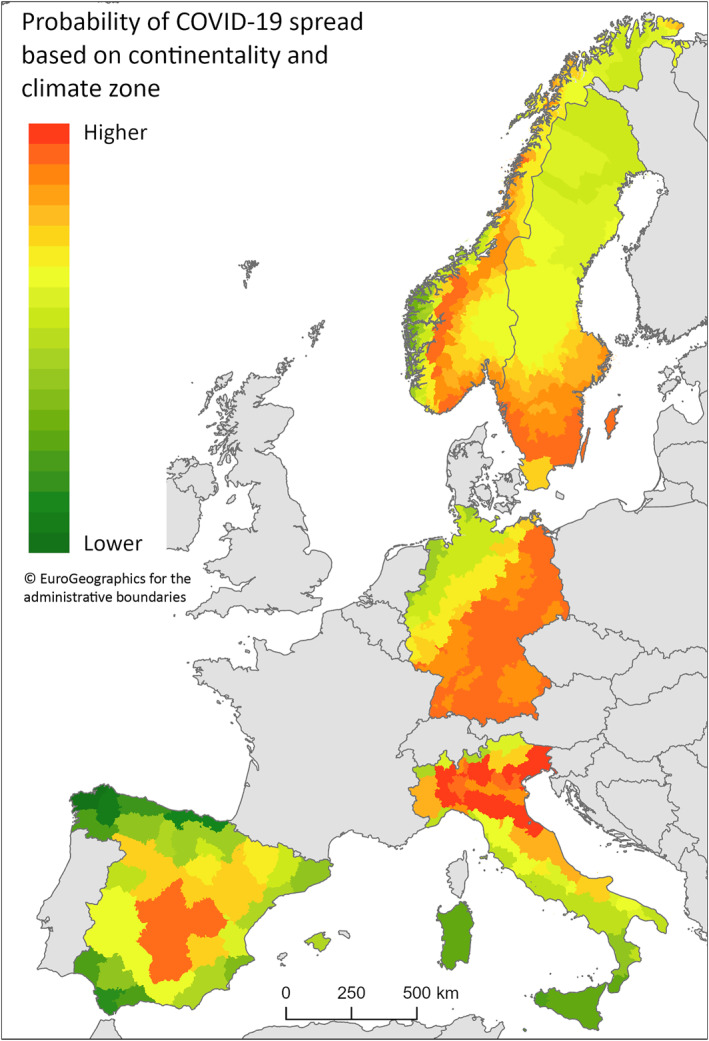
In March 2020, the first known cases of COVID-19 occurred in Europe. Subsequently, the pandemic developed a seasonal pattern. The incidence of COVID-19 comprises spatial heterogeneity and seasonal variations, with lower and/or shorter peaks resulting in lower total incidence and higher and/or longer peaks resulting higher total incidence. The reason behind this phenomena is still unclear. Unraveling factors that explain why certain places have higher versus lower total COVID-19 incidence can help health decision makers understand and plan for future waves of the pandemic. We test whether differences in the total incidence of COVID-19 within five European countries (Norway, Sweden, Germany, Italy, and Spain), correlate with two environmental factors: the Köppen-Geiger climate zones and the Continentality Index, while statistically controlling for crowding. Our results show that during the first 16 months of the pandemic (March 2020 to July 2021), climate zones with larger annual differences in temperature and annually distributed precipitation show a higher total incidence than climate zones with smaller differences in temperature and dry seasons. This coincides with lower continentality values. Total incidence increases with continentality, up to a Continentality Index value of 19, where a peak is reached in the semicontinental zone. Low continentality (high oceanic influence) appears to be a strong suppressing factor for COVID-19 spread. The incidence in our study area is lowest at open low continentality west coast areas.

Keywords: COVID‐19 pandemic; European west‐wind zone; GIS; climate zones; continentality.


Conflict of interest statement

The authors declare no conflicts of interest relevant to this study.

Figures

Figure 1
Figure 1
Total (cumulated) incidence of reported SARS‐CoV‐2 occurrence per 100,000 inhabitants for the five countries from the reports between March 2020 and mid‐July 2021. Based on data from the Norwegian Institute of Public Health (Folkhelseinstituttet), incidence calculated in VG (2021); the Public Health Agency of Sweden (FHM, 2020), the Robert‐Koch Institute, Germany (Robert Koch Institut, 2020); the Italian Ministry of Health (Ministero della Salute) (Github, 2021) (Italy) and CNECovid (2021) (Spain). The total incidence in this article is treated as a relative value. The relation between the reported cases, the death rate and the conducted tests differs spatially and temporally within and across countries and makes a meaningful country‐to‐country comparison of the total incidence challenging (cf. data for death rates, tests, etc. on https://ourworldindata.org/coronavirus).
Figure 2
Figure 2
Köppen‐Geiger climate zones for the largest part of the area per municipality (Norway, Sweden) or county (Germany, Italy, Spain). Based on Beck et al. (2018).
Figure 3
Figure 3
Mean Continentality Index per municipality (Norway and Sweden) or county (Germany, Italy, and Spain). Continentality Index raster data from Noce et al. (2020).
Figure 4
Figure 4
The relative distributions for each KG climate zone after regressing out the degree of urbanization and mean‐level differences between countries in overall incidence rates. Boxes represent the interquartile range (Q1 to Q3), the middle line in each box represents the median value, circles represent the mean, and whiskers represent the minimum and maximum values for each KG climate zone.
Figure 5
Figure 5
The figure graphs, the predicted linear, and quadratic relationships between the Continentality Index and residualized total incidence (residualized for the degree of urbanization for country‐specific analyses; residualized for country and the degree of urbanization for overall analyses). Lines for each country only include the Continentality Index values observed in that country. Thinner lines indicate that the linear trend for Norway and overall multicountry linear trend between total incidence and continentality was not statistically significantly different from zero and that the quadratic trends between total incidence and continentality for Germany, Norway, Sweden, and Spain were not statistically significantly different from zero. Model results are presented in Table S2 in Supporting Information S1.
Figure 6
Figure 6
The figure graphs the predicted linear relationships between the Continentality Index and residualized total incidence (residualized for country and the degree of urbanization). Lines for each climate zone only include the Continentality Index values observed in that climate zone. Thinner lines indicate that the linear trends for KG's 14, 15, and 16 were not statistically significantly different from zero.
Figure 7
Figure 7
The probability for the spread of COVID‐19, weighed after the statistical results of this paper, for the influence of continentality and climate zones. Thereby, other possible influencing parameters such as the degree of urbanization are excluded.

References

    1. Ahasan, R. , & Hossain, M. M. (2021). Leveraging GIS and spatial analysis for informed decision‐making in COVID‐19 pandemic. Health Policy and Technology, 10(1), 7–9. 10.1016/j.hlpt.2020.11.009 - DOI - PMC - PubMed
    1. Al‐Kindi, K. M. , Alkharusi, A. , Alshukaili, D. , Al Nasiri, N. , Al‐Awadhi, T. , Charabi, Y. , & El Kenawy, A. M. (2020). Spatiotemporal Assessment of COVID‐19 spread over Oman using GIS techniques. Earth Systems and Environment, 4, 797–811. 10.1007/s41748-020-00194-2 - DOI - PMC - PubMed
    1. Bashir, M. F. , Ma, B. , Komal, B. , Bashir, M. A. , Tan, D. , & Bashir, M. (2020). Correlation between climate indicators and COVID‐19 pandemic in New York, USA. The Science of the Total Environment, 728, 138835. 10.1016/j.scitotenv.2020.138835 - DOI - PMC - PubMed
    1. Beck, H. E. , Zimmermann, N. E. , McVicar, T. R. , Vergopolan, N. , Berg, A. , & Wood, E. F. (2018). Present and future Köppen‐Geiger climate classification maps at 1‐km resolution. Scientific Data, 5(1), 180214. [Dataset] 10.1038/sdata.2018.214 - DOI - PMC - PubMed
    1. Ben‐Ahmed, K. , Aoun, K. , Jeddi, F. , Ghrab, J. , El‐Aroudi, M. A. , & Bouratbine, A. (2009). Visceral leishmaniasis in Tunisia: Spatial distribution and association with climatic factors. The American Journal of Tropical Medicine and Hygiene, 81(1), 40–45. 10.4269/ajtmh.81.1.40 - DOI - PubMed

LinkOut - more resources