

Electrochemical sensory detection of Sus scrofa mtDNA for food adulteration using hybrid ferrocenylnaphthalene diimide intercalator as a hybridization indicator
- PMID: 35516939
- PMCID: PMC9055540
- DOI: 10.1039/d0ra03585h
Electrochemical sensory detection of Sus scrofa mtDNA for food adulteration using hybrid ferrocenylnaphthalene diimide intercalator as a hybridization indicator
Abstract
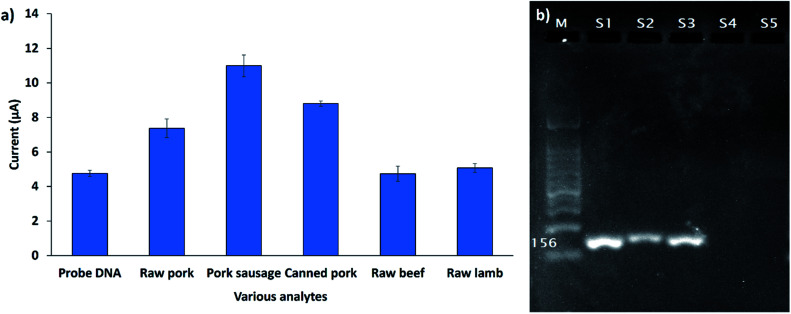
In this study, an electrochemical DNA biosensor was developed based on the fabrication of silicon nanowires/platinum nanoparticles (SiNWs/PtNPs) on a screen-printed carbon electrode (SPCE) for the detection of Sus scrofa mitochondrial DNA (mtDNA) in food utilizing a new hybrid indicator, ferrocenylnaphthalene diimide (FND). The morphology and elemental composition of the SiNWs/PtNPs-modified SPCE was analyzed by field emission scanning electron microscopy (FESEM) combined with energy dispersive X-ray spectroscopy (EDX). Cyclic voltammetry (CV) was used to study the electrical contact between the PtNPs and the screen-printed working electrode through SiNWs, while electrochemical impedance spectroscopy (EIS) was used to measure the charge transfer resistance of the modified electrode. The results clearly showed that the SiNWs/PtNPs were successfully coated onto the electrode and the effective surface area for the SiNWs/PtNPs-modified SPCE was increased 16.8 times as compared with that of the bare SPCE. Differential pulse voltammetry used for the detection of porcine DNA with FND as an intercalator confirmed its specific binding to the double-stranded DNA (dsDNA) sequences. The developed biosensor showed a selective response towards complementary target DNA and was able to distinguish non-complementary and mismatched DNA oligonucleotides. The SiNWs/PtNPs-modified SPCE that was fortified with DNA hybridization demonstrated good linearity in the range of 3 × 10⁻⁹ M to 3 × 10⁻⁵ M (R 2 = 0.96) with a detection limit of 2.4 × 10⁻⁹ M. A cross-reactivity study against various types of meat and processed food showed good reliability for porcine samples.
This journal is © The Royal Society of Chemistry.
Conflict of interest statement
There are no conflicts to declare.
Figures


Similar articles
-
Rapid and sensitive detection of box turtles using an electrochemical DNA biosensor based on a gold/graphene nanocomposite.Beilstein J Nanotechnol. 2022 Dec 6;13:1458-1472. doi: 10.3762/bjnano.13.120. eCollection 2022. Beilstein J Nanotechnol. 2022. PMID: 36570614 Free PMC article.
-
The utilization of SiNWs/AuNPs-modified indium tin oxide (ITO) in fabrication of electrochemical DNA sensor.Mater Sci Eng C Mater Biol Appl. 2014 Dec;45:270-6. doi: 10.1016/j.msec.2014.09.010. Epub 2014 Sep 16. Mater Sci Eng C Mater Biol Appl. 2014. PMID: 25491829
-
The Optimization of a Label-Free Electrochemical DNA Biosensor for Detection of Sus scrofa mtDNA as Food Adulterations.Biosensors (Basel). 2023 Jun 15;13(6):657. doi: 10.3390/bios13060657. Biosensors (Basel). 2023. PMID: 37367022 Free PMC article.
-
Electrochemical Detection of Arsenite Using a Silica Nanoparticles-Modified Screen-Printed Carbon Electrode.Materials (Basel). 2020 Jul 16;13(14):3168. doi: 10.3390/ma13143168. Materials (Basel). 2020. PMID: 32708531 Free PMC article.
-
Electrochemical DNA detection using supramolecular interactions.Anal Sci. 2012;28(7):643-9. doi: 10.2116/analsci.28.643. Anal Sci. 2012. PMID: 22790364 Review.
Cited by
-
Experimentally designed chemometric models for the assay of toxic adulterants in turmeric powder.RSC Adv. 2022 Mar 23;12(15):9087-9094. doi: 10.1039/d2ra00697a. eCollection 2022 Mar 21. RSC Adv. 2022. PMID: 35424884 Free PMC article.
-
Strategies for the preparation of non-amplified and amplified genomic dengue gene samples for electrochemical DNA biosensing applications.RSC Adv. 2021 Dec 20;12(1):1-10. doi: 10.1039/d1ra06753b. eCollection 2021 Dec 20. RSC Adv. 2021. PMID: 35424522 Free PMC article.
-
Hexaferrocenium tri[hexa(isothiocyanato)iron(III)] trihydroxonium complex as a new DNA intercalator for electrochemical DNA biosensor.Sci Rep. 2021 Apr 12;11(1):7883. doi: 10.1038/s41598-021-86939-z. Sci Rep. 2021. PMID: 33846405 Free PMC article.
-
Rapid and sensitive detection of box turtles using an electrochemical DNA biosensor based on a gold/graphene nanocomposite.Beilstein J Nanotechnol. 2022 Dec 6;13:1458-1472. doi: 10.3762/bjnano.13.120. eCollection 2022. Beilstein J Nanotechnol. 2022. PMID: 36570614 Free PMC article.
-
Highly sensitive pork meat detection using copper(ii) tetraaza complex by electrochemical biosensor.RSC Adv. 2023 Jan 11;13(3):2104-2114. doi: 10.1039/d2ra05701h. eCollection 2023 Jan 6. RSC Adv. 2023. PMID: 36712615 Free PMC article.
References
-
- Man Y. C. Aida A. Raha A. Son R. Food Control. 2007;18:885–889. doi: 10.1016/j.foodcont.2006.05.004. - DOI
LinkOut - more resources
Full Text Sources