. 2019 Apr 16;9(21):12085-12096.
doi: 10.1039/c9ra01275c. eCollection 2019 Apr 12.

Solvatochromism and pH effect on the emission of a triphenylimidazole-phenylacrylonitrile derivative: experimental and DFT studies

Affiliations

Solvatochromism and pH effect on the emission of a triphenylimidazole-phenylacrylonitrile derivative: experimental and DFT studies

Karnambaram Anandhan et al. RSC Adv. .

Abstract

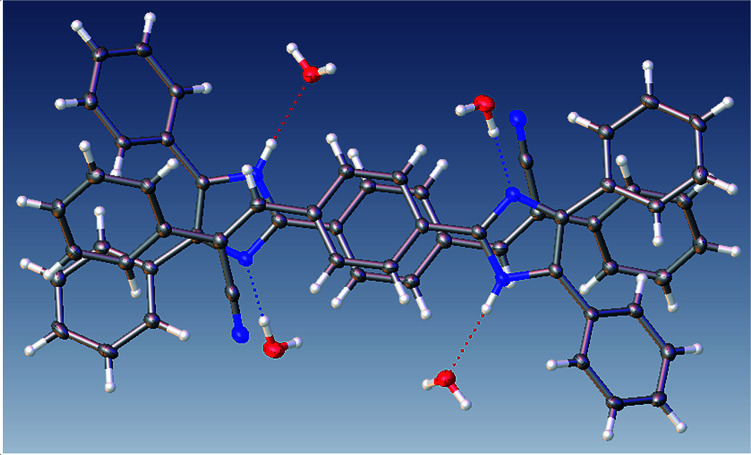
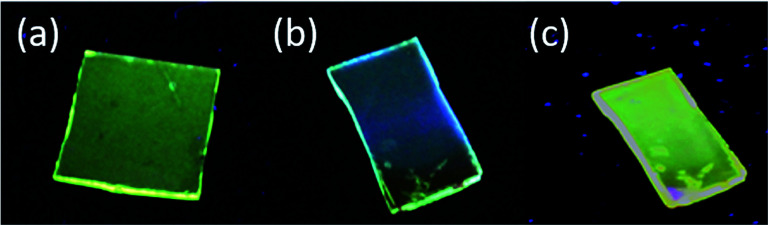
In this work, a study of the photophysical properties in different solvents and at different pH values of a luminogenic compound with a donor-π-acceptor (D-π-A) structure was carried out. The compound (Z)-3-(4-(4,5-diphenyl-1H-imidazol-2-yl)phenyl)-2-phenylacrylonitrile (2) was synthesized and characterized by SCXRD, FT-IR, 1H NMR, 13C NMR, EIMS, UV-Vis absorption and fluorescence. The SCXRD characterization reveals a monoclinic system, P21/c, with Z = 4 and an imidazole core having hydrogen bonding with respect to water molecules present in the asymmetric unit. It leads to a strong π-π-interaction in the solid state. The fluorescence λ max emission of the powder and thin film was observed at 563 nm and 540 nm respectively. Several degrees of positive solvatochromic fluorescence were observed due to different molecular conformations in various solvents. When the pH of the compound was changed with HCl or NaOH, a shift in the wavelength of emission was observed in a reversible manner. At pH 2, the λ max of emission was at 541 nm whereas at pH 14 there were two emissions at 561 nm and 671 nm. Due to their good emission in the solid state, compound 2 was tested as an emitting layer in OLEDs; the devices showed an acceptable performance with a luminance average of 450 cd m-2. The band gap was analyzed by optical absorption, cyclic voltammetry measurement and DFT calculations.


Conflict of interest statement

There are no conflicts to declare.

Figures

Scheme 1
Scheme 1. (a) Numbering of the 2,4,5-triphenyl-1H-imidazole, (b) imidazole fused with α-cyanostilbene.
Scheme 2
Scheme 2. Synthesis of compound 2 (a) NH4OAc/HOAc/4-formyl benzaldehyde, reflux; (b) cat. KOH/MeOH, phenylacetonitrile, reflux.
Fig. 1
Fig. 1. ORTEP X-ray crystal structure of compound 2 and 50% of thermal ellipsoids.
Fig. 2
Fig. 2. Intermolecular hydrogen bond interactions between the lattice solvent molecules and compound 2.
Fig. 3
Fig. 3. Perspective view of the structures showing the strong π⋯π interactions of compound 2.
Fig. 4
Fig. 4. Intermolecular motif formed interaction shown with a bond distance (Å). Chain motif and atoms involved in chain motif formation are shown in ball stick form.
Fig. 5
Fig. 5. Absorption spectrum of compound 2 with various solvents.
Fig. 6
Fig. 6. (a) Solvatochromism (b) normalized emission spectra of compound 2 in several solvents.
Fig. 7
Fig. 7. (a) Plausible mechanism of protonation and deprotonation of compound 2 with different pH. (b) Halochromic effect of the compound 2.
Fig. 8
Fig. 8. (a) Absorption (b) emission spectra of compound 2 at different pH.
Fig. 9
Fig. 9. (a) Absorption and (b) emission spectra of compound 2 in the powder and thin film.
Fig. 10
Fig. 10. (a) and (b) AFM image of the compound 2 thin film by solution process and (c) morphology image of evaporated films.
Fig. 11
Fig. 11. (a) Thin film (TF) as reference (b) exposed to HNO3 (c) exposed TF after 4 days.
Fig. 12
Fig. 12. Absorption and emission spectra of compound 2 in thin film (TF).
Fig. 13
Fig. 13. (a) Photoluminescence and electroluminescence spectra of thin film and OLEDs respectively. (b) Electrical characteristics JV for OLEDs (the inset shows an OLED picture).
Fig. 14
Fig. 14. The HOMO–LUMO diagram of the compound 2 in neutral, acidic and basic condition.

References

    1. Schill H. Nizamov S. Bottanelli F. Bierwagen J. Belov V. N. Hell S. W. Chem.–Eur. J. 2013;19:16556–16565. doi: 10.1002/chem.201302037. - DOI - PubMed
    1. Huang D. Zhao T. Xu W. Yang T. Cremer P. S. Anal. Chem. 2013;85:10240–10248. doi: 10.1021/ac401955t. - DOI - PubMed
    1. Liu X.-D. Xu Y. Sun R. Xu Y.-J. Lu J.-M. Ge J.-F. Analyst. 2013;138:6542–6550. doi: 10.1039/C3AN01033C. - DOI - PubMed
    1. Gryn’ova G. Corminboeuf C. J. Phys. Chem. Lett. 2018;9:2298–2304. doi: 10.1021/acs.jpclett.8b00980. - DOI - PubMed
    1. Sasaki S. Drummen G. P. C. Konishi G. J. Mater. Chem. C. 2016;4:2731–2743. doi: 10.1039/C5TC03933A. - DOI