

Model-based temperature control for improving lactic acid production from glycerol
- PMID: 35517023
- PMCID: PMC9063304
- DOI: 10.1039/c9ra01323g
Model-based temperature control for improving lactic acid production from glycerol
Abstract
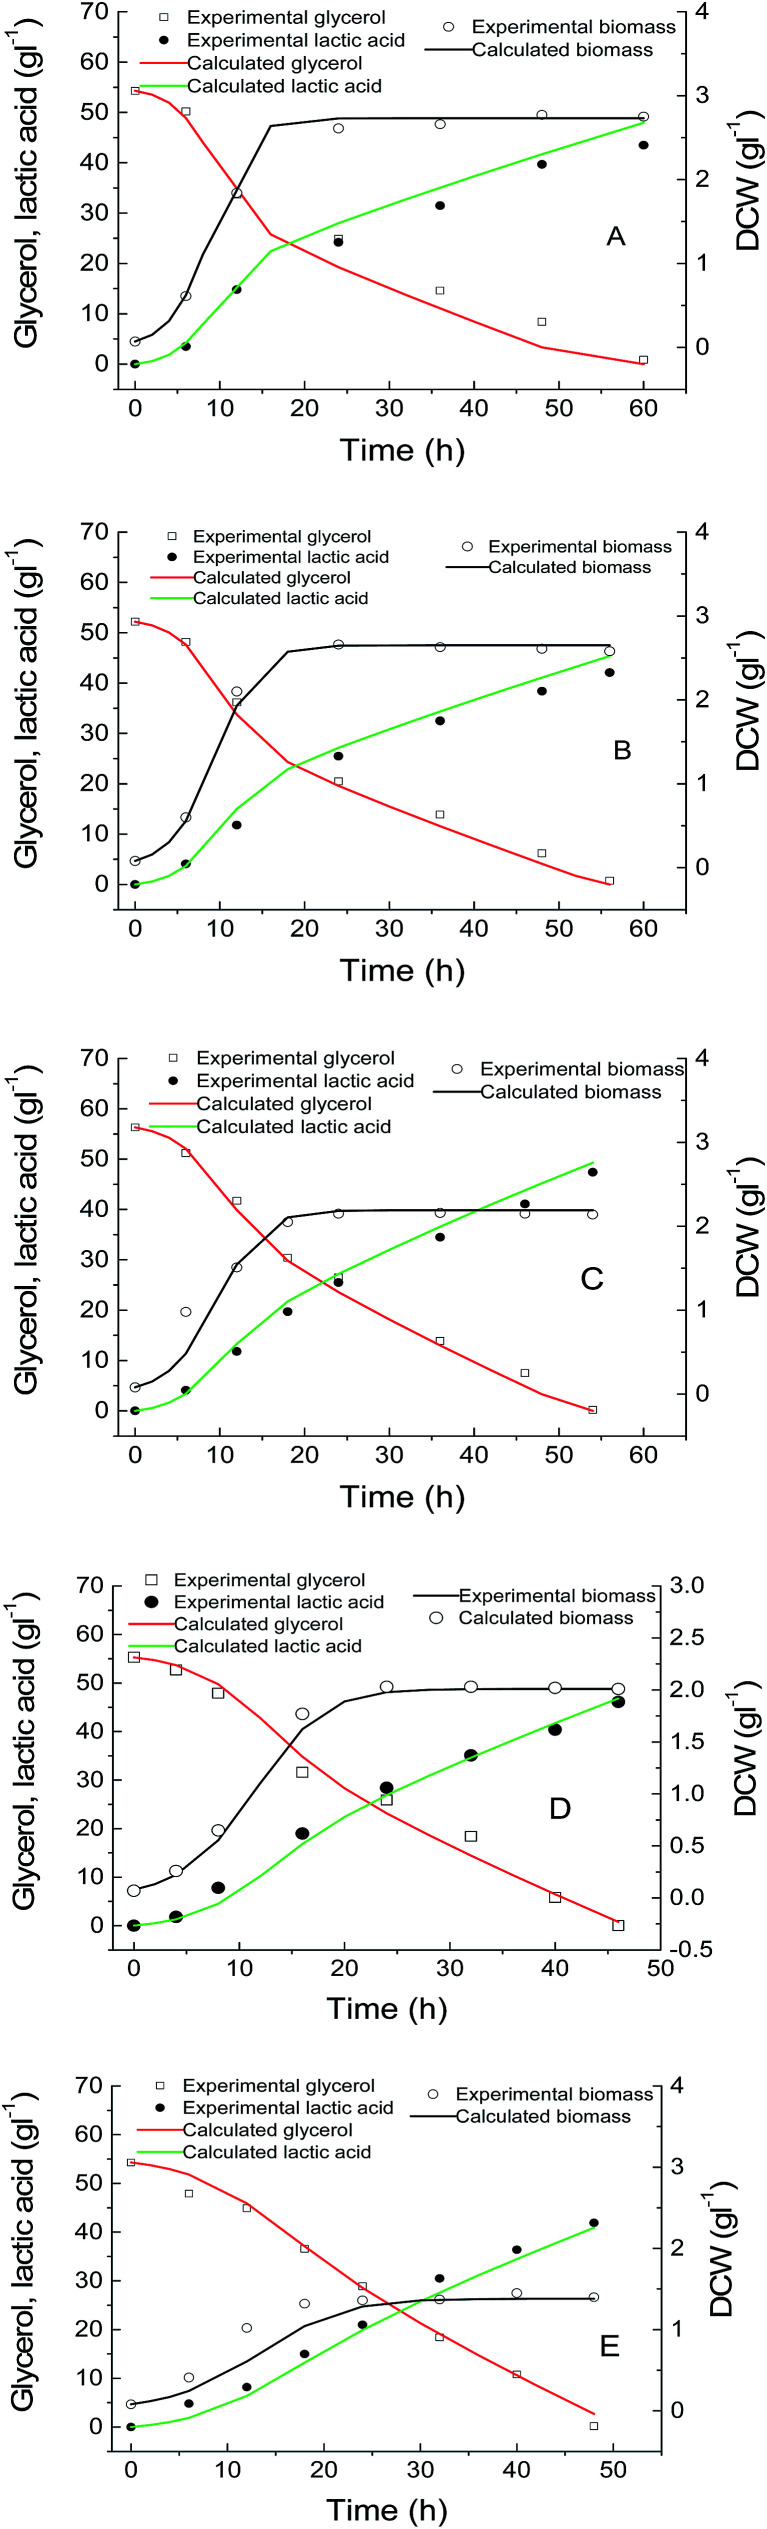
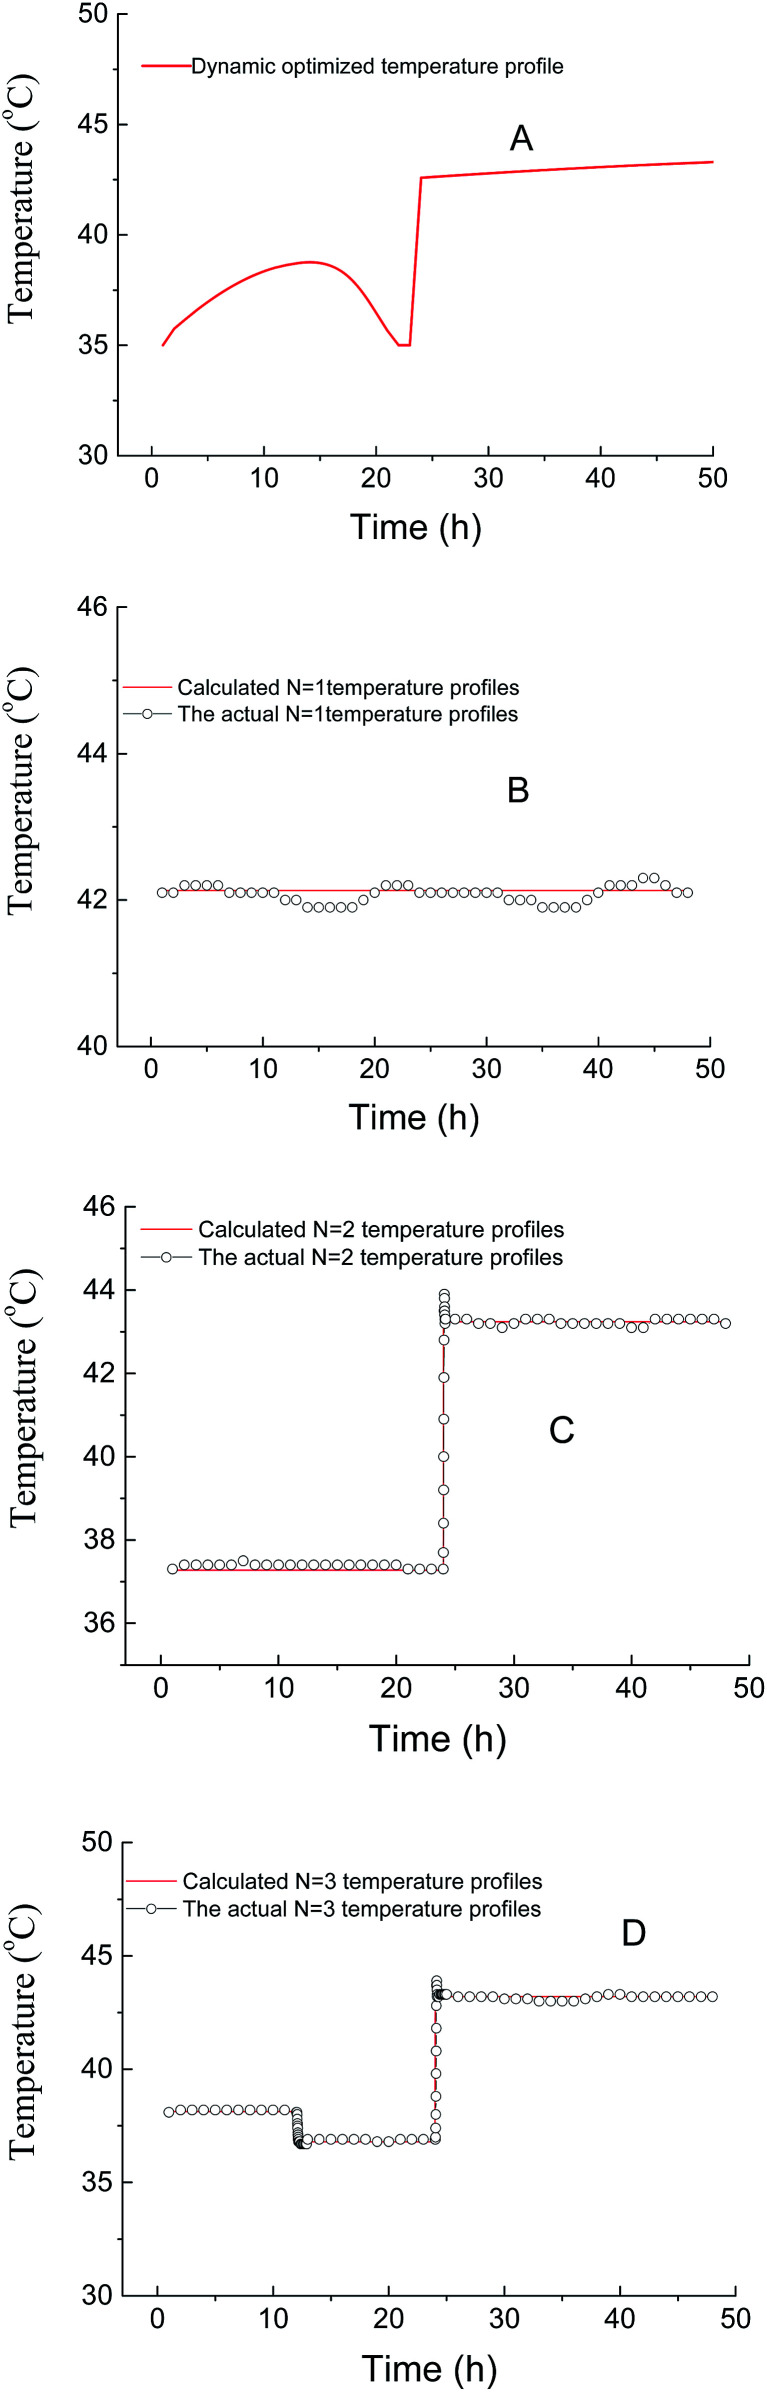
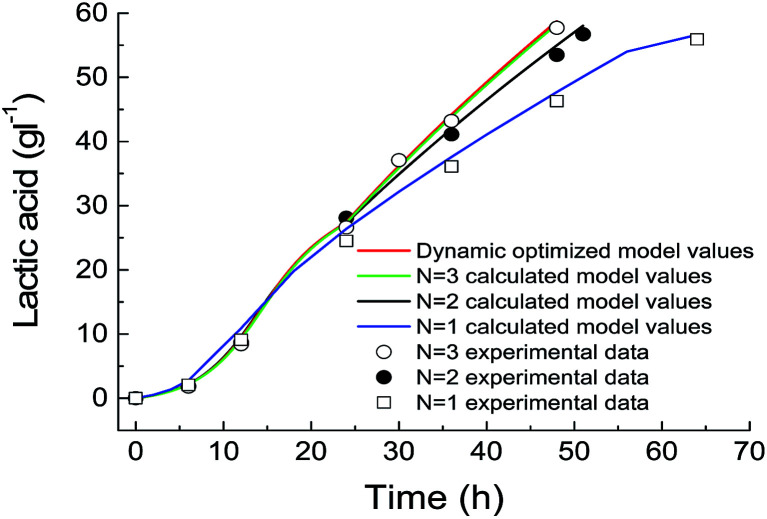
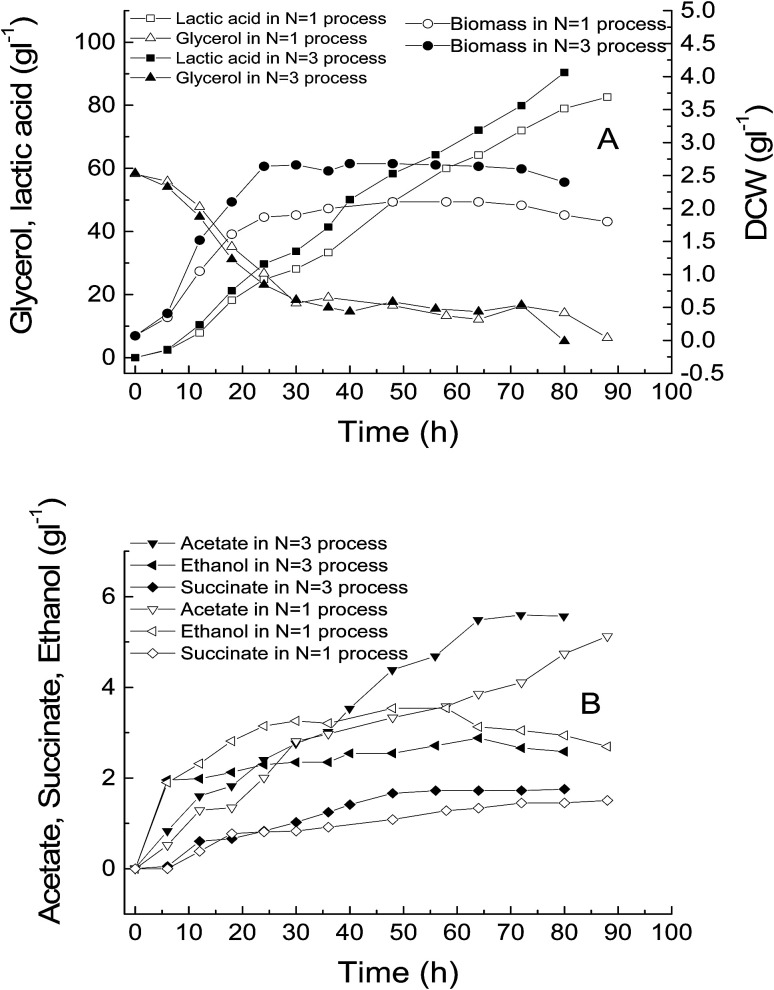
To maximize the final lactic acid productivity and concentration, temperature control was optimized using a mathematical modelling approach. A kinetic model, including cell growth, product formation and substrate consumption equations, was proposed to describe the lactic acid production process by Escherichia coli AC-521 with glycerol as the substrate. By constructing four functions, the temperature effect was introduced on the fermentation process, where four parameters (X max, μ max, Y ps and β) were observed to be significantly affected by the temperature. For the convenience of application, the temperature control strategies were simplified by dividing the whole fermentation process into several units. In each unit, the temperature was controlled constantly. Based on the model, the optimal temperature for each unit was determined to maximize the final lactate productivity. This temperature control strategy can be effectively applied in batch and fed-batch cultures, and the verified experimental evaluation showed a good correlation with the model data. Under improved temperature control conditions, a maximal lactic acid concentration of 90.4 g L-1 was obtained after 80 h of fed-batch fermentation, giving a productivity of 1.13 g L-1 h-1, which is 1.2 times more than that in the conventional constant temperature during the cultivation course.
This journal is © The Royal Society of Chemistry.
Conflict of interest statement
There are no conflicts to declare.
Figures
References
-
- Abdel-Rahman M. A. Tashiro Y. Zendo T. Sakai K. Sonomoto K. RSC Adv. 2016;6:17659–17668. doi: 10.1039/C5RA27579B. - DOI
-
- Visser D., Van Breugel J., De Bruijn J. M. and A'Campo P., US Pat., 8211675B2, 2012
LinkOut - more resources
Full Text Sources
Research Materials