. 2019 Apr 15;9(21):11707-11717.
doi: 10.1039/c9ra00252a. eCollection 2019 Apr 12.

iTRAQ based proteomic analysis of PM2.5 induced lung damage

Affiliations

iTRAQ based proteomic analysis of PM2.5 induced lung damage

Zhaohui Xue et al. RSC Adv. .

Abstract

Haze pollution has become a global environmental problem, subsequently affecting air quality, climate, economy and human health. Notably, PM2.5 (particulate matter with an aerodynamic diameter less than 2.5 micrometers) significantly accounts for a variety of adverse health effects, in particular pulmonary diseases such as asthma and lung cancer. Clinical diagnosis and medical treatment of the lung damage caused by PM2.5 still remain significant challenges due to the lack of specific biomarkers and pathways. Here, we established a rat model of nonsurgical intratracheal instillation to investigate PM2.5 exposure and employed iTRAQ based analytical technique and bioinformatics tools to identify putative biomarkers and pathways. We identified 163 differentially expressed proteins (DEPs). Among these proteins, we screened six DEPs (HMOX1, MP2K5, XRCC1 E9PTZ7, KNT2 and A1AG) as the putative biomarkers, with significant differentially expressed levels (percentage increment > 140%). Pathway analysis indicated that calcium signaling, MAPK and PI3K/AKT might be involved in the process of PM2.5-induced lung damage. Western-blotting was used to verify DEPs in the AEC-II cell model for early diagnosis. In summary, our data can serve as fundamental research clues for further studies of PM2.5-induced toxicity in the lungs.


Conflict of interest statement

The authors declare no competing financial interests.

Figures
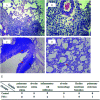
Fig. 1
Fig. 1. Pulmonary histological evaluation and pathological scores. The lung tissues of control group ((A and B) 10× magnification and 40× magnification, respectively) and PM2.5 group ((C and D) 10× magnification and 40× magnification, respectively) were stained with haematoxylin–eosin (H&E). Compared with the control group, there were a large number of inflammatory cells around bronchus in PM2.5 group (as shown in the black arrow); the structure of bronchial columnar epithelial cells was filled with inflammatory cells (as shown in the red arrow); the monolayer structure of the local alveolar epithelial cell wall disappeared. Epithelial cells thickened, and they aggregated into clusters of three to four layers (as shown in the yellow arrow); partial alveolar atrophied and collapsed (as shown in the brick red arrow); partial were compensatory hypertrophy (as shown in the green arrow). (E) Pathological scores.
Fig. 2
Fig. 2. Construction of experimental model and iTRAQ based proteomics system. The process included five clusters: PM2.5 exposure, peptide fractions from lung protein, iTRAQ/LC-MS analysis, data analysis and bioinformation analysis, and Western blotting.
Fig. 3
Fig. 3. Analysis of DEPs and screening of biomarkers. The red lines represented significant DEPs with PI > 140%.
Fig. 4
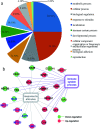
Fig. 4. (a) Classification of molecular functions of DEPs. (b) DEPs enriched in response to stimulus and immune system process. Red balls represented down-regulated proteins and green balls referred to up-regulated proteins; blue words meant proteins exclusively enriched in response to stimulus, brown words were proteins exclusively enriched in immune system response, and black words denoted proteins enriched in both biology processes.
Fig. 5
Fig. 5. Protein–protein interaction networks of DEPs. Disconnected nodes were hided in the network. The small notes represented proteins whose 3D structure were unknown, while large notes represented proteins whose 3D structure were known or predicted. Edges represented protein–protein associations in the high confidence of 0.7.
Fig. 6
Fig. 6. An integrated pathway of PM2.5-induced lung damage.
Fig. 7
Fig. 7. The expression of significant DEPs in AEC-II cells exposed to PM2.5.

Similar articles

Cited by

References

    1. Huang R. J. Zhang Y. Bozzetti C. Ho K. F. Cao J. J. Han Y. Daellenbach K. R. Slowik J. G. Platt S. M. Canonaco F. Zotter P. Wolf R. Pieber S. M. Bruns E. A. Crippa M. Ciarelli G. Piazzalunga A. Schwikowski M. Abbaszade G. Schnelle-Kreis J. Zimmermann R. An Z. Szidat S. Baltensperger U. El Haddad I. Prevot A. S. Nature. 2014;514:218–222. doi: 10.1038/nature13774. - DOI - PubMed
    1. Wong C. M. Tsang H. Lai H. K. Thomas G. N. Lam K. B. Chan K. P. Zheng Q. S. Ayres J. G. Lee S. Y. Lam T. H. Thach T. Q. Cancer Epidemiol., Biomarkers Prev. 2016;25:839–845. doi: 10.1158/1055-9965.EPI-15-0626. - DOI - PMC - PubMed
    1. Sancini G. Farina F. Battaglia C. Cifola I. Mangano E. Mantecca P. Camatini M. Palestini P. PLoS One. 2014;9:e109685. doi: 10.1371/journal.pone.0109685. - DOI - PMC - PubMed
    1. Chen R. Zhao Z. Kan H. Am. J. Respir. Crit. Care Med. 2013;188:1170–1171. doi: 10.1164/rccm.201304-0678LE. - DOI - PubMed
    1. Anderson J. O. Thundiyil J. G. Stolbach A. J. Med. Toxicol. 2012;8:166–175. doi: 10.1007/s13181-011-0203-1. - DOI - PMC - PubMed