. 2020 May 14;10(31):18418-18422.
doi: 10.1039/d0ra02509g. eCollection 2020 May 10.

Unravelling the true MOF-5 luminescence

Affiliations

Unravelling the true MOF-5 luminescence

Vincent Villemot et al. RSC Adv. .

Abstract

Highly pure millimeter-sized MOF-5 single crystals were synthesized and characterized. Photoluminescence (PL) spectroscopy and time-correlated single photon counting (TCSPC) demonstrate a solvent-guest dependency of MOF-5 emission and its ligand-centred nature. These results allow measuring the true MOF-5 luminescence free of solvent at a wavelength of 355 nm, a significantly lower wavelength than previously published. MOF-5 emission was also evaluated with different solvents and various degrees of water intake, explaining previously published observations. Comparison between lifetimes shows the fluorophore stabilization within the frameworks and demonstrates the progressive influence of the Zn4O subunits on the fluorescence during hydration. Overall, this work highlights the necessity to obtain phase-pure material, especially when moisture sensitivity can play a role, before ascribing electronic transitions. This study is a rigorous new take on the iconic MOF-5 and on its photoluminescence properties.


Conflict of interest statement

There are no conflicts to declare.

Figures

Fig. 1
Fig. 1. Powder X-ray diffraction data. Intensities are normalized to the maximum. The pattern for MOF-5 was calculated from single crystal structural data (see ESI†). Inset is a picture of single crystals.
Fig. 2
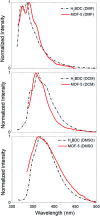
Fig. 2. Steady-state emission spectra for H2BDC (dashed) and MOF-5 (solid), respectively dissolved and soaked, in DMF (top), DCM/CH2Cl2 (middle) and DMSO (bottom) under 300 nm excitation.
Fig. 3
Fig. 3. Comparison of excitation (dashed) and emission (solid) spectra for an activated MOF-5 (black) and solid H2BDC (blue).
Fig. 4
Fig. 4. (a) Adsorption and insertion of water in MOF. Print with permission from Siegel et al. from ref. 23 (b) PL emission data and (c) decay time of pure single crystal impregnated with DMF (black), partially hydrated single crystal impregnated with DMF (red) and fully hydrated (blue) fitting see ESI, Fig. S6.
Fig. 5
Fig. 5. Emission spectra of MOF-5 during time (top) and associate normalized intensity (bottom). Dashed lines represents different contributions.

References

    1. Silva P. Vilela S. M. F. Tomé J. P. C. Almeida Paz F. A. Chem. Soc. Rev. 2015;44:6774–6803. doi: 10.1039/C5CS00307E. - DOI - PubMed
    1. Allendorf M. D. Bauer C. A. Bhakta R. K. Houk R. J. T. Chem. Soc. Rev. 2009;38:1330–1352. doi: 10.1039/B802352M. - DOI - PubMed
    1. Cui Y. Yue Y. Qian G. Chen B. Chem. Rev. 2012;112:1126–1162. doi: 10.1021/cr200101d. - DOI - PubMed
    1. Lin R. B. Liu S. Y. Ye J. W. Li X. Y. Zhang J. P. Adv. Sci. 2016;3:1–20. - PubMed
    1. Lustig W. P. Mukherjee S. Rudd N. D. Desai A. V. Li J. Ghosh S. K. Chem. Soc. Rev. 2017;46:3242–3285. doi: 10.1039/C6CS00930A. - DOI - PubMed