

An inkjet-printed polysaccharide matrix for on-chip sample preparation in point-of-care cell counting chambers
- PMID: 35517228
- PMCID: PMC9053629
- DOI: 10.1039/d0ra01645d
An inkjet-printed polysaccharide matrix for on-chip sample preparation in point-of-care cell counting chambers
Abstract
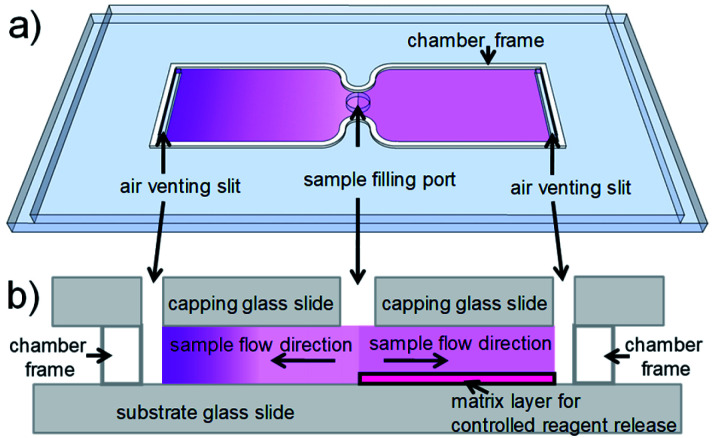
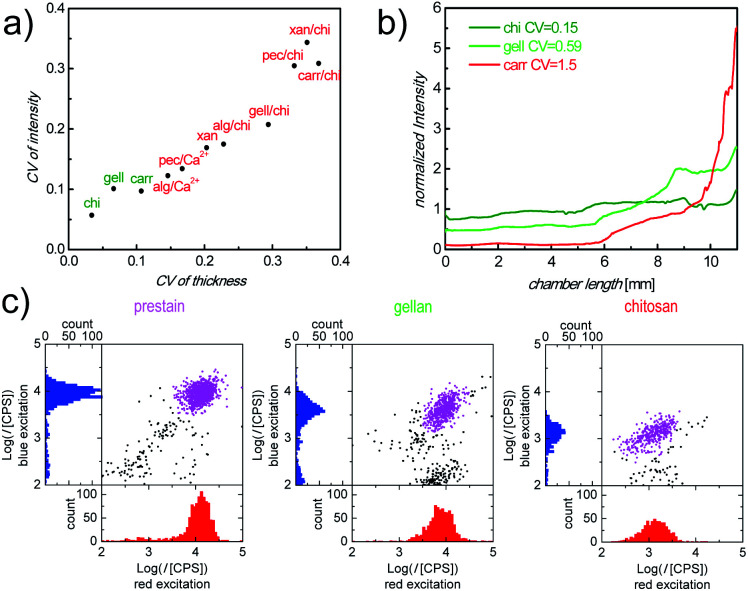
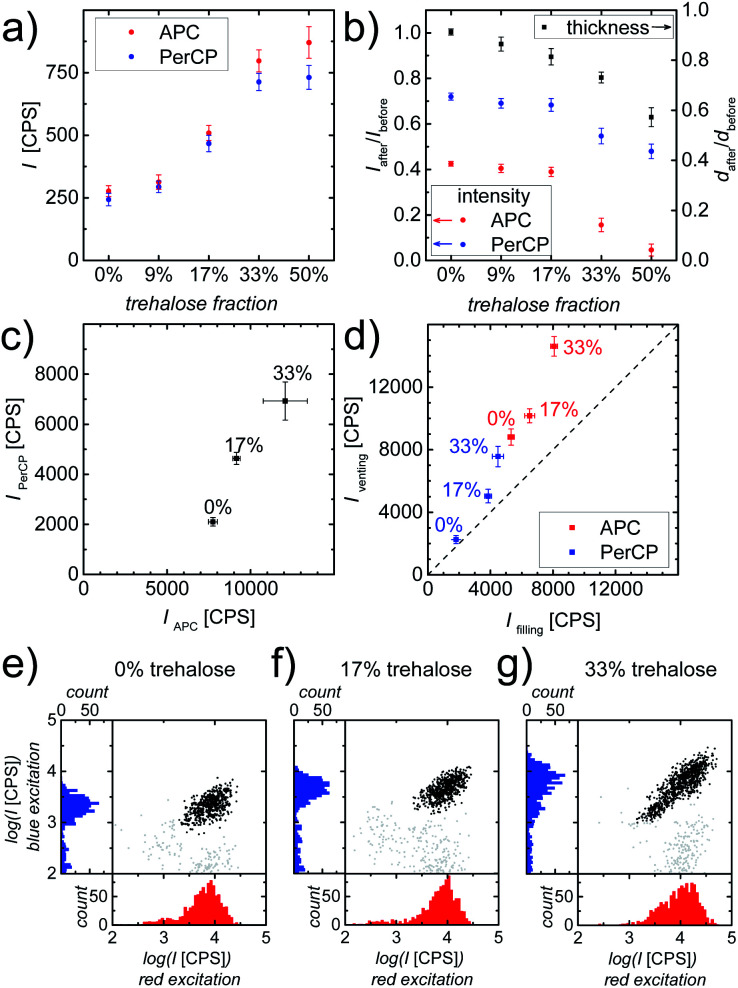
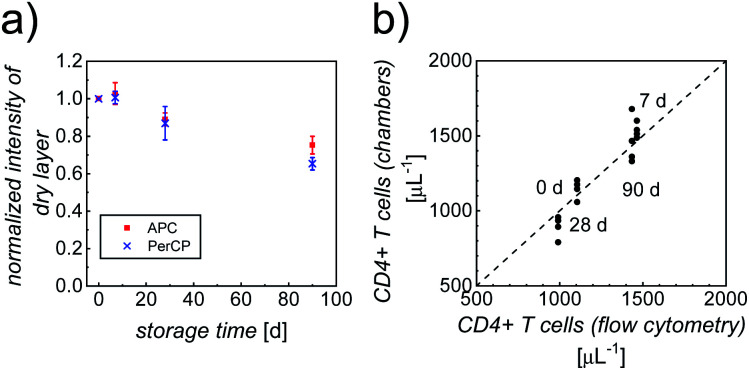
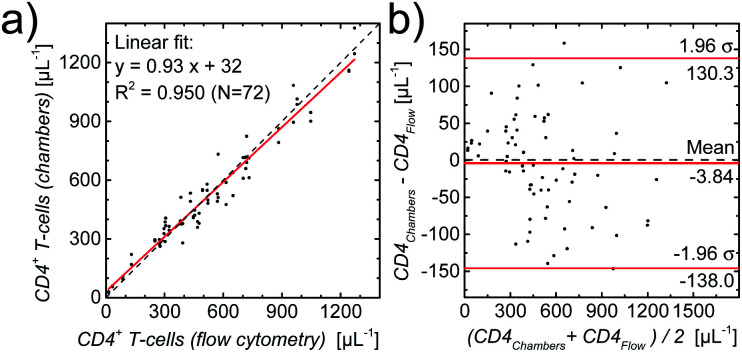
On-chip sample preparation in self-contained microfluidic devices is a key element to realize simple, low-cost, yet reliable in vitro diagnostics that can be carried out at the point-of-care (POC) with minimal training requirements by unskilled users. To address this largely unmet POC medical need, we have developed an optimized polysaccharide matrix containing the reagents which substantially improves our fully printed POC CD4 counting chambers for the monitoring of HIV patients. The simply designed counting chambers allow for capillary-driven filling with unprocessed whole blood. We carefully tailored a gellan/trehalose matrix for deposition by inkjet printing, which preserves the viability of immunostains during a shelf life of at least 3 months and enables controlled antibody release for intense and homogeneous immunofluorescent cell staining throughout the complete 60 mm2 image area within 30 min. Excellent agreement between CD4 counts obtained from our fully printed CD4 counting chambers and the gold standard, flow cytometry, is demonstrated using samples both from healthy donors and HIV-infected patients.
This journal is © The Royal Society of Chemistry.
Conflict of interest statement
There are no conflicts to declare.
Figures
Similar articles
-
All-printed cell counting chambers with on-chip sample preparation for point-of-care CD4 counting.Biosens Bioelectron. 2018 Oct 15;117:659-668. doi: 10.1016/j.bios.2018.07.002. Epub 2018 Jul 3. Biosens Bioelectron. 2018. PMID: 30005387
-
Temperature-Switch Cytometry-Releasing Antibody on Demand from Inkjet-Printed Gelatin for On-Chip Immunostaining.ACS Appl Mater Interfaces. 2016 Oct 19;8(41):27539-27545. doi: 10.1021/acsami.6b09206. Epub 2016 Oct 11. ACS Appl Mater Interfaces. 2016. PMID: 27684590
-
A smart preparation strategy for point-of-care cellular counting of trace volumes of human blood.Anal Bioanal Chem. 2019 May;411(13):2767-2780. doi: 10.1007/s00216-019-01738-w. Epub 2019 Apr 11. Anal Bioanal Chem. 2019. PMID: 30976894
-
Thirty-five years of CD4 T-cell counting in HIV infection: From flow cytometry in the lab to point-of-care testing in the field.Cytometry B Clin Cytom. 2017 Nov;92(6):437-444. doi: 10.1002/cyto.b.21400. Epub 2016 Aug 3. Cytometry B Clin Cytom. 2017. PMID: 27406947 Review.
-
Point of care testing: The impact of nanotechnology.Biosens Bioelectron. 2017 Jan 15;87:373-387. doi: 10.1016/j.bios.2016.08.084. Epub 2016 Aug 26. Biosens Bioelectron. 2017. PMID: 27589400 Review.
Cited by
-
Printed Electrochemical Biosensors: Opportunities and Metrological Challenges.Biosensors (Basel). 2020 Nov 4;10(11):166. doi: 10.3390/bios10110166. Biosensors (Basel). 2020. PMID: 33158129 Free PMC article. Review.
-
Microfluidic Assays for CD4 T Lymphocyte Counting: A Review.Biosensors (Basel). 2025 Jan 9;15(1):33. doi: 10.3390/bios15010033. Biosensors (Basel). 2025. PMID: 39852084 Free PMC article. Review.
References
LinkOut - more resources
Full Text Sources
Research Materials