. 2019 Feb 21;9(11):6299-6309.
doi: 10.1039/c8ra09476d. eCollection 2019 Feb 18.

Cobalt ferrite supported on reduced graphene oxide as a T 2 contrast agent for magnetic resonance imaging

Affiliations

Cobalt ferrite supported on reduced graphene oxide as a T 2 contrast agent for magnetic resonance imaging

Amira Alazmi et al. RSC Adv. .

Abstract

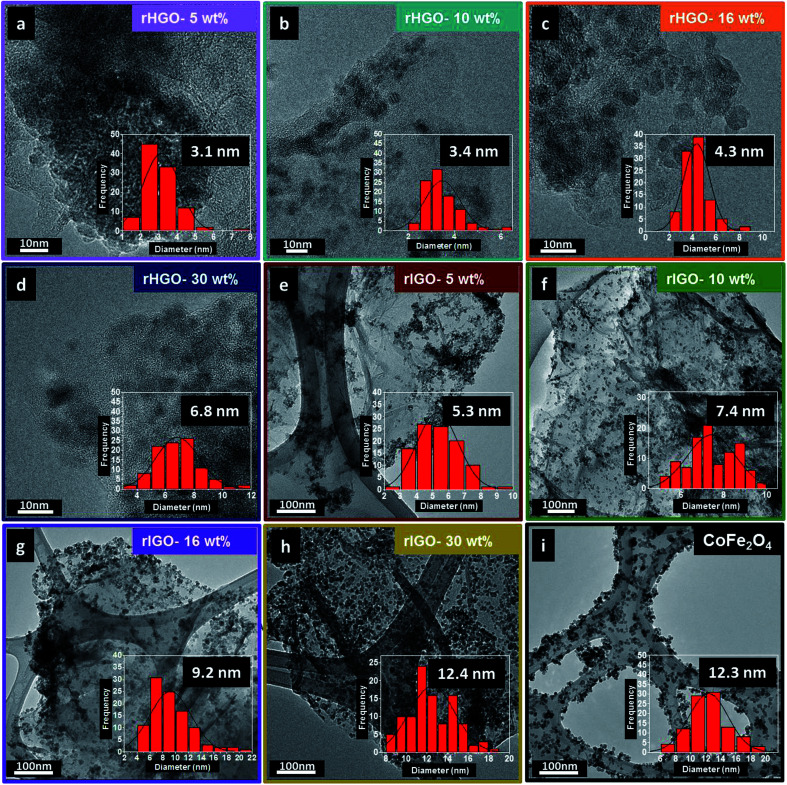
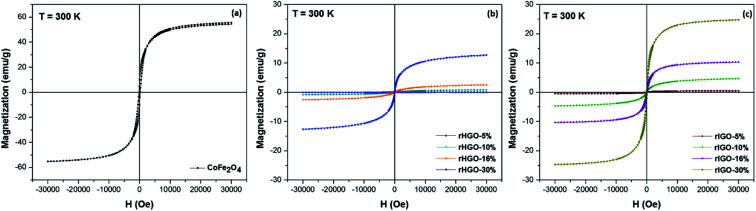
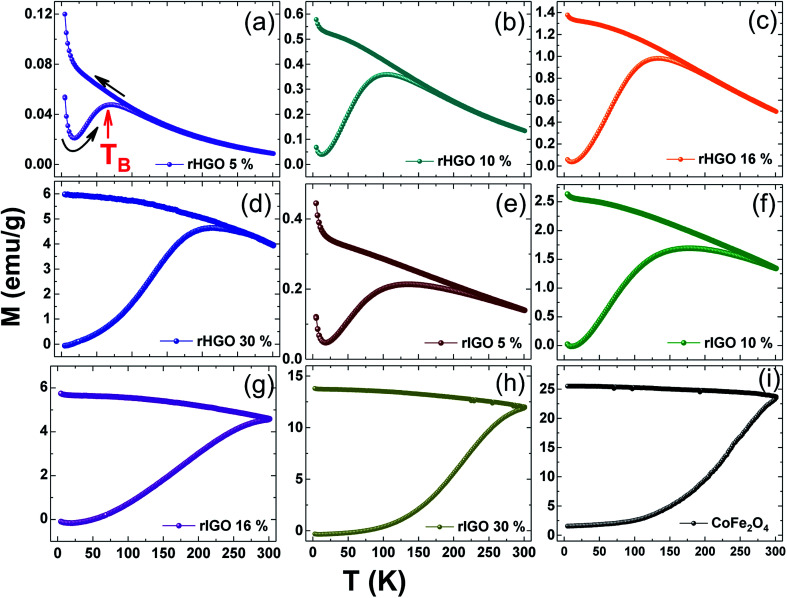
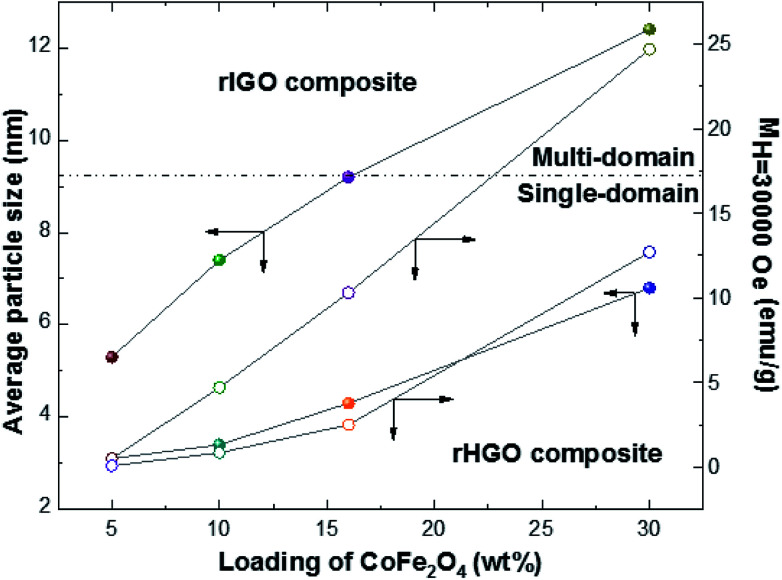
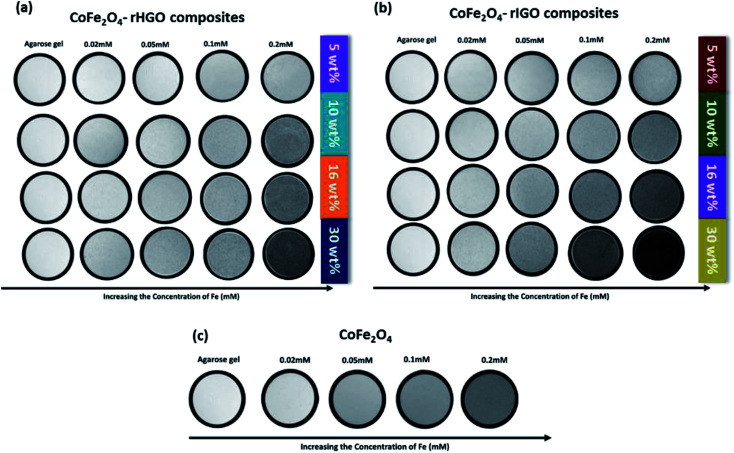
Nanoscaled spinel-structured ferrites bear promise as next-generation contrast agents for magnetic resonance imaging. However, the small size of the particles commonly leads to colloidal instability under physiological conditions. To circumvent this problem, supports onto which the dispersed nanoparticles can be anchored have been proposed. Amongst these, flakes of graphene have shown interesting performance but it remains unknown if and how their surface texture and chemistry affect the magnetic properties and relaxation time (T 2) of the ferrite nanoparticles. Here, it is shown that the type of graphene oxide (GO) precursor, used to make composites of cobalt ferrite (CoFe2O4) and reduced GO, influences greatly not just the T 2 but also the average size, dispersion and magnetic behaviour of the grafted nanoparticles. Accordingly, and without compromising biocompatibility, a judicious choice of the initial GO precursor can result in the doubling of the proton relaxivity rate in this system.


Conflict of interest statement

There are no conflicts of interest to declare.

Figures

Fig. 1
Fig. 1. (a–d) TEM images (inset: NPs size distribution histogram and average size) of the CoFe2O4–rHGO composites with 5, 10, 16 and 30 wt% CoFe2O4, respectively; (e–h) TEM images (inset: NPs size distribution histogram and average size) of the CoFe2O4–rIGO composites with 5, 10, 16 and 30 wt% CoFe2O4, respectively; (i) TEM image (inset: NPs size distribution histogram and average size) of the pure CoFe2O4 NPs.
Fig. 2
Fig. 2. XRD patterns for: (a) CoFe2O4, rHGO and CoFe2O4–rHGO composites with 5, 10, 16 and 30 wt% CoFe2O4; (b) CoFe2O4, rIGO and CoFe2O4–rIGO composites with 5, 10, 16 and 30 wt% CoFe2O4.
Fig. 3
Fig. 3. Raman spectra for: (a) rHGO, CoFe2O4 and CoFe2O4–rHGO composites with 5, 10, 16 and 30 wt% CoFe2O4, respectively; (b) rIGO, CoFe2O4 and CoFe2O4–rIGO composites with 5, 10, 16 and 30 wt% CoFe2O4, respectively.
Fig. 4
Fig. 4. FTIR spectra for: (a) rHGO, CoFe2O4 and CoFe2O4–rHGO composites with 5, 10, 16 and 30 wt% CoFe2O4; (b) rIGO, CoFe2O4 and CoFe2O4–rIGO composites with 5, 10, 16 and 30 wt% CoFe2O4.
Fig. 5
Fig. 5. Field-dependent magnetic hysteresis loops for: (a) pure CoFe2O4 NPs, (b) CoFe2O4–rHGO composites and (c) CoFe2O4–rIGO composites, measured at room temperature.
Fig. 6
Fig. 6. The ZFC–FC curves for the rHGO (panels a–d) and rIGO (panels e–h) composites with increased loading of CoFe2O4. Reference data for the pure CoFe2O4 powder are shown in panel (i). The average blocking temperature (TB), which is the peak of the ZFC curve, is indicated by an arrow in panel (a).
Fig. 7
Fig. 7. Plot correlating the CoFe2O4 loading with the average particle size and respective magnetization at 30 000 Oe for the two rGOs studied.
Fig. 8
Fig. 8. T 2-weighted MRI images for: (a) CoFe2O4–rHGO composites, (b) CoFe2O4–rIGO composites and (c) pure CoFe2O4, at different Fe concentrations.
Fig. 9
Fig. 9. Plot of the T2 relaxation rate r2(1/T2) for: (a) pure CoFe2O4, (b) CoFe2O4–rHGO composites and (c) CoFe2O4–rIGO composites, suspended in aqueous solution at different Fe concentrations.
Fig. 10
Fig. 10. (a) Plot of the relaxivity coefficient r2vs. Ms, i.e., magnetic saturation. (b) Plot of the relaxivity coefficient vs. magnetic nanostructure size.
Fig. 11
Fig. 11. Viability of HeLa cells in different concentrations of: (a) rHGO/rIGO and (b) CoFe2O4–rHGO/CoFe2O4–rIGO.

Similar articles

Cited by

References

    1. Kolhatkar A. G. Jamison A. C. Litvinov D. Willson R. C. Lee T. R. Tuning the magnetic properties of nanoparticles. Int. J. Mol. Sci. 2013;14(8):15977–16009. doi: 10.3390/ijms140815977. - DOI - PMC - PubMed
    1. Sun C. Lee J. S. H. Zhang M. Magnetic nanoparticles in MR imaging and drug delivery. Adv. Drug Delivery Rev. 2008;60(11):1252–1265. doi: 10.1016/j.addr.2008.03.018. - DOI - PMC - PubMed
    1. Lu A. H. Salabas E. e. L. Schüth F. Magnetic nanoparticles: synthesis, protection, functionalization, and application. Angew. Chem., Int. Ed. 2007;46(8):1222–1244. doi: 10.1002/anie.200602866. - DOI - PubMed
    1. Georgiadou V. Kokotidou C. Le Droumaguet B. Carbonnier B. Choli-Papadopoulou T. Dendrinou-Samara C. Oleylamine as a beneficial agent for the synthesis of CoFe2O4 nanoparticles with potential biomedical uses. Dalton Trans. 2014;43(17):6377–6388. doi: 10.1039/C3DT53179A. - DOI - PubMed
    1. Choi K.-H. Nam K. C. Malkinski L. Choi E. H. Jung J.-S. Park B. J. Size-Dependent Photodynamic Anticancer Activity of Biocompatible Multifunctional Magnetic Submicron Particles in Prostate Cancer Cells. Molecules. 2016;21(9):1187. doi: 10.3390/molecules21091187. - DOI - PMC - PubMed