

A novel critical control point and chemical marker identification method for the multi-step process control of herbal medicines via NMR spectroscopy and chemometrics
- PMID: 35517368
- PMCID: PMC9054755
- DOI: 10.1039/d0ra03172k
A novel critical control point and chemical marker identification method for the multi-step process control of herbal medicines via NMR spectroscopy and chemometrics
Abstract
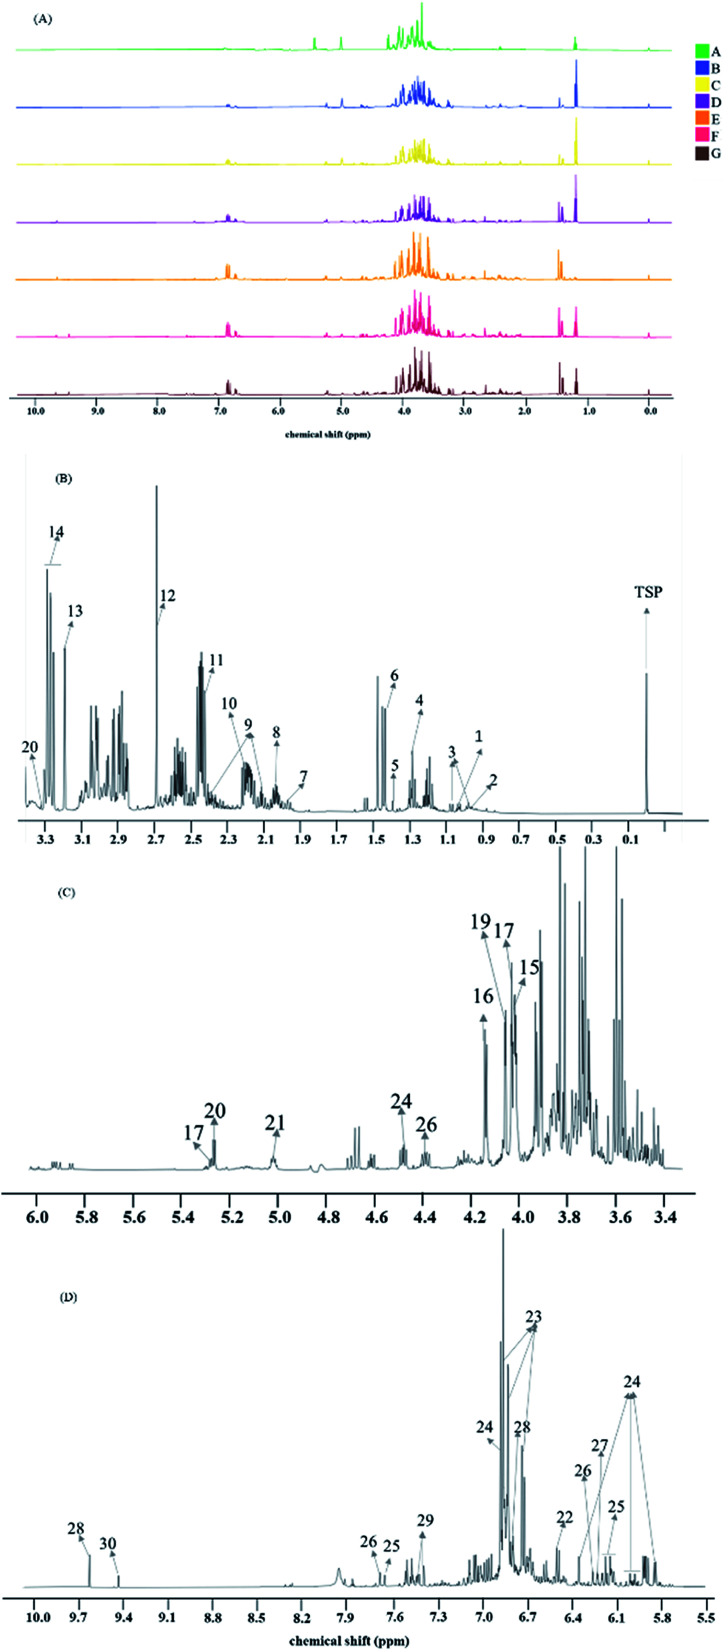
Herbal medicines have played a vital role in maintaining the health of the world population in the past thousands of years, and have proved to be an effective therapy. It is important to improve our understanding of the effects of the multi-step processing in herbal medicines on the chemical changes to ensure product quality. A proton nuclear paramagnetic resonance (1H NMR)-based evaluation strategy was developed for an efficient process variation exploration and diversified metabolite identification. In this study, 48 process intermediates from 6 commercial batches of the multi-step manufacturing chain of Danshen processing were obtained. Hierarchical classification analysis (HCA) tree based on 1H NMR spectra clustered the samples according to the processing steps, which indicates that 1H NMR has the potential capability for critical control point identification based on its adequate information of the organic compounds. Then, principal component analysis (PCA) and orthogonal partial least squares-discriminant analysis (OPLS-DA) were applied to distinguish the major metabolite differences between the intermediates before and after the critical control point. In this case, the alkali-isolation and acid-dissolution method was recognized as the most critical process in the multi-step chain of Danshen extract manufacturing. Potential metabolites with the larger amplitude of variation and contributing the most to the discrimination were found to be potential quality markers by S-plot, including several previously undetected amino acids. The results in this study are consistent with previous research studies and reference experiments conducted with other analytical tools. Taken together, they prove that 1H NMR with chemometrics is a very effective process quality control tool to provide comprehensive information on the chemical changes during the processing of herbal medicines, and help with the identification of critical control points and potential critical quality markers.
This journal is © The Royal Society of Chemistry.
Conflict of interest statement
There are no conflicts to declare.
Figures


Similar articles
-
Characterisation and critical processes identification for production of herbal preparations using 1H-NMR and chemometrics: A case study of Trichosanthis Pericarpium injection.Phytochem Anal. 2024 Aug;35(6):1294-1308. doi: 10.1002/pca.3363. Epub 2024 May 2. Phytochem Anal. 2024. PMID: 38693889
-
Quality Evaluation and Chemical Markers Screening of Salvia miltiorrhiza Bge. (Danshen) Based on HPLC Fingerprints and HPLC-MSn Coupled with Chemometrics.Molecules. 2017 Mar 17;22(3):478. doi: 10.3390/molecules22030478. Molecules. 2017. PMID: 28304365 Free PMC article.
-
Multi-component metabolic classification of commercial feverfew preparations via high-field 1H-NMR spectroscopy and chemometrics.Planta Med. 2002 Aug;68(8):734-8. doi: 10.1055/s-2002-33793. Planta Med. 2002. PMID: 12221598
-
Quality assessment of medicinal herbs and their extracts: Criteria and prerequisites for consistent safety and efficacy of herbal medicines.Epilepsy Behav. 2015 Nov;52(Pt B):363-71. doi: 10.1016/j.yebeh.2015.03.004. Epub 2015 Apr 18. Epilepsy Behav. 2015. PMID: 25899015 Review.
-
Chemometrics: A new scenario in herbal drug standardization.J Pharm Anal. 2014 Aug;4(4):223-233. doi: 10.1016/j.jpha.2013.12.001. Epub 2014 Jan 1. J Pharm Anal. 2014. PMID: 29403886 Free PMC article. Review.
Cited by
-
Investigation of antibacterial mode of action of ω-aminoalkoxylxanthones by NMR-based metabolomics and molecular docking.Metabolomics. 2024 Dec 4;21(1):2. doi: 10.1007/s11306-024-02197-w. Metabolomics. 2024. PMID: 39636460
-
Trends in artificial intelligence, machine learning, and chemometrics applied to chemical data.Anal Sci Adv. 2021 Feb 2;2(3-4):128-141. doi: 10.1002/ansa.202000162. eCollection 2021 Apr. Anal Sci Adv. 2021. PMID: 38716450 Free PMC article. Review.
References
LinkOut - more resources
Full Text Sources
Miscellaneous