. 2022 Mar 28;13(7):2086-2104.
doi: 10.7150/jca.68673. eCollection 2022.

Comprehensive analysis of expression signature and immune microenvironment signature of biomarker Endothelin Receptor Type A in stomach adenocarcinoma

Affiliations

Comprehensive analysis of expression signature and immune microenvironment signature of biomarker Endothelin Receptor Type A in stomach adenocarcinoma

Zhengguang Wang et al. J Cancer. .

Abstract

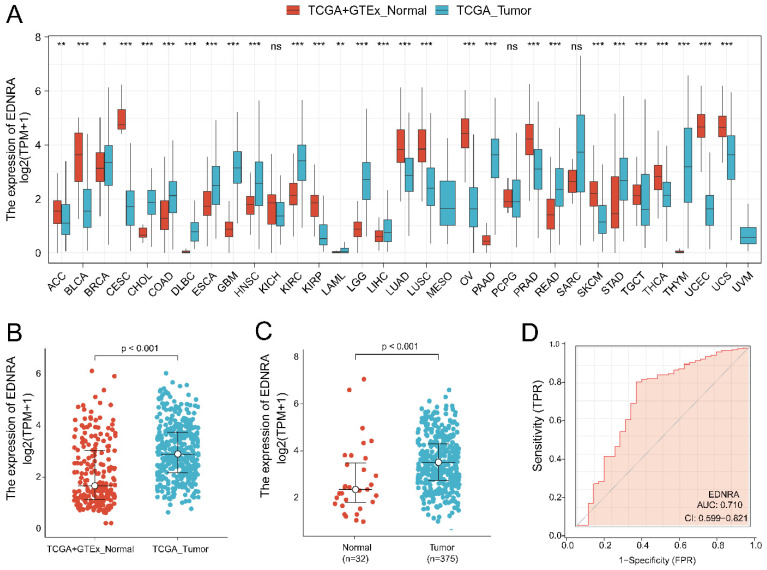
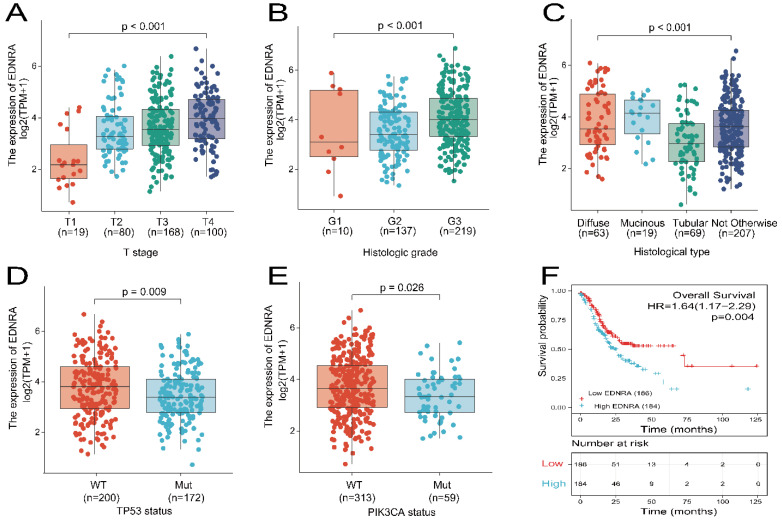
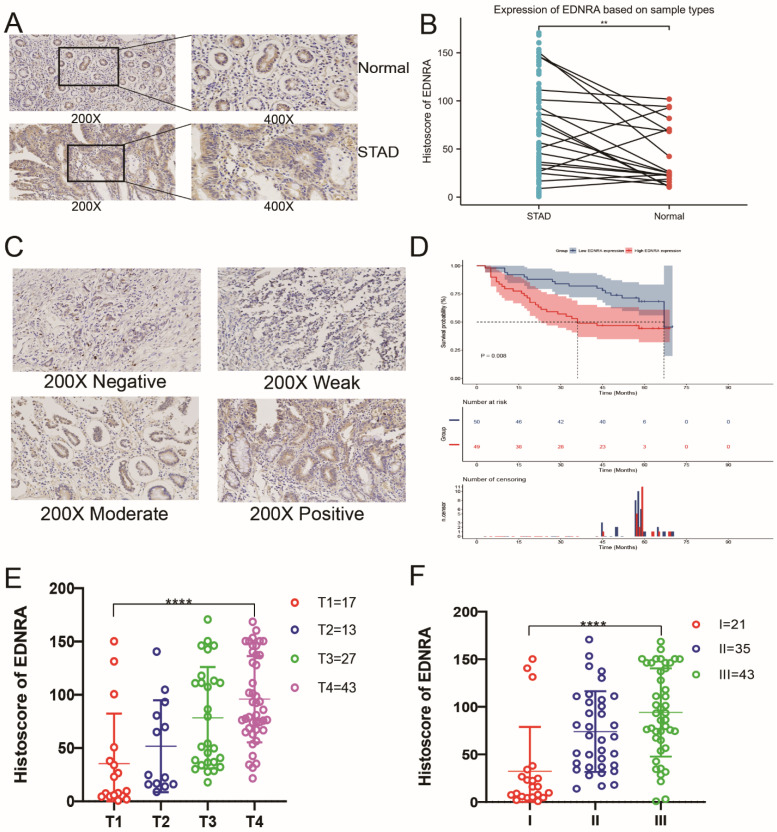
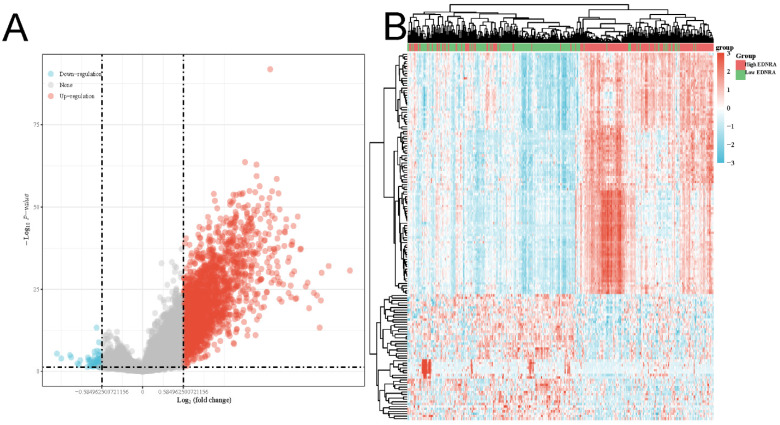
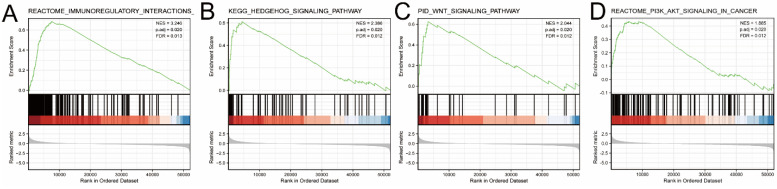
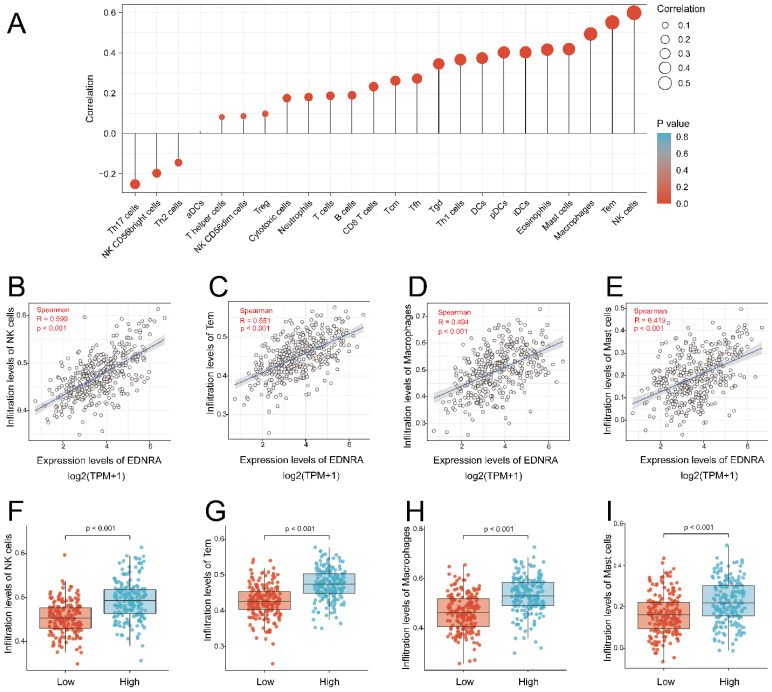
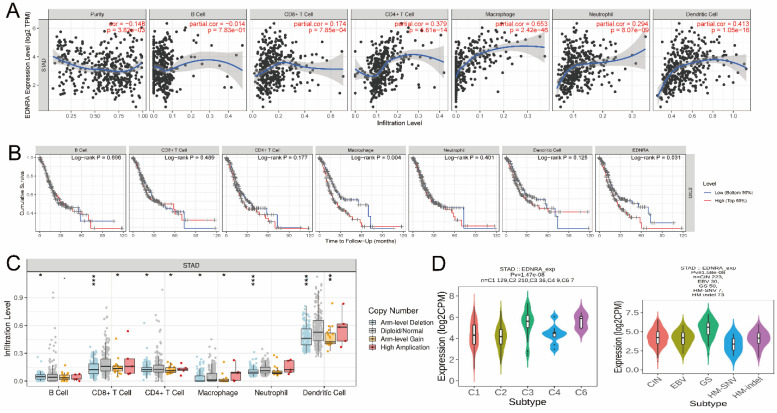
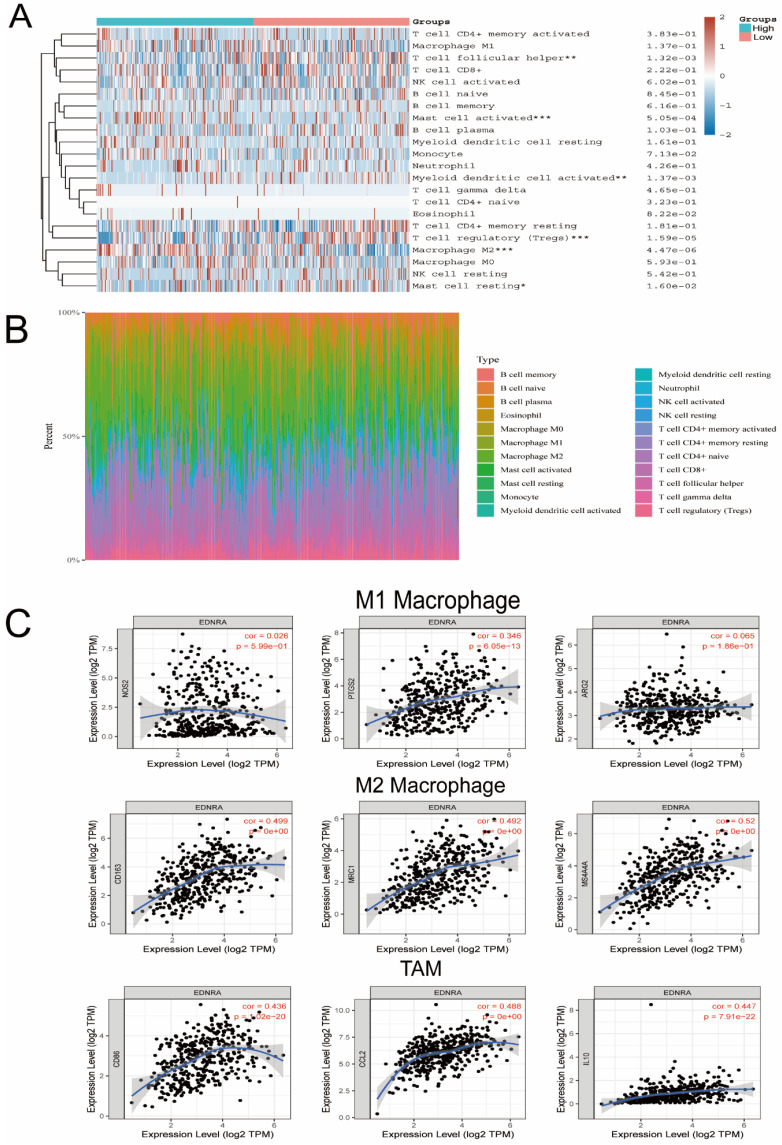
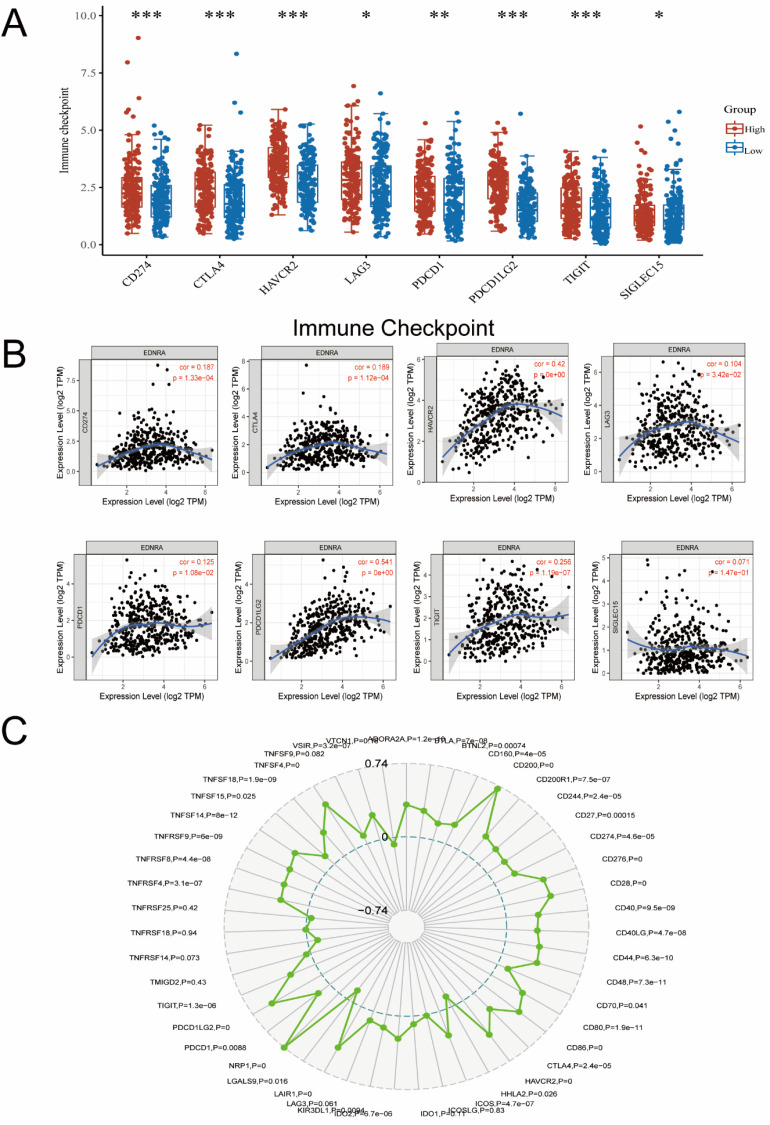
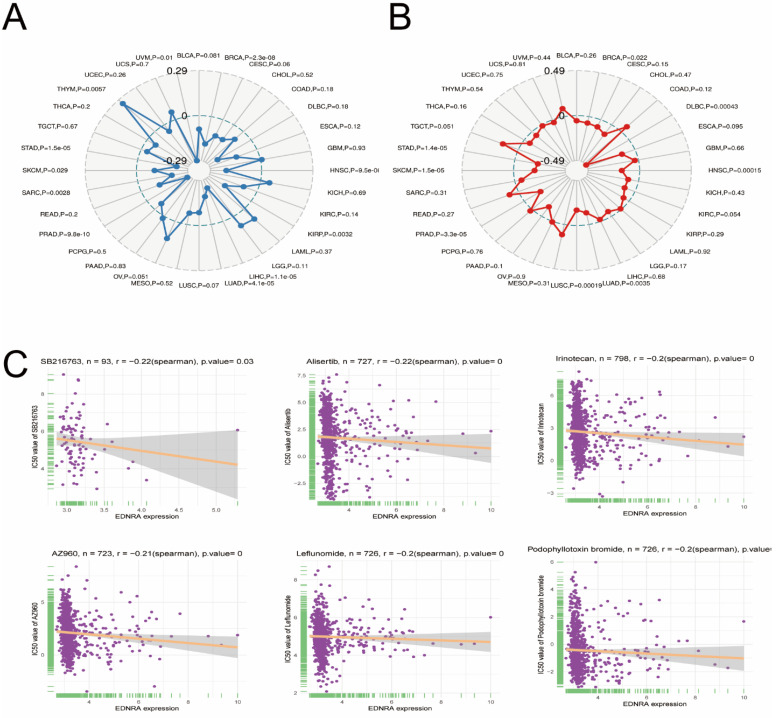
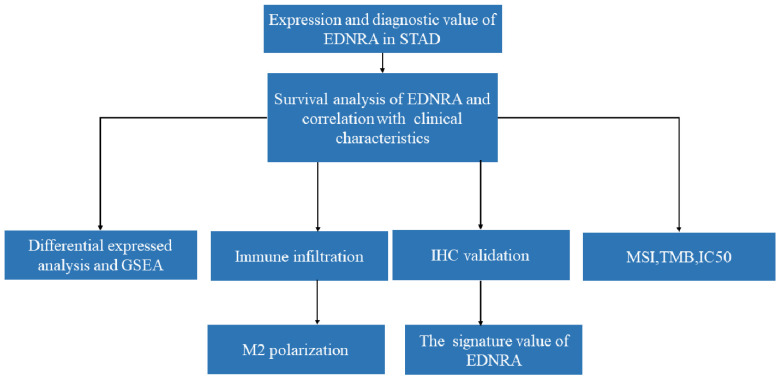
Background: EDNRA (Endothelin Receptor Type A) is closely associated with tumor progression in many tumor types. However, the functional mechanism of EDNRA in stomach adenocarcinoma (STAD) remains to be elucidated. Methods: ENDRA expression levels in STAD were assessed. A Receiver Operating Characteristic (ROC) curve was constructed to measure the diagnostic value of EDNRA. The correlation between ENDRA expression levels and patient clinical-pathological characteristics was analyzed. The survival and prognostic significance were validated using Kaplan-Meier and Cox regression and confirmed by the immunohistochemistry cohorts. Differentially expressed genes of EDNRA in STAD were determined, and EDNRA related functional enrichment and biological pathways involved in STAD were obtained by Gene-Set Enrichment Analysis (GSEA). The correlation between EDNRA expression in STAD and immune cell infiltration was assessed using the CIBERSORT and Spearman correlation analysis, and the correlation between EDNRA and TMB, MSI, IC50, and immune checkpoints was examined. Results: EDNRA expression was significantly higher in STAD than in normal tissues (P < 0.001) and associated with worse overall survival (OS). EDNRA expression was significantly associated with T stage, histological type, histologic grade, and TP53 status. Cox regression analysis revealed that primary therapy outcome, age, tumor status, and EDNRA were independent prognostic factors for OS. Multivariate analysis revealed that EDNRA expression, tumor status, age, and primary therapy outcome influenced patient prognosis. GSEA was significantly enriched in several pathways and biological processes, which include Immunoregulatory, Hedgehog, WNT, PI3K-AKT.NK cells, Tem, macrophages, and mast cells were substantially positively correlated with EDNRA expression in the STAD microenvironment. Notably, high EDNRA expression may promote M2 macrophages to block PD-1-mediated immunotherapy and induce immunosuppression. In addition, patients with high expression of EDNRA might be resistant to the treatment of several anti-tumor drugs. Conclusion: Our results suggest that EDNRA was closely related to clinicopathologic characteristics, poor prognosis, and promoted macrophage differentiation and synergistic role in immunosuppression.

Keywords: EDNRA; Immune checkpoint; Immunoregulatory; M2 macrophage; Tumor biomarker.


Conflict of interest statement

Competing Interests: The authors have declared that no competing interest exists.

Figures

Figure 1
Figure 1
EDNRA expression levels in different types of human cancers and STAD, the diagnostic value. (A) The expression of EDNRA in different types of human cancers. (B) The expression of EDNRA between normal (TCGA + GTEx) and tumor tissues (TCGA). (C) The expression of EDNRA between 375 STAD tissues and 32 adjacent normal tissues from TCGA. (D) The ROC curves of EDNRA in STAD.
Figure 2
Figure 2
Expression of EDNRA correlated with clinicopathologic characteristics of STAD patients and overall survival analysis. (A) Expression of EDNRA correlated significantly with T stage (B), histological type (C), histological grade (D), TP53 status (E) PIK3CA status. (F) The correlation between EDNRA expression and overall survival (OS), as shown in the Kaplan-Meier survival plot.
Figure 3
Figure 3
The preliminary immunohistochemistry analysis and clinical analysis of EDNRA in STAD. (A) Representative Immunohistochemistry image of EDNRA and subcellular staining localization in STAD and adjacent non-tumor tissue specimens. (B) The expression of EDNRA in STAD tissue was higher than adjacent non-tumor tissue (P<0.01). (C) The representative staining of EDNRA in different staining classes. (D) Overall survival analysis revealed that high EDNRA expression indicates a poor prognosis (P = 0.008). (E) The analysis of staining expression level correlated significantly with the T stage. (F) The analysis of staining expression level correlated significantly with Histological grade. I, Grade 1; II, Grade 2; III, Grade 3 (P<0.001).
Figure 4
Figure 4
The differentially expressed genes in correlation with EDNRA in STAD. The volcano plot (A) and the heatmap (B) shown the differential expression genes between the high and the low expression of the EDNRA group.
Figure 5
Figure 5
GSEA analysis of EDNRA in TCGA-STAD data. Several pathways and biological processes were differentially enriched in ENDRA-related STAD, GSEA showed the top-four pathways associated with EDNRA. (A) Immunoregulatory, (B) Hedgehog signaling pathway, (C) WNT signaling pathway, (D) PI3K-AKT signaling pathway ES, enrichment score; NES, normalized ES; adj. P, adjust P-value; FDR, false discovery rate.
Figure 6
Figure 6
Correlation of EDNRA expression with immune infiltration level in STAD by ssGSEA. (A) The association between the EDNRA and 24 subtypes of immune cells level in STAD (B-E) Correlations between EDNRA expression and immune infiltration levels of NK cells, Tem, Macrophages, Mast cells. (F-I) The immune infiltration level of NK cells, Tem, Macrophages, Mast cells in high and low EDNRA expression groups in STAD.
Figure 7
Figure 7
The immune infiltration landscape of EDNRA. (A) Correlation between EDNRA expression and abundance of immune infiltration. (B) Clinical survival analysis between EDNRA and different immune cell types. (C) The relationship between the somatic copy number alterations (SCNA) of EDNRA and abundance of immune infiltration (D). The expression level of EDNRA in different immune and molecular subtypes from TCGA STAD. The P-value Significant: 0 ≤ *** < 0.001 ≤ ** < 0.01 ≤ * < 0.05 ≤ . < 0.1.
Figure 8
Figure 8
EDNRA is significantly associated with M2 macrophage polarization in STAD. The heatmap (A) and barplot (B) showed the difference of immune cell infiltration based on LM22 between high and low expression groups of EDNRA. (C) The correlation analysis of EDNRA expression with macrophage polarization in STAD. Scatterplots of correlations between EDNRA expression and biomarkers of M1 macrophages (iNOS, COX2, and ARG2), M2 macrophages (MRC1, CD163, and MS4A4A), and TAMs (tumor-associated macrophages) (CD86, CCL2, and IL10) are outlined.
Figure 9
Figure 9
The correlation between immune checkpoints between the different expressions of EDNRA. (A) The expression level of classic immune checkpoint between the different expression groups of EDNRA. (B) The analysis of correlations among EDNRA with classic immune checkpoint in the stomach (STAD) microenvironment by Timer database. The correlations among EDNRA and CD274, CTLA4, HAVCR2, LAG3, PDCD1, PDCD1LG2, TIGIT, and SLGLEC15 in the STAD microenvironment. (C) The radar diagram showed the correlation between EDNRA and novel immune checkpoints in the STAD microenvironment.
Figure 10
Figure 10
Correlation between EDNRA and Microsatellite instability (A), TMB (B), and IC50 (C).
Figure 11
Figure 11
The workflow of a comprehensive analysis of EDNRA is outlined.

Similar articles

Cited by

References

    1. Compare D, Rocco A, Nardone G. Risk factors in gastric cancer. European review for medical and pharmacological sciences. 2010;14:302–8. - PubMed
    1. Song W, Shen L, Wang Y, Liu Q, Goodwin TJ, Li J. et al. Synergistic and low adverse effect cancer immunotherapy by immunogenic chemotherapy and locally expressed PD-L1 trap. Nature communications. 2018;9:2237. - PMC - PubMed
    1. Coutzac C, Pernot S, Chaput N, Zaanan A. Immunotherapy in advanced gastric cancer, is it the future? Critical reviews in oncology/hematology. 2019;133:25–32. - PubMed
    1. Shihoya W, Izume T, Inoue A, Yamashita K, Kadji FMN, Hirata K. et al. Crystal structures of human ET(B) receptor provide mechanistic insight into receptor activation and partial activation. Nature communications. 2018;9:4711. - PMC - PubMed
    1. Ohta H, Aoyagi K, Fukaya M, Danjoh I, Ohta A, Isohata N. et al. Cross talk between hedgehog and epithelial-mesenchymal transition pathways in gastric pit cells and in diffuse-type gastric cancers. British journal of cancer. 2009;100:389–98. - PMC - PubMed