. 2022 Apr 19:10:816637.
doi: 10.3389/fcell.2022.816637. eCollection 2022.

Maternal Protein Restriction Alters the Expression of Proteins Related to the Structure and Functioning of the Rat Offspring Epididymis in an Age-Dependent Manner

Affiliations

Maternal Protein Restriction Alters the Expression of Proteins Related to the Structure and Functioning of the Rat Offspring Epididymis in an Age-Dependent Manner

Marilia Martins Cavariani et al. Front Cell Dev Biol. .

Abstract

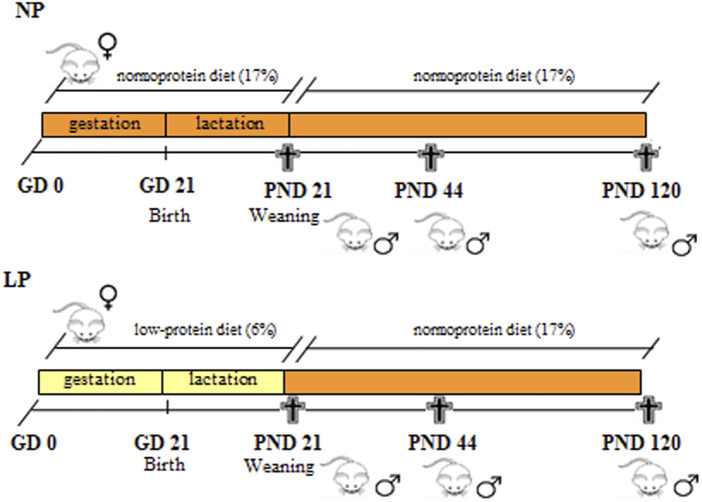
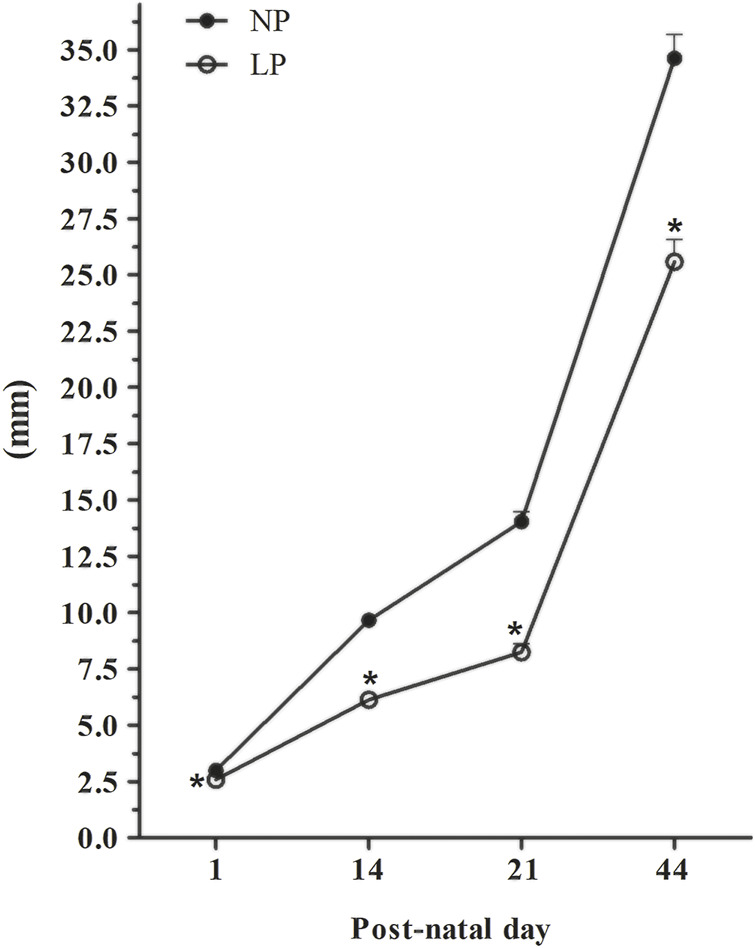
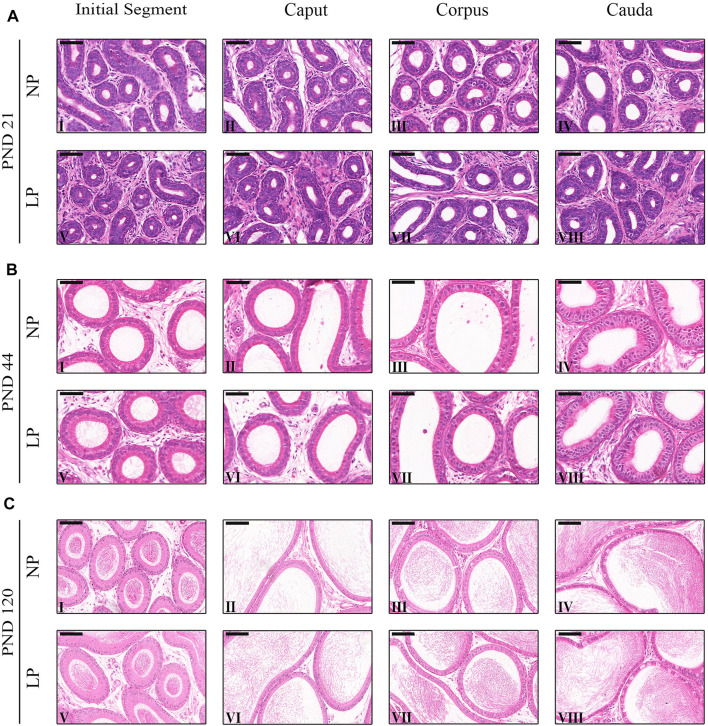
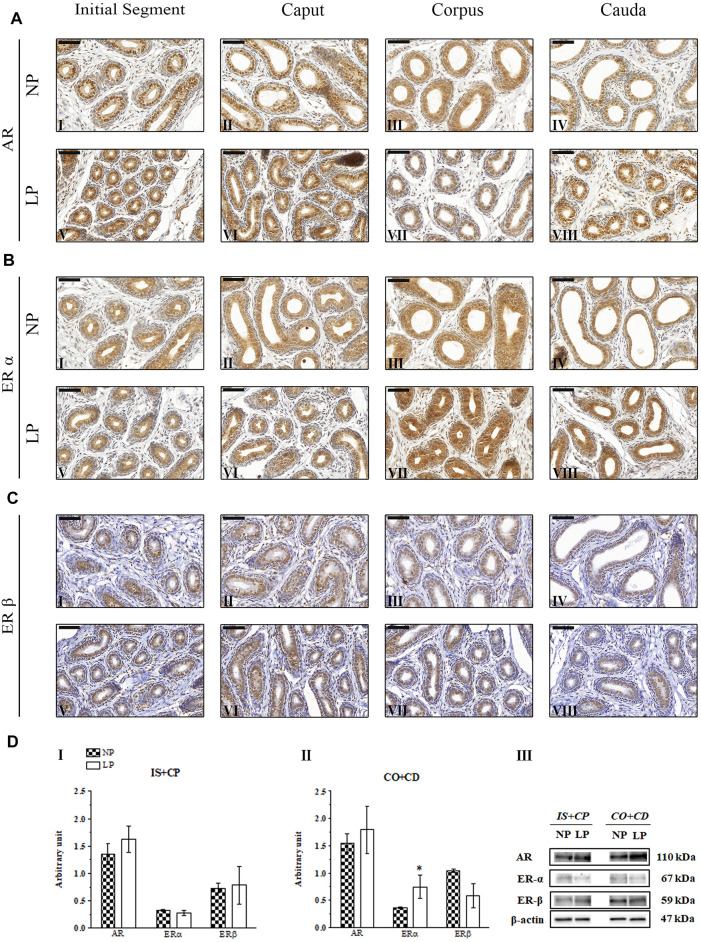
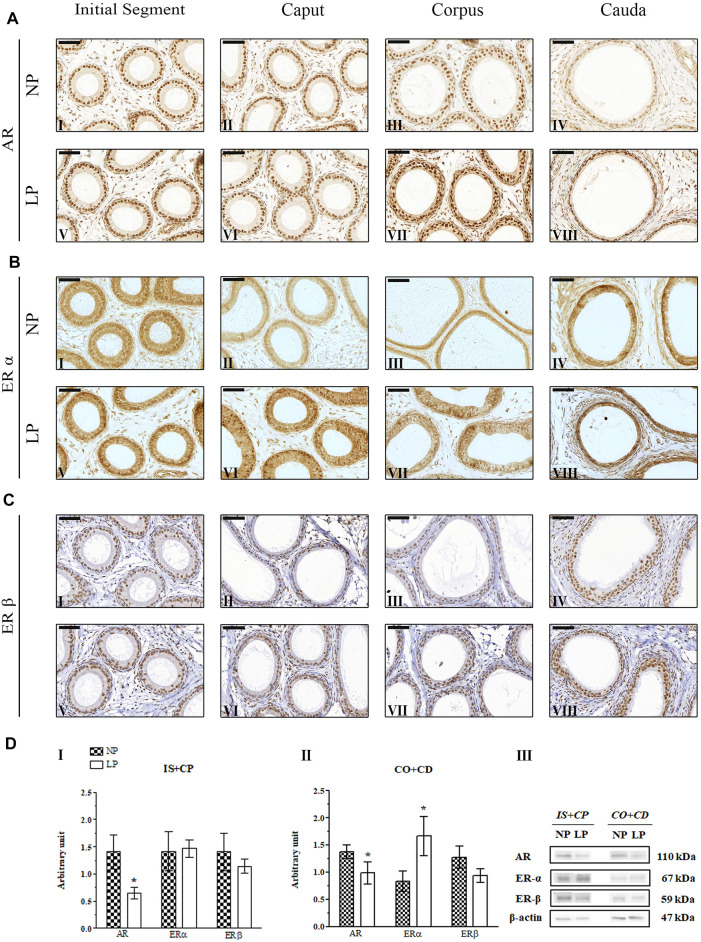
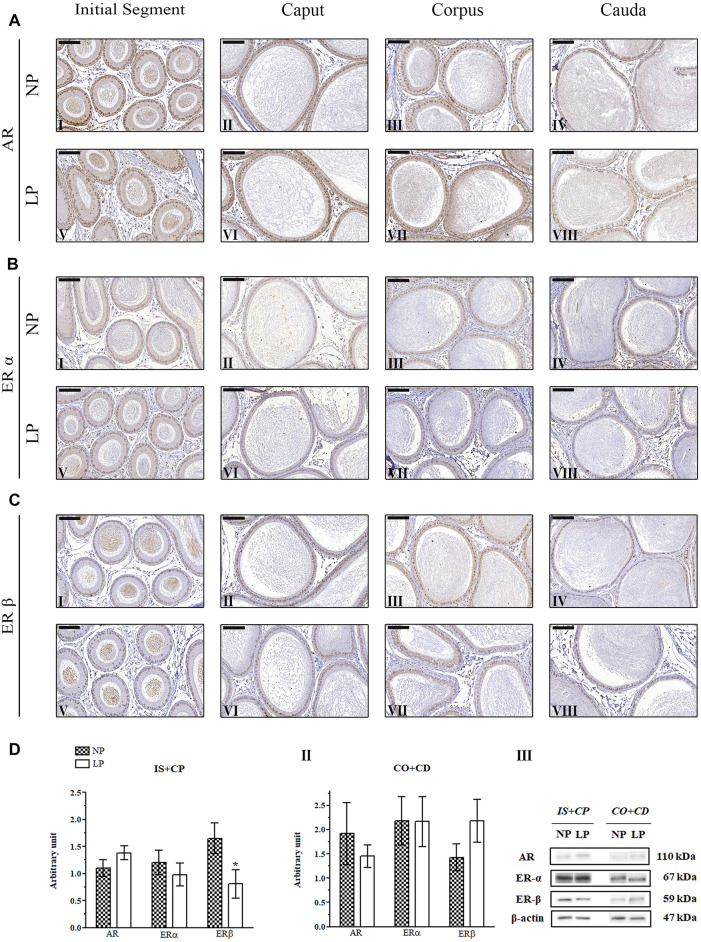
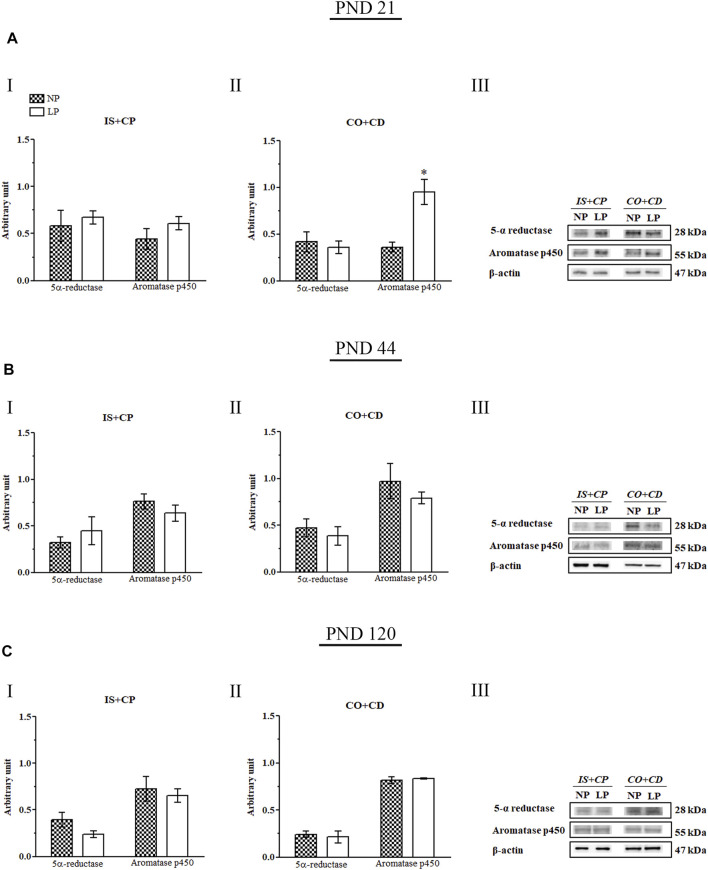
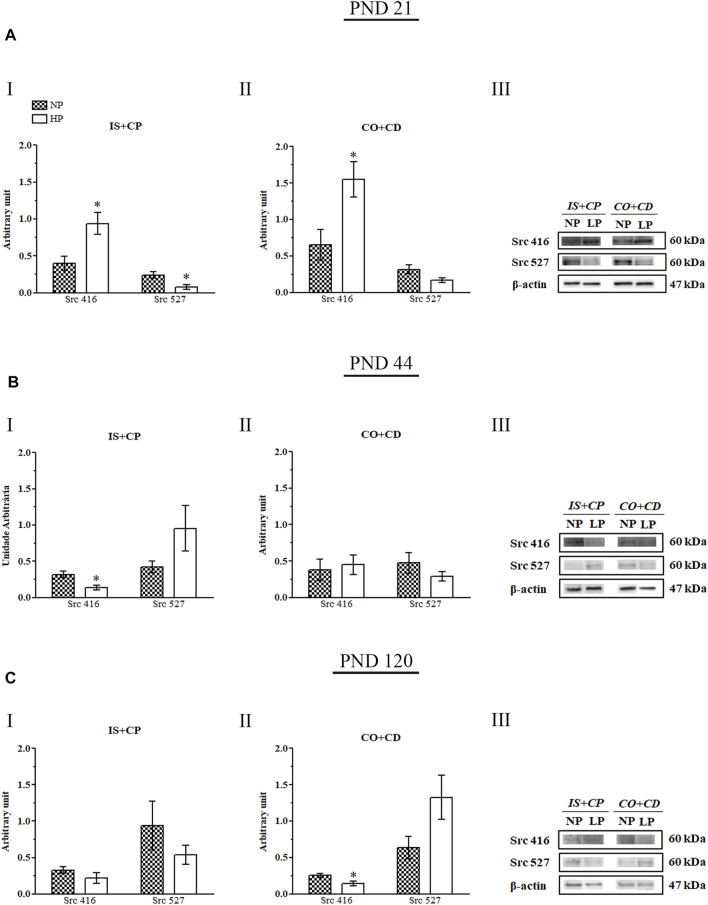
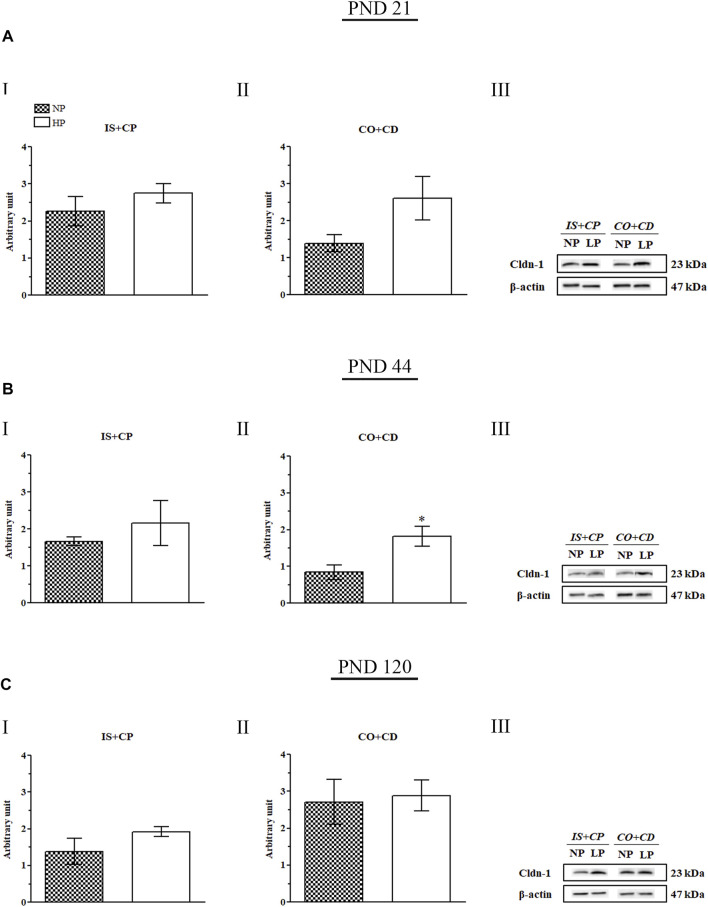
Nutrition is an environmental factor able to activate physiological interactions between fetus and mother. Maternal protein restriction is able to alter sperm parameters associated with epididymal functions. Since correct development and functioning of the epididymides are fundamental for mammalian reproductive success, this study investigated the effects of maternal protein restriction on epididymal morphology and morphometry in rat offspring as well as on the expression of Src, Cldn-1, AR, ER, aromatase p450, and 5α-reductase in different stages of postnatal epididymal development. For this purpose, pregnant females were allocated to normal-protein (NP-17% protein) and low-protein (LP-6% protein) groups that received specific diets during gestation and lactation. After weaning, male offspring was provided only normal-protein diet until the ages of 21, 44, and 120 days, when they were euthanized and their epididymides collected. Maternal protein restriction decreased genital organs weight as well as crown-rump length and anogenital distance at all ages. Although the low-protein diet did not change the integrity of the epididymal epithelium, we observed decreases in tubular diameter, epithelial height and luminal diameter of the epididymal duct in 21-day-old LP animals. The maternal low-protein diet changed AR, ERα, ERβ, Src 416, and Src 527 expression in offspring epididymides in an age-dependent manner. Finally, maternal protein restriction increased Cldn-1 expression throughout the epididymides at all analyzed ages. Although some of these changes did not remain until adulthood, the insufficient supply of proteins in early life altered the structure and functioning of the epididymis in important periods of postnatal development.

Keywords: CLDN-1; epididymis; hormone receptors; maternal protein restriction; postnatal development; src.


Conflict of interest statement

The authors declare that the research was conducted in the absence of any commercial or financial relationships that could be construed as a potential conflict of interest.

Figures

FIGURE 1
FIGURE 1
Experimental design. Pregnant rats received a low-protein diet (LP group) or a normal-protein diet (NP group) ad libitum from the GD 0 until PND 21 (during gestation and lactation). After weaning, male pups from both groups received a standard diet until PNDs 21, 44 and 120.
FIGURE 2
FIGURE 2
Evolution of the anogenital distance. PND 1: NP, n = 17, LP, n = 19; PND 14: NP, n = 19, LP, n = 26; PND 21: NP, n = 17, LP, n = 22; PND 44: NP, n = 12, LP, n = 10. Evolution of AGD in animals whose mothers received normal-protein and low-protein diets during gestation and lactation. The values are expressed as the mean ± S.E.M. *p < 0.05. Student t-test was used to assess the significance of parametric data, and Mann-Whitney test was used to assess the significance in nonparametric data.
FIGURE 3
FIGURE 3
Morphology of the epididymis. (A) Staining of the epididymides of NP and LP animals at PND 21 showing the initial segment (I and V), caput (III and VI), corpus (III and VII) and cauda (IV and VIII). H&E, Bar = 50 µm. (B) Staining of the epididymides of NP and LP animals at PND 44 showing the initial segment (I and V), caput (III and VI), corpus (III and VII) and cauda (IV and VIII) . H&E, Bar = 50 µm. (C) Staining of the epididymides of NP and LP animals at PND 120 showing the initial segment (I and V), caput (III and VI), corpus (III and VII) and cauda (IV and VIII). H&E, Bar = 100 µm.
FIGURE 4
FIGURE 4
Expression and immunolocalization of AR, ERα and ERβ in the epididymides of 21-day-old animals. (A) Immunoreactivity for AR in epithelial cells and in mesenchymal cells in the initial segment (I and V), caput (II and VI), corpus (III and VII) and cauda (IV and VIII) regions of NP and LP animals. (B) Immunoreactivity for ERα in epithelial cells and in mesenchymal cells in the initial segment (I and V), caput (II and VI), corpus (III and VII) and cauda (IV and VIII) regions of NP and LP animals. (C) Immunoreactivity for ERβ in epithelial cells and in mesenchymal cells in the initial segment (I and V), caput (II and VI), corpus (III and VII) and cauda (IV and VIII) regions of NP and LP animals. Bar = 50 µm. (D) Extracts obtained from individual animals were used for densitometric analysis of the levels of the proteins in the initial segment plus caput (I) and the corpus plus cauda (II) regions following normalization to the levels of the housekeeping protein β-actin. The representative blots show the protein levels of AR, ERα, ERβ and β-actin (III, right panel). The data are presented as the mean ± S.E.M. *p < 0.05, Mann-Whitney test.
FIGURE 5
FIGURE 5
Expression and immunolocalization of AR, ERα and ERβ in the epididymides of 44-day-old animals. (A) Immunoreactivity for AR in epithelial cells and in mesenchymal cells in the initial segment (I and V), caput (II and VI), corpus (III and VII) and cauda (IV and VIII) regions of NP and LP animals. (B) Immunoreactivity for ERα in epithelial cells and in mesenchymal cells in the initial segment (I and V), caput (II and VI), corpus (III and VII) and cauda (IV and VIII) regions of NP and LP animals. (C) Immunoreactivity for ERβ in epithelial cells and in mesenchymal cells in the initial segment (I and V), caput (II and VI), corpus (III and VII) and cauda (IV and VIII) regions of NP and LP animals. Bar = 50 µm. (D) Extracts obtained from individual animals were used for densitometric analysis of the levels of the proteins in the initial segment plus caput (I) and corpus plus cauda (II) regions following normalization to the levels of the housekeeping protein β-actin. The representative blots show the protein levels of AR, ERα, ERβ and β-actin (III, right panel). The data are presented as the mean ± S.E.M. *p < 0.05, Mann-Whitney test.
FIGURE 6
FIGURE 6
Expression and immunolocalization of AR, ERα and ERβ in the epididymides of 120-day-old animals. (A) Immunoreactivity for AR in epithelial cells and in mesenchymal cells in the initial segment (I and V), caput (II and VI), corpus (III and VII) and cauda (IV and VIII) regions of NP and LP animals. (B) Immunoreactivity for ERα in epithelial cells and in mesenchymal cells in the initial segment (I and V), caput (II and VI), corpus (III and VII) and cauda (IV and VIII) regions of NP and LP animals. (C) Immunoreactivity for ERβ in epithelial cells and in mesenchymal cells in the initial segment (I and V), caput (II and VI), corpus (III and VII) and cauda (IV and VIII) regions of NP and LP animals. Bar = 100 µm. (D) Extracts obtained from individual animals were used for densitometric analysis of the levels of the proteins in the initial segment plus caput (I) and corpus plus cauda (II) regions following normalization to the levels of the housekeeping protein β-actin. The representative blots show the protein levels of AR, ERα, ERβ and β-actin (III, right panel). The data are presented as the mean ± S.E.M. *p < 0.05, Mann-Whitney test.
FIGURE 7
FIGURE 7
Immunoblots of 5α-reductase and aromatase p450. (A) Levels of 5α-reductase and aromatase p450 in the IS + CP (I) and CO + CD (II) epididymal regions of NP and LP animals on PND 21. The representative blots show the protein levels of 5α-reductase, aromatase p450, and β-actin (70 µg of protein) in 21-day-old animals (III). (B) Levels of 5α-reductase and aromatase p450 in the IS + CP (I) and CO + CD (II) epididymal regions of NP and LP animals on PND 44. The representative blots show the protein levels of 5α-reductase, aromatase p450 and β-actin (70 µg of protein) in 44-day-old animals (III). (C) Levels of 5α-reductase and aromatase p450 in the IS + CP (I) and CO + CD (II) epididymal regions of NP and LP animals on PND 120. The representative blots show the protein levels of 5α-reductase, aromatase p450 and β-actin (70 µg of protein) in 120-day-old animals (III). The data are presented as the mean ± S.E.M. *p < 0.05, Mann-Whitney test.
FIGURE 8
FIGURE 8
Immunoblots of Src 416 and Src 527. (A) Levels of Src 416 and Src 527 in the IS + CP (I) and CO + CD (II) epididymal regions of NP and LP animals on PND 21. The representative blots show the protein levels of Src 416, Src 527 and β-actin (70 µg of protein) in 21-day-old animals (III). (B) Levels of Src 416 and Src 527 in the IS + CP (I) and CO + CD (II) epididymal regions of NP and LP animals on PND 44. The representative blots show the protein levels of Src 416, Src 527 and β-actin (70 µg of protein) in 44-day-old animals (III). (C) Levels of Src 416 and Src 527 in the IS + CP (I) and CO + CD (II) epididymal regions of NP and LP animals on PND 120. The representative blots show the protein levels of Src 416, Src 527 and β-actin (70 µg of protein) in 120-day-old animals (III). The data are presented as the mean ± S.E.M. *p < 0.05, Mann-Whitney test.
FIGURE 9
FIGURE 9
Cldn-1 immunoblot. (A) Levels of Cldn-1 in the IS + CP (I) and CO + CD (II) epididymal regions of NP and LP animals on PND 21. The representative blots show the protein levels of Cldn-1 and β-actin (70 µg of protein) in 21-day-old animals (III). (B) Levels of Cldn-1 in the IS + CP (I) and CO + CD (II) epididymal regions of NP and LP animals on PND 44. The representative blots show the protein levels of Cldn-1 and β-actin (70 µg of protein) in 44-day-old animals (III). (C) Levels of Cldn-1 in the IS + CP (I) and CO + CD (II) epididymal regions of NP and LP animals on PND 120. The representative blots show the protein levels of Cldn-1 and β-actin (70 µg of protein) in 120-day-old animals (III). The data are presented as the mean ± S.E.M. *p < 0.05, Mann-Whitney test.

Similar articles

Cited by

References

    1. Armitage J. A., Taylor P. D., Poston L. (2005). Experimental Models of Developmental Programming: Consequences of Exposure to an Energy Rich Diet during Development. J. Physiol. 565 (Pt 1), 3–8. 10.1113/jphysiol.2004.079756 - DOI - PMC - PubMed
    1. Barker D. J. P. (1995b). Fetal Origins of Coronary Heart Disease. Bmj 311 (6998), 171–174. 10.1136/bmj.311.6998.171 - DOI - PMC - PubMed
    1. Barker D. J. P. (1995a). The Fetal and Infant Origins of Disease. Eur. J. Clin. Invest. 25 (7), 457–463. 10.1111/j.1365-2362.1995.tb01730.x - DOI - PubMed
    1. Barker D. J. P. (2007). The Origins of the Developmental Origins Theory. J. Intern. Med. 261 (5), 412–417. 10.1111/j.1365-2796.2007.01809.x - DOI - PubMed
    1. Bell M. R. (2018). Comparing Postnatal Development of Gonadal Hormones and Associated Social Behaviors in Rats, Mice, and Humans. Endocrinology 159 (7), 2596–2613. 10.1210/en.2018-00220 - DOI - PMC - PubMed