. 2022 Apr 19:10:875155.
doi: 10.3389/fcell.2022.875155. eCollection 2022.

A Stage-Specific OTX2 Regulatory Network and Maturation-Associated Gene Programs Are Inherent Barriers to RPE Neural Competency

Affiliations

A Stage-Specific OTX2 Regulatory Network and Maturation-Associated Gene Programs Are Inherent Barriers to RPE Neural Competency

Jared A Tangeman et al. Front Cell Dev Biol. .

Abstract

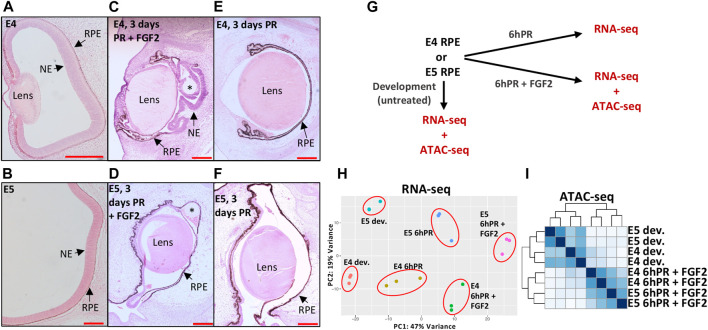
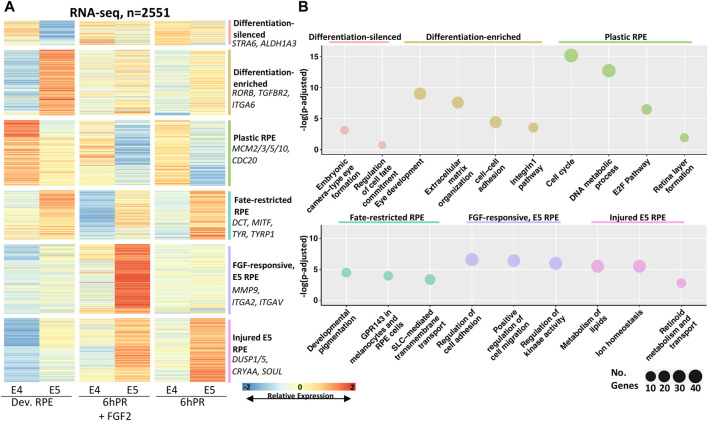
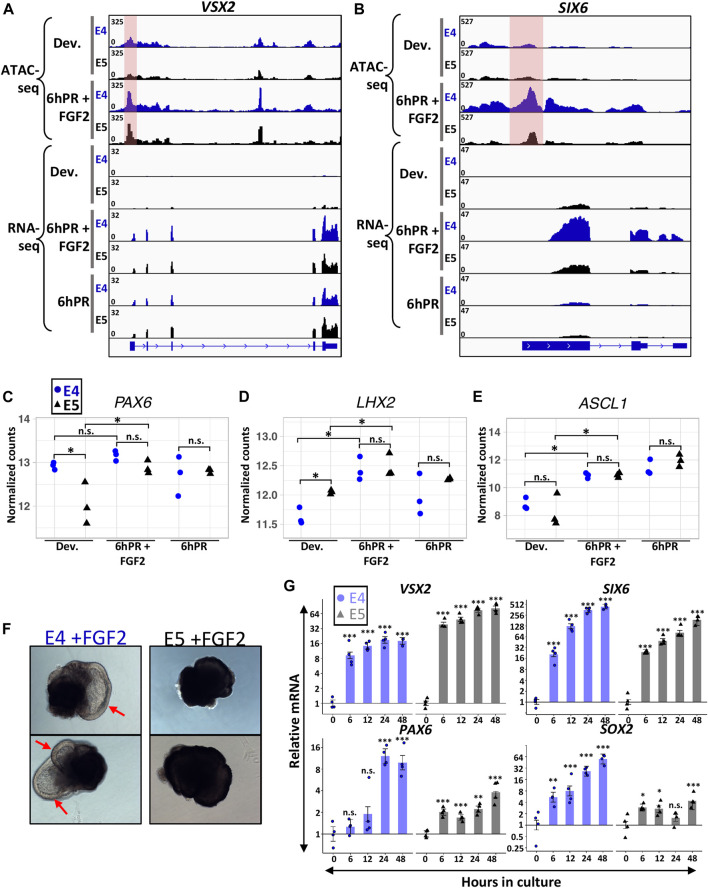
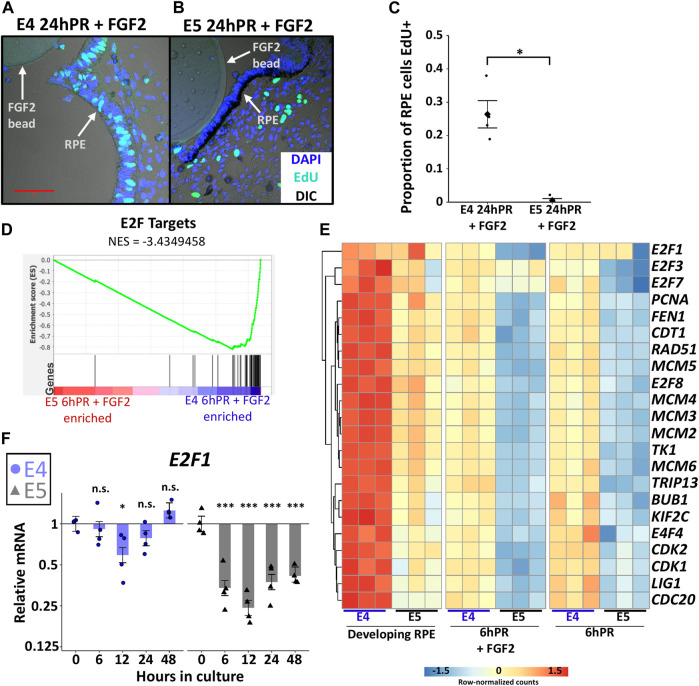
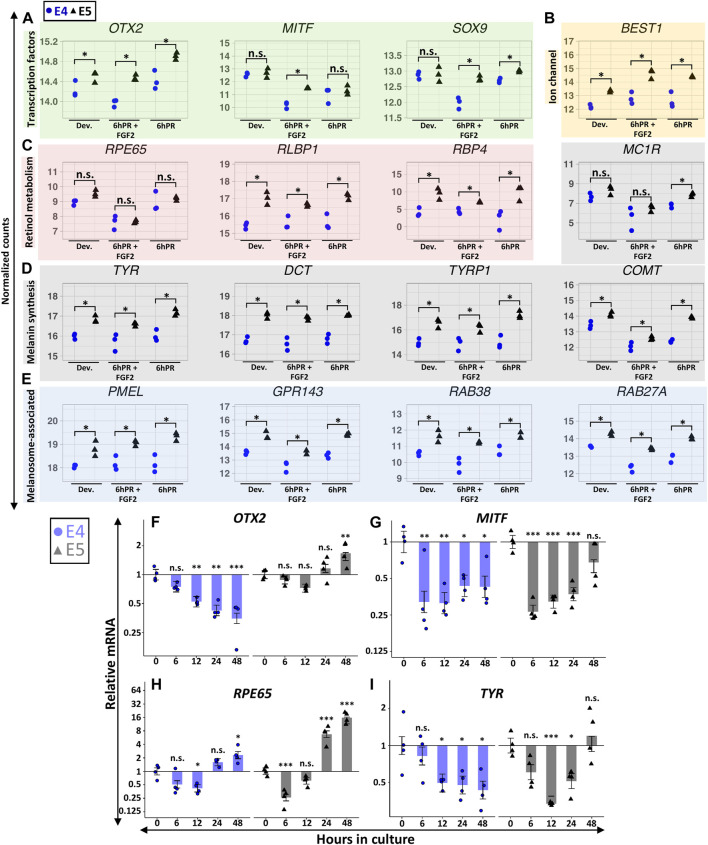
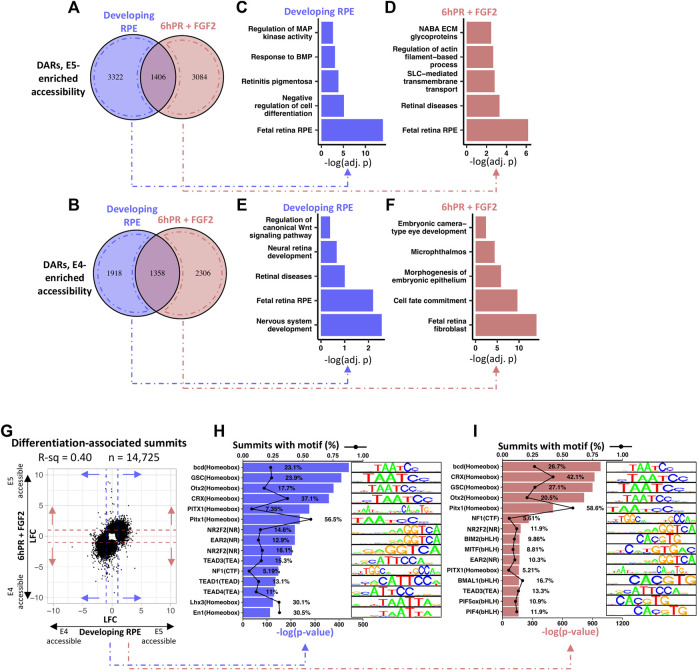
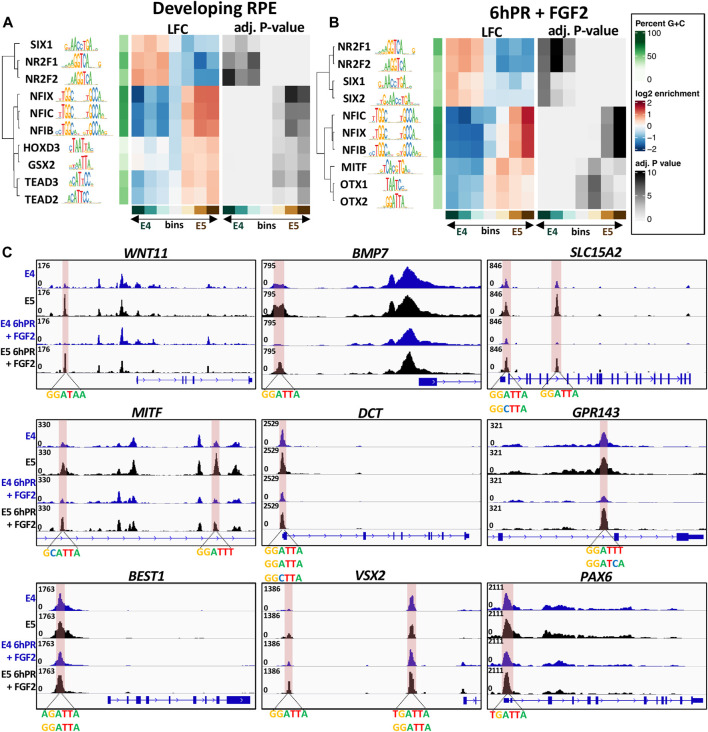
The retinal pigment epithelium (RPE) exhibits a diverse range of plasticity across vertebrates and is a potential source of cells for the regeneration of retinal neurons. Embryonic amniotes possess a transitory ability to regenerate neural retina through the reprogramming of RPE cells in an FGF-dependent manner. Chicken RPE can regenerate neural retina at embryonic day 4 (E4), but RPE neural competence is lost by embryonic day 5 (E5). To identify mechanisms that underlie loss of regenerative competence, we performed RNA and ATAC sequencing using E4 and E5 chicken RPE, as well as at both stages following retinectomy and FGF2 treatment. We find that genes associated with neural retina fate remain FGF2-inducible in the non-regenerative E5 RPE. Coinciding with fate restriction, RPE cells stably exit the cell cycle and dampen the expression of cell cycle progression genes normally expressed during regeneration, including E2F1. E5 RPE exhibits progressive activation of gene pathways associated with mature function independently of retinectomy or FGF2 treatment, including retinal metabolism, pigmentation synthesis, and ion transport. Moreover, the E5 RPE fails to efficiently repress OTX2 expression in response to FGF2. Predicted OTX2 binding motifs undergo robust accessibility increases in E5 RPE, many of which coincide with putative regulatory elements for genes known to facilitate RPE differentiation and maturation. Together, these results uncover widespread alterations in gene regulation that culminate in the loss of RPE neural competence and implicate OTX2 as a key determinant in solidifying the RPE fate. These results yield valuable insight to the basis of RPE lineage restriction during early development and will be of importance in understanding the varying capacities for RPE-derived retinal regeneration observed among vertebrates.

Keywords: ATAC-seq; Otx2; RPE; regeneration; reprogramming; retina.


Conflict of interest statement

The authors declare that the research was conducted in the absence of any commercial or financial relationships that could be construed as a potential conflict of interest.

Figures

FIGURE 1
FIGURE 1
Profiling gene expression and genomic accessibility in the plastic and fate-restricted RPE. The developing (dev.) eye at E4 (A) and posterior eye at E5 (B) are shown with RPE and neuroepithelium (NE; presumptive neural retina) labeled. A regenerating NE is observed 3 days PR if treated with FGF2 at E4 (C), but no regeneration is observed 3 days PR and FGF2 treatment at E5 (D). At 3 days PR, no regeneration is observed if surgery is performed at E4 (E) or E5 (F) in the absence of FGF2. Scale bars in (AF) are each 200 μm. Asterisk (*) denotes the FGF2 bead. (G) Schematic summarizes the collection of RNA-seq and ATAC-seq samples used in this study. (H) Principal component analysis summarizes the variation present in RNA-seq normalized gene expression values across 18 samples and six tested conditions. (I) Heatmap displays blind hierarchical clustering of normalized ATAC-seq peak signal for each sample.
FIGURE 2
FIGURE 2
Clustering of differentially expressed genes reveals expression programs associated with RPE commitment and reprogramming. (A) Affinity propagation clustering was performed on all genes that are differentially expressed across the E4 to E5 window by the criteria |LFC| ≥ 1 and adj. p-value ≤ 0.05 (n = 2551), resulting in six clusters. Key genes are summarized on the right of heatmap. The heatmap intensity displays row-normalized gene counts. (B) Bubble charts display select gene ontology terms associated with each cluster. Adj. p-value is plotted on y-axis and the bubble size is proportional to number of terms identified in the analysis.
FIGURE 3
FIGURE 3
Neural retina identity genes are active 6hPR + FGF2 at E4 and E5. Genome browser views display the VSX2 (A) and SIX6 (B) loci, with the normalized counts for ATAC-seq and RNA-seq assays summarized in the coverage tracks above. The highlighted pink area represents changes in promoter-region accessibility. Normalized gene expression counts are displayed for neural retina-associated genes PAX6 (C) LHX2 (D) and ASCL1 (E). The y-axes are log-transformed. Asterisk (*) denotes an Adj. p-value ≤ 0.05. n.s., not significant. (F) Two representative RPE explants are shown after 48 h in culture in the presence of FGF2 at E4 (left) or E5 (right). Red arrows point to RPE-derived neural retina from E4 explants. (G) Gene expression was measured via RT-qPCR using explants cultured in the presence of FGF2 at E4 or E5 and collected at the specified time points. Bar chart displays the average expression, and the error bars represent standard error of the treatment mean based on ANOVA. Each dataset is normalized to basal levels observed at time 0; y-axes are log2-transformed. qPCR significance: n.s. denotes not significant, * denotes p-value < 0.05, ** denotes p-value < 0.01, *** denotes p-value < 0.001.
FIGURE 4
FIGURE 4
Proliferation is tightly regulated across the window of RPE cell fate restriction. (A) EdU and DAPI fluorescence staining of embryo sections collected 24 h PR (24hPR) and FGF2 treatment was performed at either E4 (A) or E5 (B). Fluorescence channels are overlayed with differential interference contrast (DIC) image. 50 μm scale bar in (A) applies to both panels. Chart displays the proportion of EdU positive RPE cells observed 24hPR + FGF2 at E4 and E5 (C). Diamond represents mean proportion; asterisk (*) denotes Adj. p value <0.05. (D) Gene set enrichment analysis (GSEA) was performed on normalized RNA-seq expression values from 6hPR + FGF2 E4 and E5 samples. A low normalized enrichment score (NES = −3.4349458) for E2F targets indicates high enrichment in the E4 6hPR + FGF2 RPE and depletion from the E5 6hPR + FGF2 RPE. Each black vertical bar represents a gene in the pathway. (E) The row-normalized heatmap displays RNA-seq expression values for E2F targets genes and proliferation-associated factors. (F) RT-qPCR was used to measure E2F1 expression in E4 and E5 explants cultured in the presence of FGF2 and collected at the specified time points. Bar chart displays the average expression value, and the error bars represent standard error of the treatment mean based on ANOVA. Each dataset is normalized to basal levels observed at time 0; y-axes are log2-transformed. qPCR significance: n.s. denotes not significant, * denotes p-value < 0.05, ** denotes p-value < 0.01, *** denotes p-value < 0.001.
FIGURE 5
FIGURE 5
Gene signatures associated with RPE maturation are broadly elevated in the E5 RPE. Normalized RNA-seq expression values are displayed for genes encoding RPE-associated transcription factors (A), the ion channel BEST1 (B), retinol metabolism and transport factors (C), melanin synthesis machinery (D), and melanosome-associated proteins (E). For (AE), asterisk (*) denotes an Adj. p-value ≤ 0.05 and n.s., not significant. Relative gene expression was measured in RPE explants using RT-qPCR, and is displayed for OTX2 (F), MITF (G), RPE65 (H), and TYR (I). Bar chart displays the average expression, and the error bars represent standard error of the treatment mean based on ANOVA. Each dataset is normalized to basal levels observed at time 0; y-axes are log2-transformed. qPCR significance: n.s. denotes not significant, * denotes p-value < 0.05, ** denotes p-value < 0.01, *** denotes p-value < 0.001.
FIGURE 6
FIGURE 6
RPE maturation is accompanied by differential accessibility at retinal development genes and homeobox transcription factor binding sites. (A) Venn diagram summarizes the overlap of up-regulated DARs (DARs with increased E5 accessibility) between the developing and 6hPR + FGF2 conditions, defined by a cut-off of Adj. p-value ≤ 0.05. (B) Similarly, Venn diagram displays down-regulated DARs (E4-enriched DARs) for the two conditions. DARs unique to either condition were annotated to the nearest gene TSS within 10 kilobases, and pathway enrichment analysis was performed for DARs enriched in the developing E5 RPE (C), the E5 6hPR + FGF2 RPE (D), the developing E4 RPE (E), or the E4 6hPR + FGF2 RPE (F). (G) The log fold change (LFC) of differentially accessible peak summits between the E4 and E5 conditions are plotted. Dashed lines represent a LFC cut-off of 1 that was used to select summits for motif analysis. HOMER motif detection software was used to identify transcription factor DNA motifs overrepresented in the summits of peaks differentially accessible across the developing (H) or 6hPR + FGF2 (I) RPE, and the top 15 enriched motifs are shown.
FIGURE 7
FIGURE 7
Overrepresented motifs in open regions of the E4/E5 RPE. The monaLisa motif analysis software was used to bin differentially accessible summits by accessibility across the E4 and E5 conditions. Each bin was analyzed for the overrepresentation of transcription factor motifs found in the JASPAR 2022 database. Enriched motifs identified at −log(p-Adj.) >3 in any bin were recorded and select factors associated with the developing RPE (A) or 6hPR + FGF2 (B) samples were plotted. (C) Genome browser displays ATAC-signal proximal to DARs containing the OTX2 binding motif. The region of interest is highlighted in pink and associated motifs are summarized below the track.

Similar articles

Cited by

References

    1. Babraham Bioinformatics - FastQC (2020). A Quality Control Tool for High Throughput Sequence Data. Available at: https://www.bioinformatics.babraham.ac.uk/projects/fastqc/ (Accessed April 13, 2020).
    1. Benedicto I., Lehmann G. L., Ginsberg M., Nolan D. J., Bareja R., Elemento O., et al. (2017). Concerted Regulation of Retinal Pigment Epithelium Basement Membrane and Barrier Function by Angiocrine Factors. Nat. Commun. 8, 15374. 10.1038/ncomms15374 - DOI - PMC - PubMed
    1. Benjamini Y., Yekutieli D. (2001). The Control of the False Discovery Rate in Multiple Testing under Dependency. Ann. Stat. 29, 1165–1188. 10.1214/aos/1013699998 - DOI
    1. Bharti K., Gasper M., Ou J., Brucato M., Clore-Gronenborn K., Pickel J., et al. (2012). A Regulatory Loop Involving PAX6, MITF, and WNT Signaling Controls Retinal Pigment Epithelium Development. Plos Genet. 8, e1002757. 10.1371/journal.pgen.1002757 - DOI - PMC - PubMed
    1. Bharti K., Nguyen M.-T. T., Skuntz S., Bertuzzi S., Arnheiter H. (2006). The Other Pigment Cell: Specification and Development of the Pigmented Epithelium of the Vertebrate Eye. Pigment Cel Res 19, 380–394. 10.1111/j.1600-0749.2006.00318.x - DOI - PMC - PubMed