. 2020 Oct 16;10(63):38244-38250.
doi: 10.1039/d0ra06495e. eCollection 2020 Oct 15.

Dual-colour (near-infrared/visible) emitting annexin V for fluorescence imaging of tumour cell apoptosis in vitro and in vivo

Affiliations

Dual-colour (near-infrared/visible) emitting annexin V for fluorescence imaging of tumour cell apoptosis in vitro and in vivo

Setsuko Tsuboi et al. RSC Adv. .

Abstract

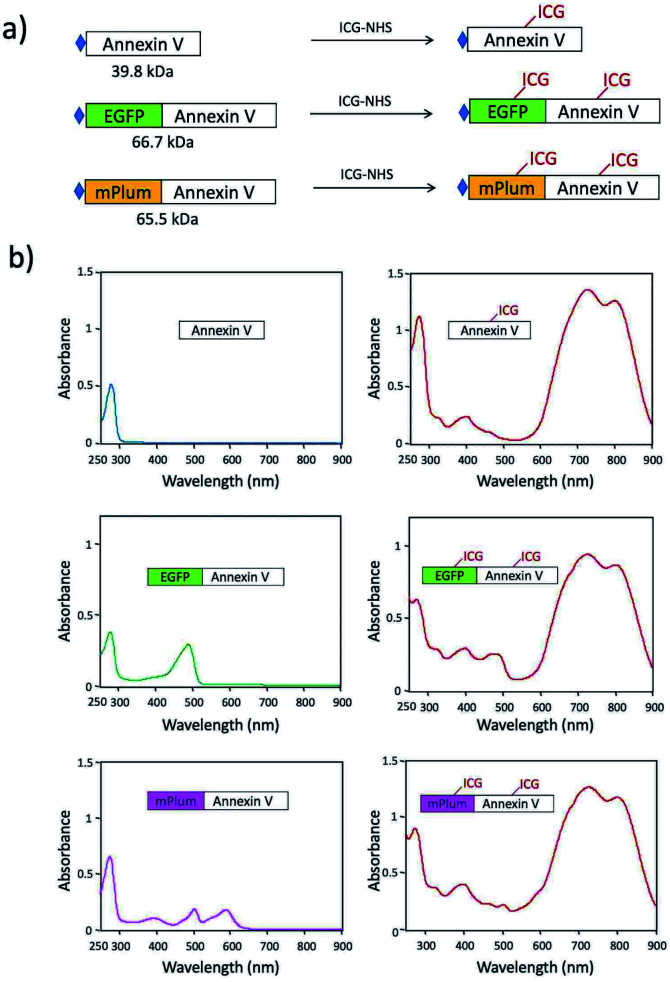
Indocyanine green (ICG) labelled recombinant annexin V proteins (ICG-EGFP-Annexin V and ICG-mPlum-Annexin V) were synthesized for dual-colour fluorescence imaging of tumour cell apoptosis in vitro and in vivo. The ICG-labelled fluorescent annexin V proteins showed dual (near-infrared and visible) fluorescence emissions with binding ability to phosphatidylserines on the plasma membranes of apoptotic cells. Although several types of fluorescence labelled annexin V (e.g. FITC-annexin V, Cy3- and Cy5-annexin V) have been reported, there are no dual-colour (near-infrared/visible) emitting apoptosis-detection probes which can be used in vitro and in vivo. In this paper, the utilities of the dual-colour fluorescent annexin V are demonstrated for in vitro and in vivo fluorescence imaging of the apoptosis of human breast tumour cells induced by an antibody-drug conjugate, Kadcyla. The results suggest that the present annexin V probes will be useful to visualize the action of anti-cancer drugs against tumours both at the cellular and whole-body level.


Conflict of interest statement

There are no conflicts to declare.

Figures

Scheme 1
Scheme 1. NIR/VIS emitting dual-colour probes (ICG–EGFP–Annexin V and ICG–mPlum–Annexin V) for fluorescence imaging of tumour cell apoptosis in vitro and in vivo.
Fig. 1
Fig. 1. (a) Fluorescence labelling of Annexin V, EGFP–Annexin V, and mPlum–Annexin V with ICG-NHS. The symbol of shows a histidine tag. (b) Absorption spectra of Annexin V, EGFP–Annexin V, and mPlum–Annexin V in phosphate buffered saline (PBS) before and after labelling with ICG-NHS.
Fig. 2
Fig. 2. (a) Fluorescence spectra of ICG–Annexin V, ICG–EGFP–Annexin V, and ICG–mPlum–Annexin V in PBS. Solid and broken lines show their emission and excitation spectra, respectively. (b) Pseudo-coloured fluorescence images of ICG–Annexin V, ICG–EGFP–Annexin V, and ICG–mPlum–Annexin V in PBS. The fluorescence images of EGFP (em: 515 ± 20 nm), mPlum (em: 670 ± 20 nm), and ICG (em: 830 ± 20 nm) were taken by excitation at 470, 590, and 760 nm, respectively.
Fig. 3
Fig. 3. Time course of fluorescence intensities of ICG, EGFP and mPlum emissions in (a) ICG–EGFP–Annexin V and (b) ICG–mPlum–Annexin V in PBS. Fluorescence intensities are detected at 515 nm for EGFP, 670 nm for mPlum, and 830 nm for ICG. The concentration of probe was 15 μM.
Fig. 4
Fig. 4. Bright field (BF) and fluorescence images of KPL-4 cells treated with and without Kadcyla (10 nM). Cellular imaging and flow cytometric analysis were performed three days after the treatment of Kadcyla. (a) KPL-4 cells were stained with FITC–Annexin V. Green colour shows the emission from FITC. The right graph shows the flow cytometric analysis of KPL-4 cells treated with and without Kadcyla. (b) KPL-4 cells were stained with ICG–EGFP–Annexin V. The emissions of EGFP (green) and ICG (red) were detected at 525 ± 25 nm (ex: 470 ± 20 nm) and 832 ± 19 nm (ex: 769 ± 20 nm), respectively. (c) KPL-4 cells were stained with ICG–mPlum–Annexin V. The emissions of mPlum (magenta) and ICG (red) were detected at > 590 nm (ex: 560 ± 20 nm) and 832 ± 19 nm (ex: 769 ± 20 nm), respectively.
Fig. 5
Fig. 5. NIR fluorescence images of a breast-tumour bearing mouse, where an aqueous solution (200 μL) of ICG-labelled Kadcyla (1 mg mL−1) was intravenously injected via a tail vein of the mouse. A dotted circle in the bright field image of a mouse shows the position of a tumour. (a) NIR fluorescence images of the mouse were taken 0, 1, 3, and 5 days after the injection of ICG labelled Kadcyla. (b) Ex vivo image shows NIR fluorescence emission from an isolated breast tumour and organs. NIR fluorescence (em: 830 ± 20 nm) was observed by excitation at 760 nm. Exposure time was 30 s.
Fig. 6
Fig. 6. (a) Time course of experimental procedure for Kadcyla, ICG–EGFP (or mPlum)–Annexin V administration and fluorescence imaging. Kadcyla (200 μL, 1 mg mL−1) was intravenously injected via a tail vein of breast tumour-bearing mice. ICG–EGFP (or Plum)–Annexin V was injected to the mice three days after the injection of Kadcyla. (b) Bright filed and NIR fluorescence (ICG–EGFP–Annexin V) images of a mouse treated with and without Kadcyla. (c) Bright filed and NIR fluorescence (ICG–mPlum–Annexin V) images of a mouse treated with and without Kadcyla. Dotted circles show the positions of breast tumours in the mice. Ex vivo images show NIR fluorescence emissions from isolated breast tumours. NIR fluorescence (em: 830 ± 20 nm) was observed by excitation at 760 nm. Exposure time was 30 s.

Similar articles

Cited by

References

    1. Chau C. H. Steeg P. S. Figg W. D. Lancet. 2019;394:793–804. doi: 10.1016/S0140-6736(19)31774-X. - DOI - PubMed
    2. Lambert J. M. Berkenblit A. Annu. Rev. Med. 2018;69:191–207. doi: 10.1146/annurev-med-061516-121357. - DOI - PubMed
    1. Kim S. Cha K. Kim I. S. Curr. Mol. Imaging. 2012;1:55–62. doi: 10.2174/2211555211201010055. - DOI
    1. Jiang X. McKinley E. T. Xie J. Li H. Xu J. Gore J. C. Sci. Rep. 2019;9:9540. doi: 10.1038/s41598-019-45864-y. - DOI - PMC - PubMed
    1. Zeng W. Wang X. Xu P. Liu G. Eden H. S. Chen X. Theranotics. 2015;5:559–582. doi: 10.7150/thno.11548. - DOI - PMC - PubMed
    1. Vangestel C. Peeters M. Mees G. Oltenfreiter R. Boersma H. H. Elsinga P. H. Reutelingsperger C. Damme N. V. Spiegeleer B. D. Van de Wiele C. Mol. Imaging. 2011;10:340–358. doi: 10.2310/7290.2010.00058. - DOI - PubMed