

Simultaneous determination of methadone and morphine at a modified electrode with 3D β-MnO2 nanoflowers: application for pharmaceutical sample analysis
- PMID: 35517539
- PMCID: PMC9057335
- DOI: 10.1039/d0ra06480g
Simultaneous determination of methadone and morphine at a modified electrode with 3D β-MnO2 nanoflowers: application for pharmaceutical sample analysis
Abstract
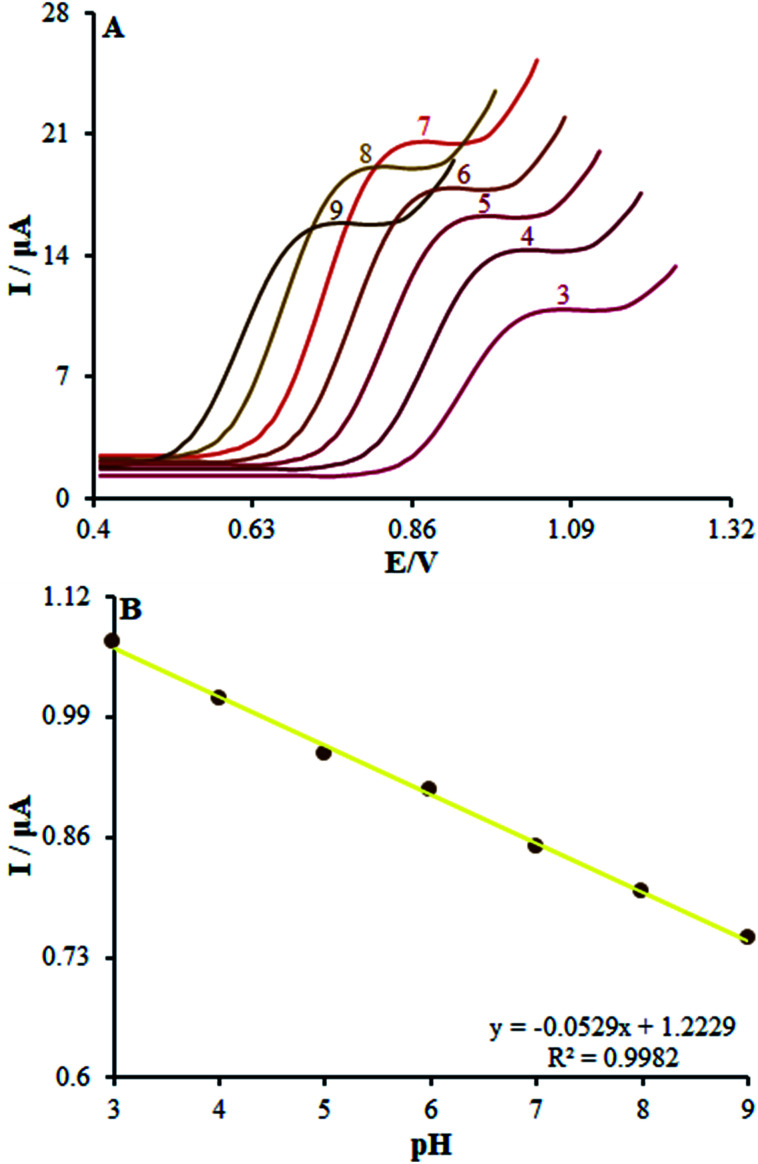
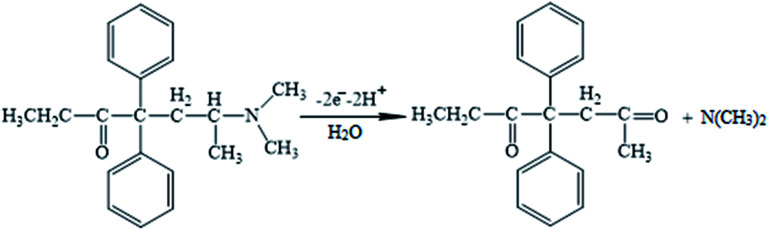
The present research synthesized manganese dioxide nano-flowers (β-MnO2-NF) via a simplified technique for electro-catalytic utilization. Moreover, morphological characteristics and X-ray analyses showed Mn in the oxide form with β-type crystallographic structure. In addition, the research proposed a new efficient electro-chemical sensor to detect methadone at the modified glassy carbon electrode (β-MnO2-NF/GCE). It has been found that oxidizing methadone is irreversible and shows a diffusion controlled procedure at the β-MnO2-NF/GCE. Moreover, β-MnO2-NF/GCE was considerably enhanced in the anodic peak current of methadone related to the separation of morphine and methadone overlapping voltammetric responses with probable difference of 510 mV. In addition, a linear increase has been observed between the catalytic peak currents gained by the differential pulse voltammetry (DPV) of morphine and methadone and their concentrations in the range between 0.1-200.0 μM and 0.1-250.0 μM, respectively. Furthermore, the limits of detection (LOD) for methadone and morphine were found to be 5.6 nM and 8.3 nM, respectively. It has been found that our electrode could have a successful application for detecting methadone and morphine in the drug dose form, urine, and saliva samples. Thus, this condition demonstrated that β-MnO2-NF/GCE displays good analytical performances for the detection of methadone.
This journal is © The Royal Society of Chemistry.
Conflict of interest statement
The authors declare that there are no conflicts of interest.
Figures


Similar articles
-
Electrocatalytic oxidation and selective determination of an opioid analgesic methadone in the presence of acetaminophen at a glassy carbon electrode modified with functionalized multi-walled carbon nanotubes: application for human urine, saliva and pharmaceutical samples analysis.Colloids Surf B Biointerfaces. 2013 Sep 1;109:287-93. doi: 10.1016/j.colsurfb.2013.03.055. Epub 2013 Apr 17. Colloids Surf B Biointerfaces. 2013. PMID: 23680846
-
Electrochemical Sensor for Simple and Sensitive Determination of Hydroquinone in Water Samples Using Modified Glassy Carbon Electrode.Biomedicines. 2023 Jun 30;11(7):1869. doi: 10.3390/biomedicines11071869. Biomedicines. 2023. PMID: 37509508 Free PMC article.
-
Simultaneous determination of theobromine, theophylline, and caffeine using a modified electrode with petal-like MnO2 nanostructure.Talanta. 2021 Jan 15;222:121563. doi: 10.1016/j.talanta.2020.121563. Epub 2020 Aug 27. Talanta. 2021. PMID: 33167259
-
An Efficient Voltammetric Sensor Based on Graphene Oxide-Decorated Binary Transition Metal Oxides Bi2O3/MnO2 for Trace Determination of Lead Ions.Nanomaterials (Basel). 2022 Sep 23;12(19):3317. doi: 10.3390/nano12193317. Nanomaterials (Basel). 2022. PMID: 36234444 Free PMC article.
-
Simultaneous voltammetric determination of hydroquinone and catechol by using a glassy carbon electrode modified with a ternary nanocomposite prepared from oxidized multiwalled carbon nanotubes, manganese dioxide and manganese ferrite.Mikrochim Acta. 2019 Aug 23;186(9):643. doi: 10.1007/s00604-019-3750-9. Mikrochim Acta. 2019. PMID: 31444572
Cited by
-
Analytical Approaches for the Determination of Buprenorphine, Methadone and Their Metabolites in Biological Matrices.Molecules. 2022 Aug 16;27(16):5211. doi: 10.3390/molecules27165211. Molecules. 2022. PMID: 36014451 Free PMC article. Review.
-
High-performance electrochemical detection of carbendazim using NiCo2O4 nanoflower/graphene nanocomposite for food and environmental safety.Mikrochim Acta. 2025 Aug 11;192(9):584. doi: 10.1007/s00604-025-07455-9. Mikrochim Acta. 2025. PMID: 40788424
-
Fe3O4-Cu-BTC/MWCNTs modified electrodes for real-time chlorine monitoring in aqueous solution.Mikrochim Acta. 2025 Jan 31;192(2):117. doi: 10.1007/s00604-025-06969-6. Mikrochim Acta. 2025. PMID: 39890628
-
Detection of caffeic acid in honey using carbon paste electrode modified by copper (II) oxide (CuO) nanoparticles.Sci Rep. 2025 Jul 2;15(1):23397. doi: 10.1038/s41598-025-04245-4. Sci Rep. 2025. PMID: 40603340 Free PMC article.
-
Electrochemical DNA-nano biosensor for the detection of Goserelin as anticancer drug using modified pencil graphite electrode.Front Oncol. 2024 May 1;14:1321557. doi: 10.3389/fonc.2024.1321557. eCollection 2024. Front Oncol. 2024. PMID: 38751811 Free PMC article.
References
-
- Rajaei M. Foroughi M. M. Jahani Sh. Shahidi Zandi M. Hassani Nadiki H. J. Mol. Liq. 2019;284:462. doi: 10.1016/j.molliq.2019.03.135. - DOI
LinkOut - more resources
Full Text Sources