. 2019 Jan 2;9(2):576-591.
doi: 10.1039/c8ra08319c.

Photovoltaic cells as a highly efficient system for biomedical and electrochemical surface-enhanced Raman spectroscopy analysis

Affiliations

Photovoltaic cells as a highly efficient system for biomedical and electrochemical surface-enhanced Raman spectroscopy analysis

K Niciński et al. RSC Adv. .

Abstract

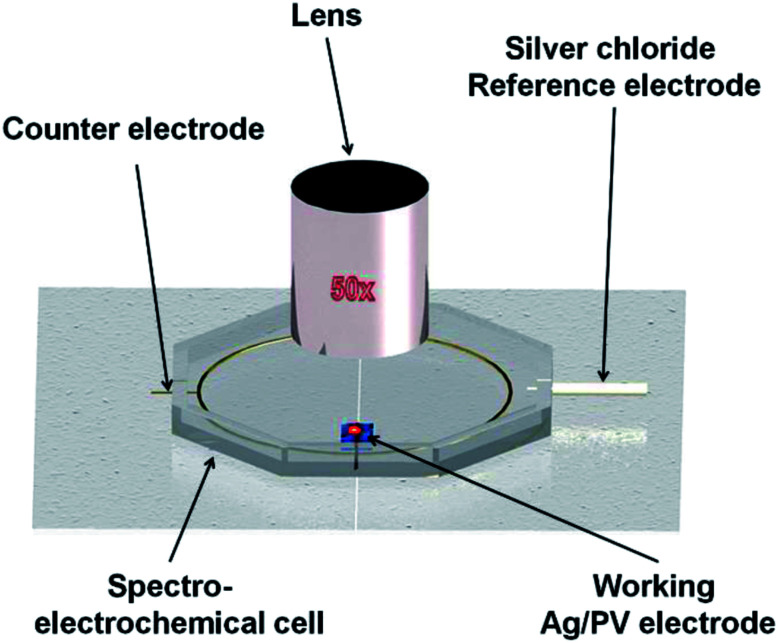
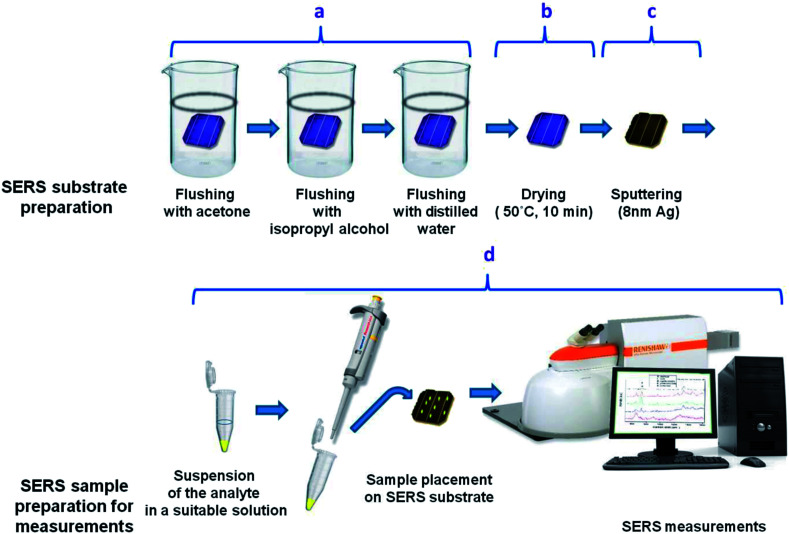
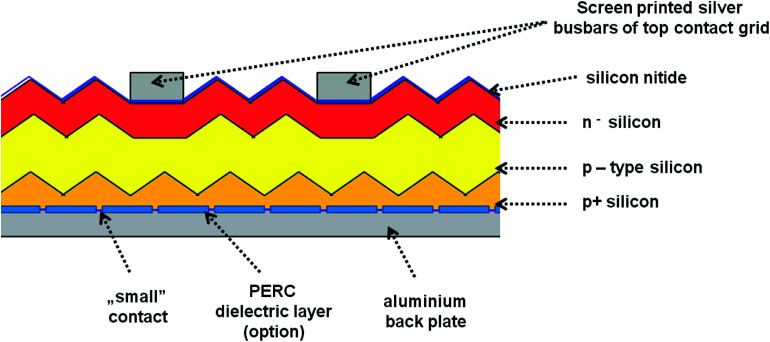
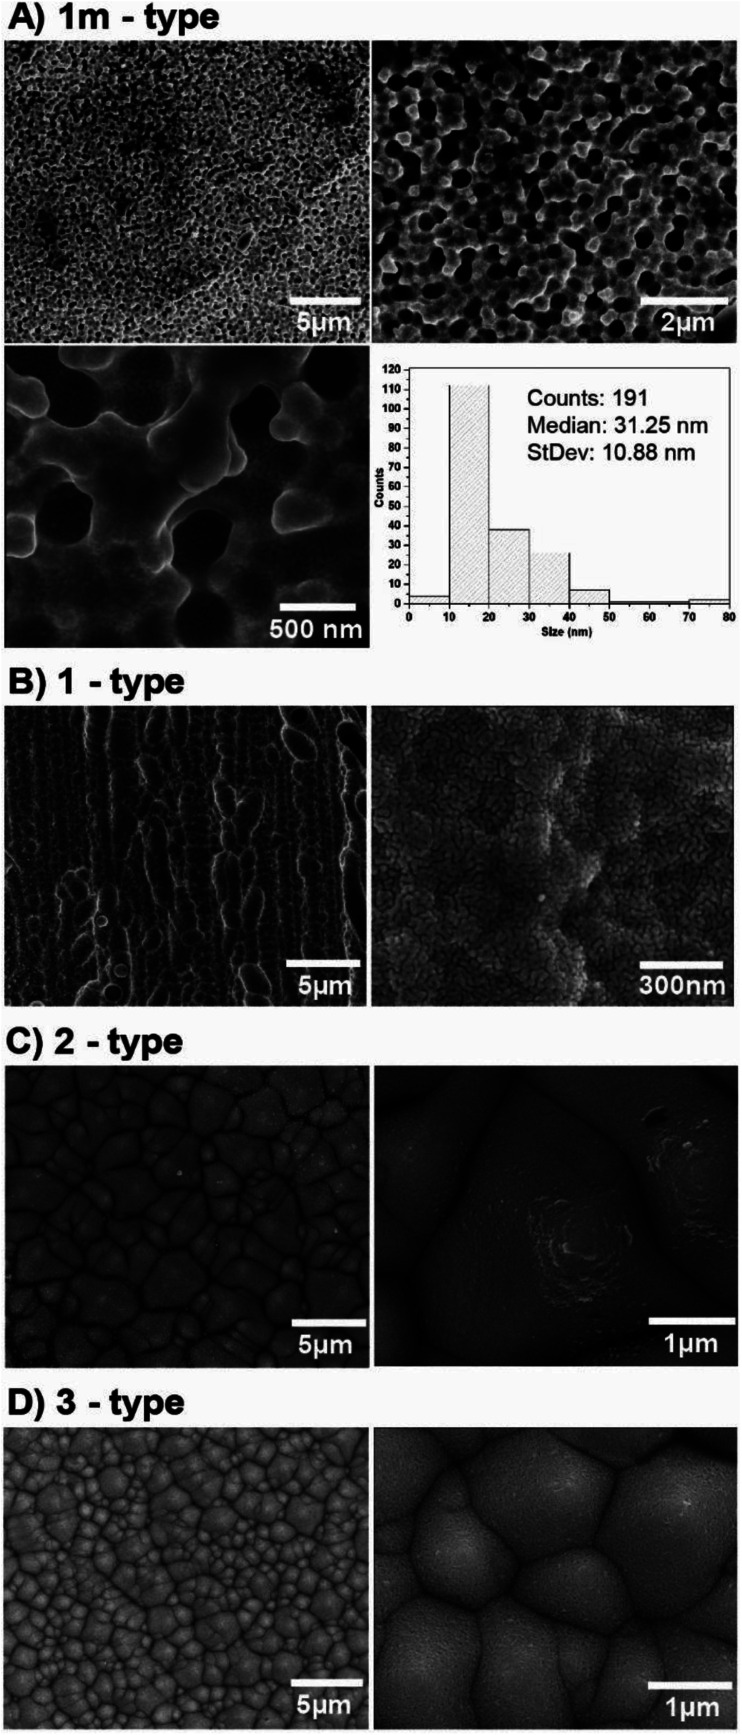
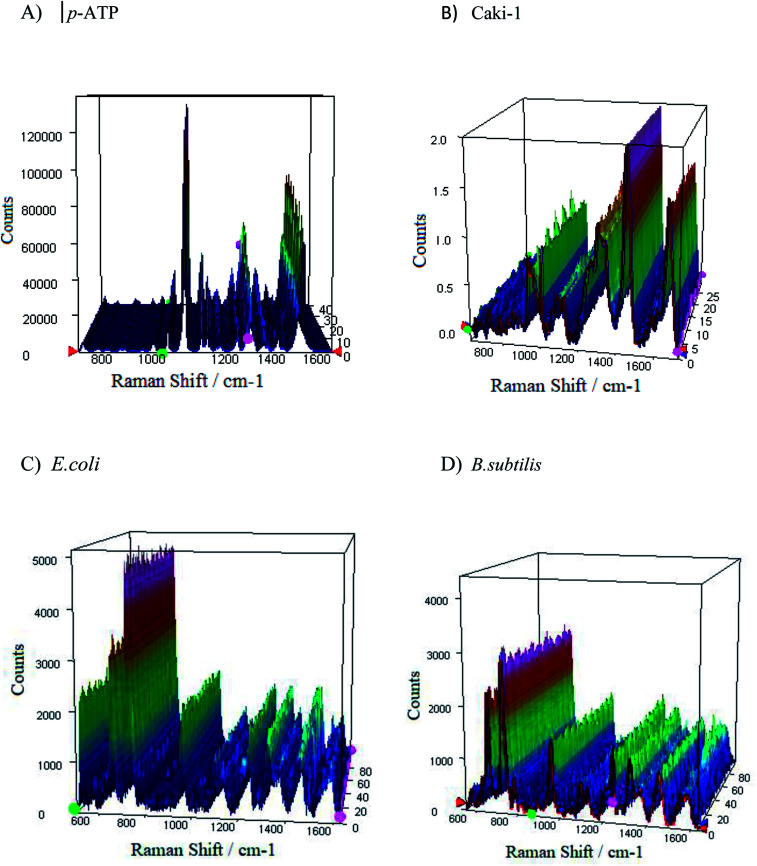
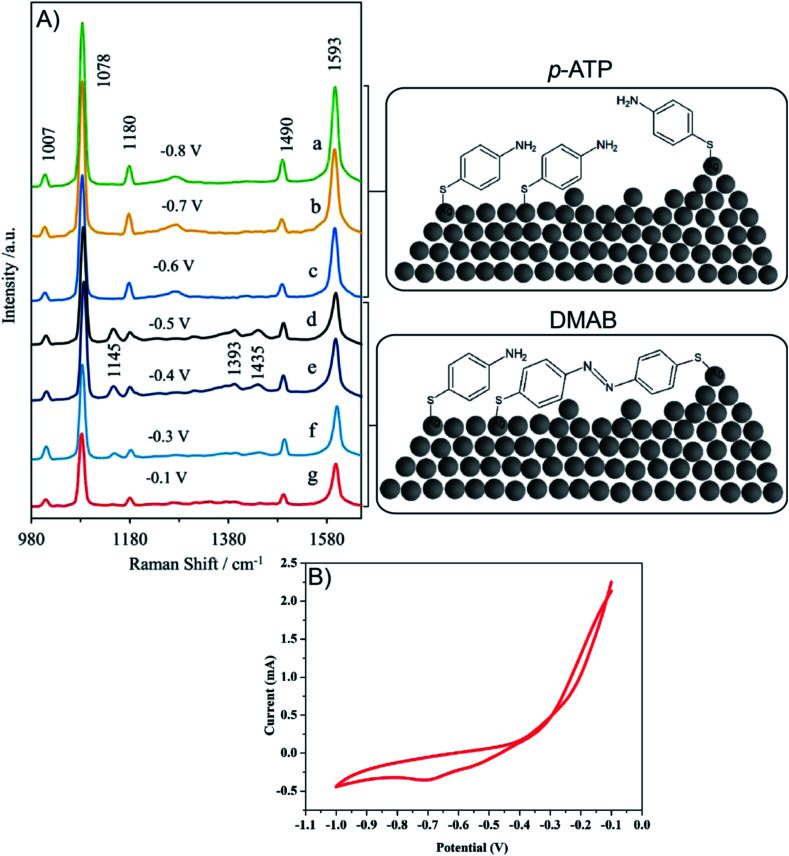
Surface-enhanced Raman scattering (SERS) has been intensively used recently as a highly sensitive, non-destructive, chemical specific, and label-free technique for a variety of studies. Here, we present a novel SERS substrate for: (i) the standard ultra-trace analysis, (ii) detection of whole microorganisms, and (iii) spectroelectrochemical measurements. The integration of electrochemistry and SERS spectroscopy is a powerful approach for in situ investigation of the structural changes of adsorbed molecules, their redox properties, and for studying the intermediates of the reactions. We have developed a conductive SERS platform based on photovoltaic materials (PV) covered with a thin layer of silver, especially useful in electrochemical SERS analysis. These substrates named Ag/PV presented in this study combine crucial spectroscopic features such as high sensitivity, reproducibility, specificity, and chemical/physical stability. The designed substrates permit the label-free identification and differentiation of cancer cells (renal carcinoma) and pathogens (Escherichia coli and Bacillus subtilis). In addition, the developed SERS platform was adopted as the working electrode in an electrochemical SERS approach for p-aminothiophenol (p-ATP) studies. The capability to monitor in real-time the electrochemical changes spectro-electro-chemically has great potential for broadening the application of SERS.


Conflict of interest statement

There are no conflicts to declare.

Figures

Fig. 1
Fig. 1. Schematic view of the spectroelectrochemical setup used for analysis. In situ electrochemical SERS spectra were performed in a microfluidic chamber integrated with three electrodes.
Fig. 2
Fig. 2. Scheme of the preparation of SERS substrate, sample deposition, and measurement. Main steps involve cleaning (a), drying (b), and sputtering of a thin layer of silver (c). Then the bacterial ad cancer cells were deposited on SERS-platform; finally, measurement takes place (d).
Fig. 3
Fig. 3. The general organization of the PV devices.
Fig. 4
Fig. 4. SEM images at different magnifications of Ag/PV SERS-active substrates sputtered with 8 nm layer of silver via PVD technique.
Fig. 5
Fig. 5. (A) The SERS intensity bands at 1078 cm−1 with varying Ag metal thickness (5 nm, 8 nm, 10 nm, 15 nm and 20 nm) for all analyzed SERS surfaces (named 1m, 1, 2, and 3-type, respectively). (B) The intensity of the band at 1078 cm−1 for the most sensitive 1m-type SERS substrate.
Fig. 6
Fig. 6. SERS spectra of p-ATP recorded from four different SERS substrates (a–d) with varying morphology of PV systems (according to parameters described in Table 1). Experimental conditions: 5 mW of 785 nm excitation, 2 × 2 seconds acquisition time. Insert presents the normal Raman spectrum p-ATP in neat solid state. Each SERS spectrum was averaged from forty measurements in different places on the SERS surface.
Fig. 7
Fig. 7. (A) The SERS spectra of B. subtilis and (B) Caki-1 recorded on Ag/PV substrate in mapping mode from 40 different points in mapping mode (10 × 20 μm). For all spectra, excitation wavelength was at 785 nm, laser power was 1.5 mW, and acquisition time was only 3 seconds.
Fig. 8
Fig. 8. SEM images of (A) E. coli and (B) Caki-1 placed onto 1m-type Ag/PV surfaces.
Fig. 9
Fig. 9. The representative SERS spectra of (A and B) p-ATP of concentration 10−6 M, (C) E. coli, and (D) B. subtilis recorded from 40 different spots on the SERS surface (type 1m) using mapping mode.
Fig. 10
Fig. 10. (A) Potential dependent SERS spectra of p-ATP adsorbed onto Ag/PV SERS surface from 10−6 M solution of p-ATP in 0.1 M NaClO4, “in situ” measurements. (B) Cyclic voltammogram recorded during spectroelectrochemical measurements.

Similar articles

Cited by

References

    1. Storhoff J. J. Elghanian R. Mucic R. C. Mirkin C. A. Letsinger R. L. J. Am. Chem. Soc. 1998;120:1959. doi: 10.1021/ja972332i. - DOI
    1. Cao Y. C. Jin R. Mirkin C. A. Science. 2002;297:1536. doi: 10.1126/science.297.5586.1536. - DOI - PubMed
    1. Graham D. Faulds K. Chem. Soc. Rev. 2008;37:1042. doi: 10.1039/B707941A. - DOI - PubMed
    1. Stevenson R., Faulds K. and Graham D., in Surface Enhanced Raman Spectroscopy, ed. S. Schlücker, Wiley-VCH Verlag GmbH & Co. KGaA, 2011, p. 241
    1. Faulds K. McKenzie F. Smith W. E. Graham D. Angew. Chem., Int. Ed. Engl. 2007;46:1829. doi: 10.1002/anie.200604265. - DOI - PubMed