Review
. 2019 Mar 18;9(16):8778-8881.
doi: 10.1039/c8ra09577a. eCollection 2019 Mar 15.

A review on graphene-based nanocomposites for electrochemical and fluorescent biosensors

Affiliations
Review

A review on graphene-based nanocomposites for electrochemical and fluorescent biosensors

Siva Kumar Krishnan et al. RSC Adv. .

Abstract

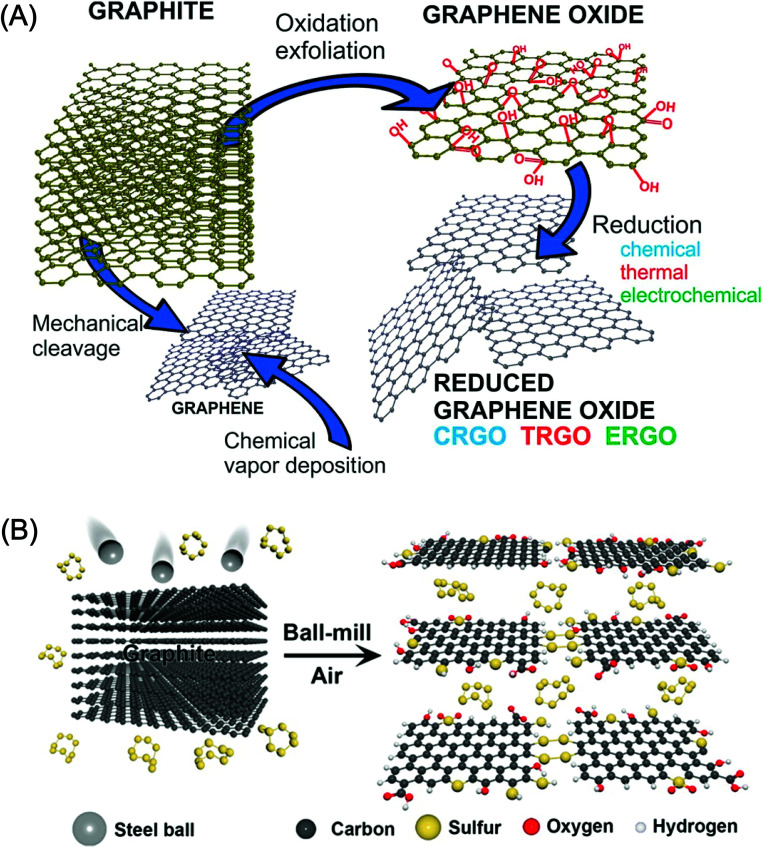
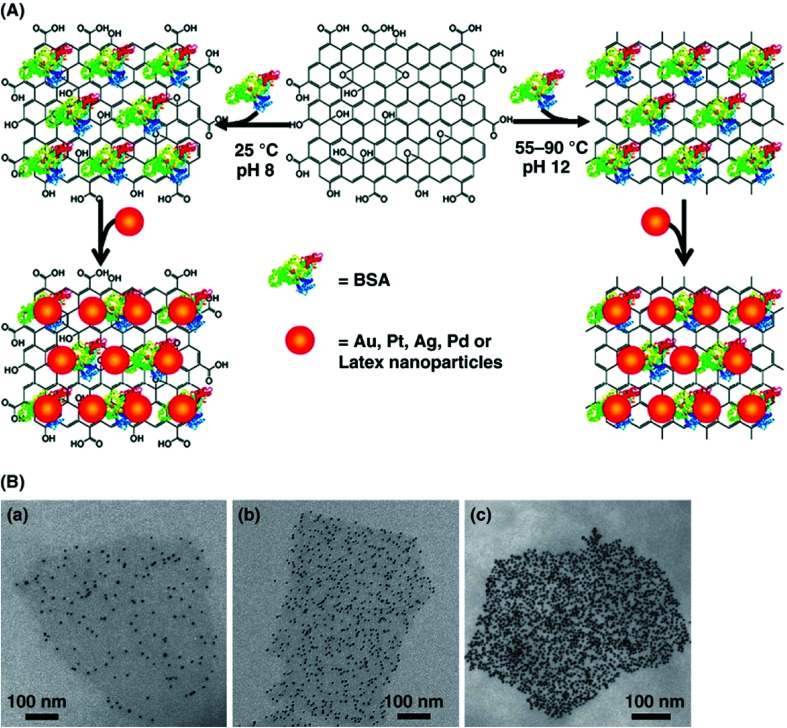
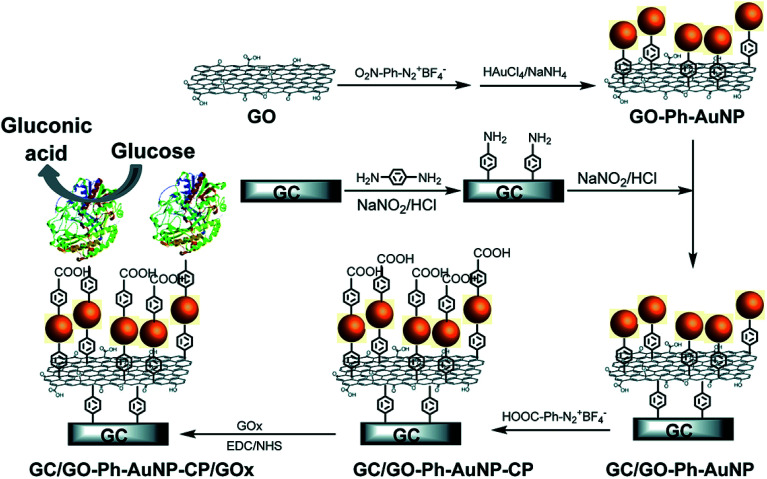
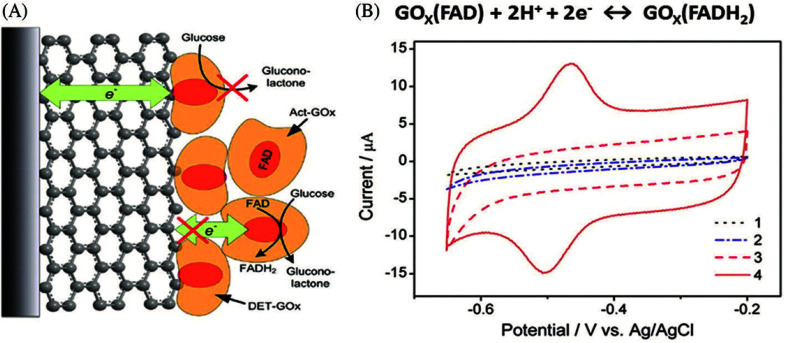
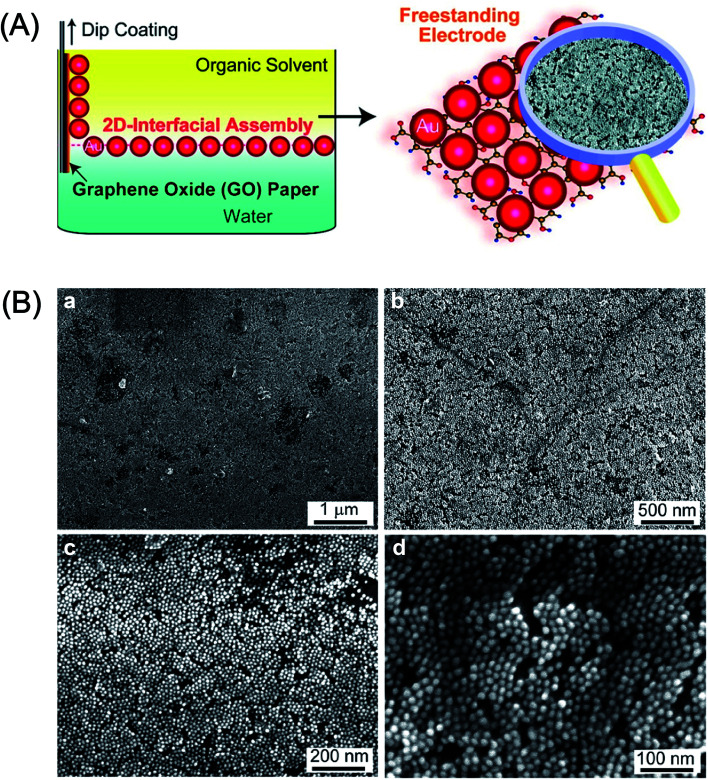
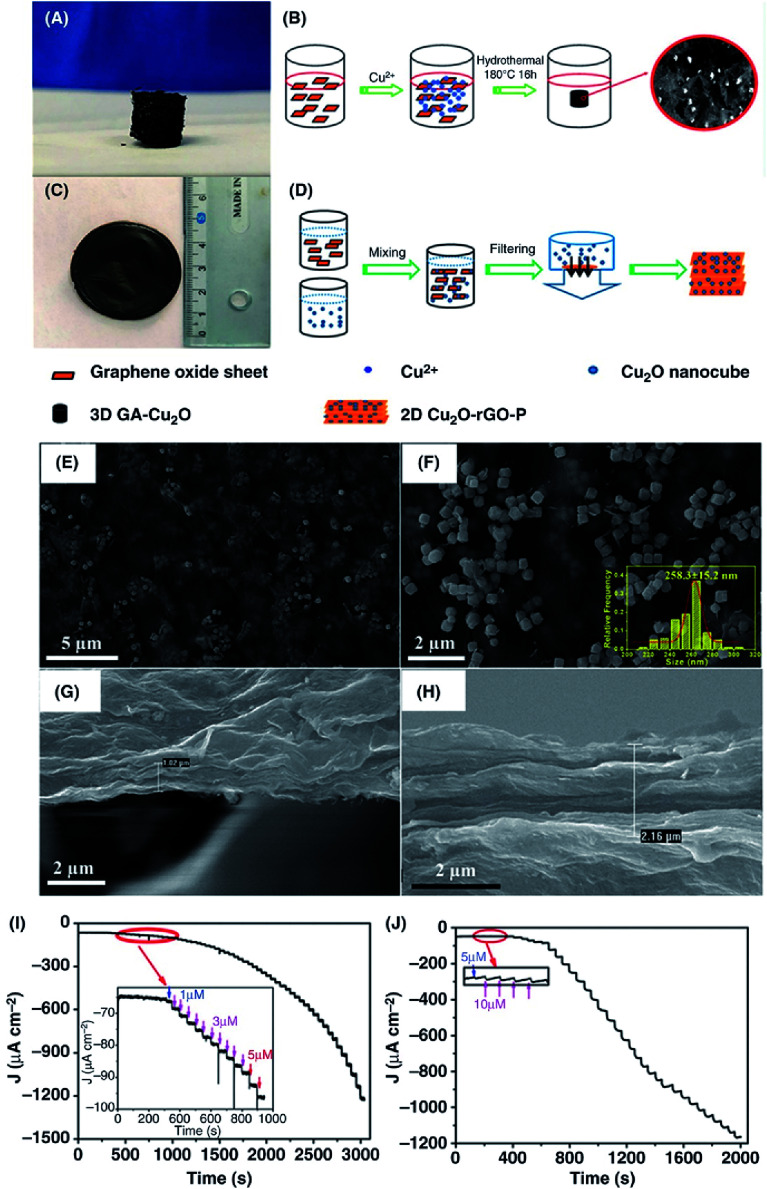
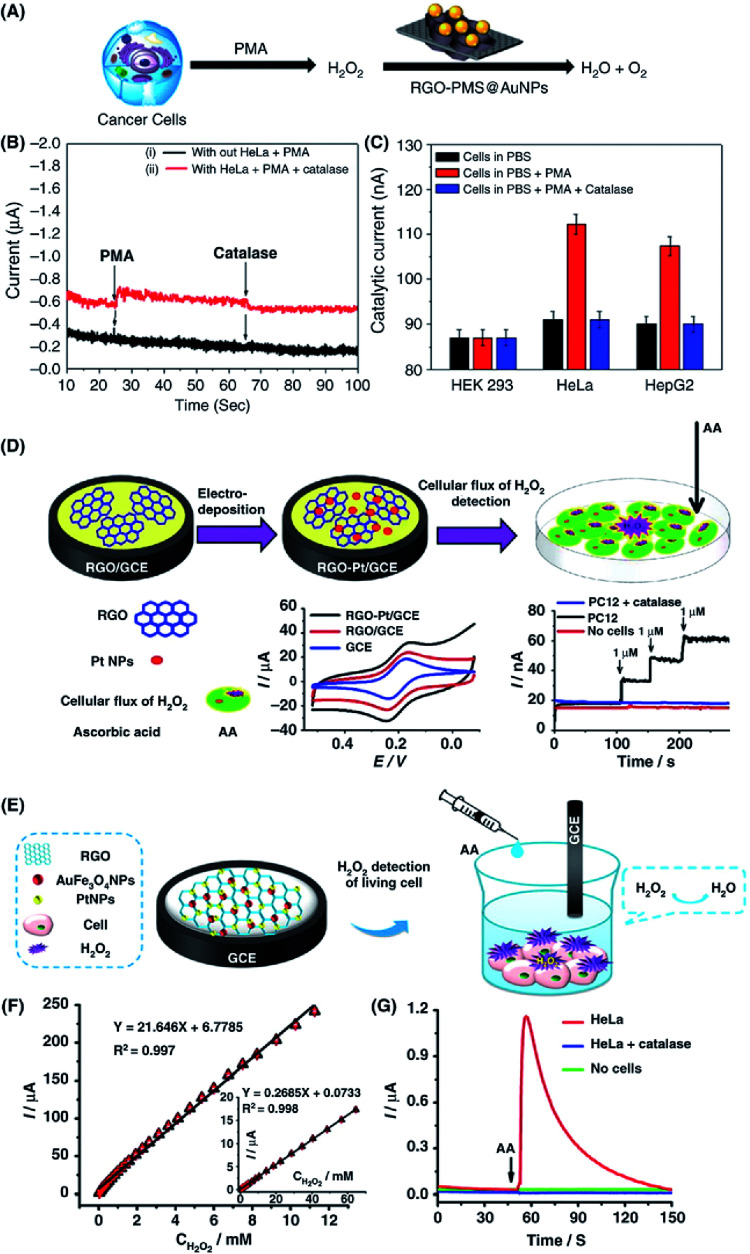
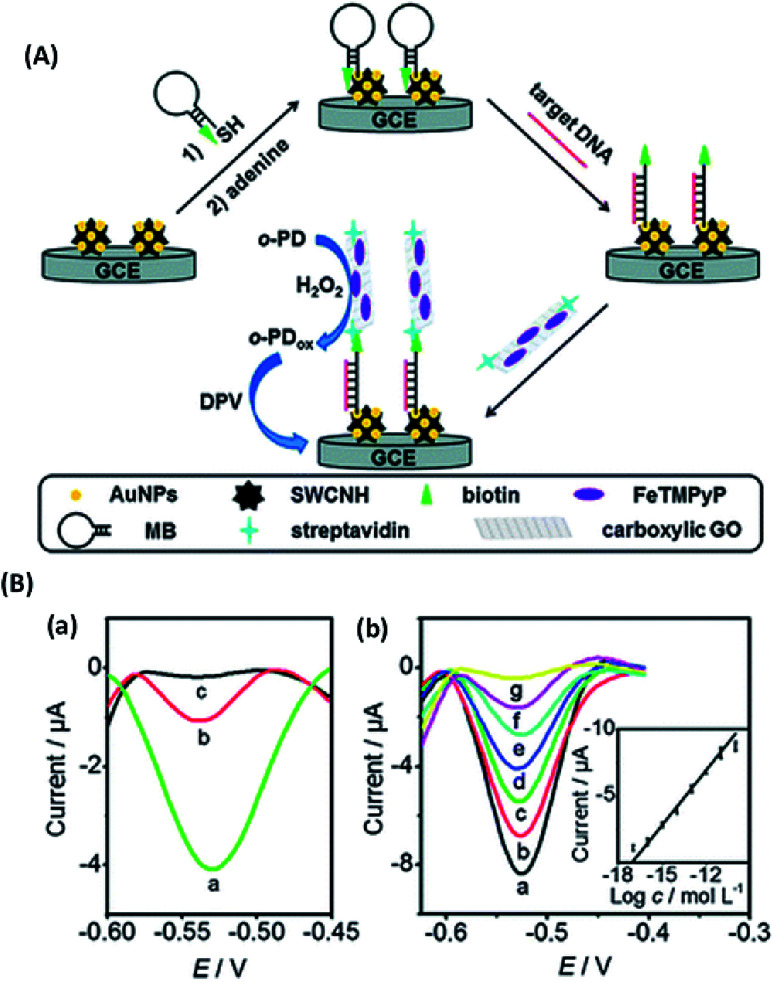
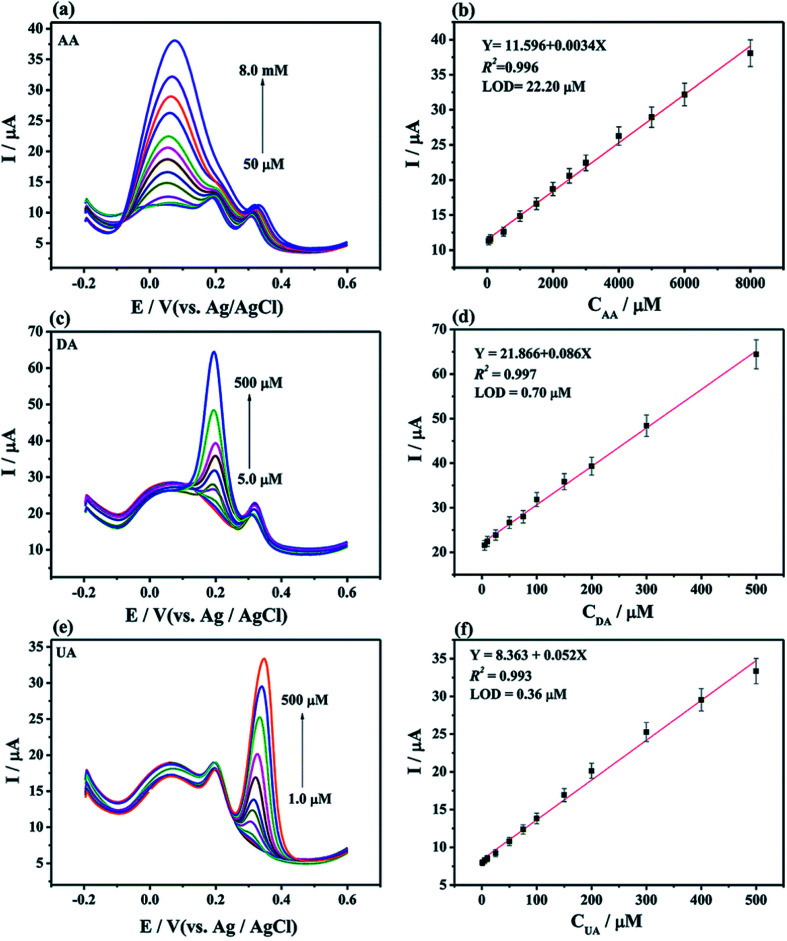
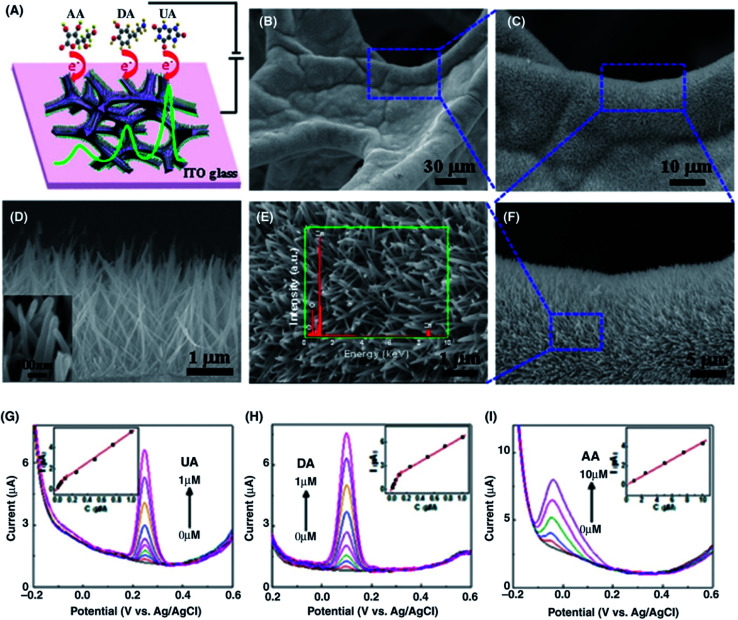
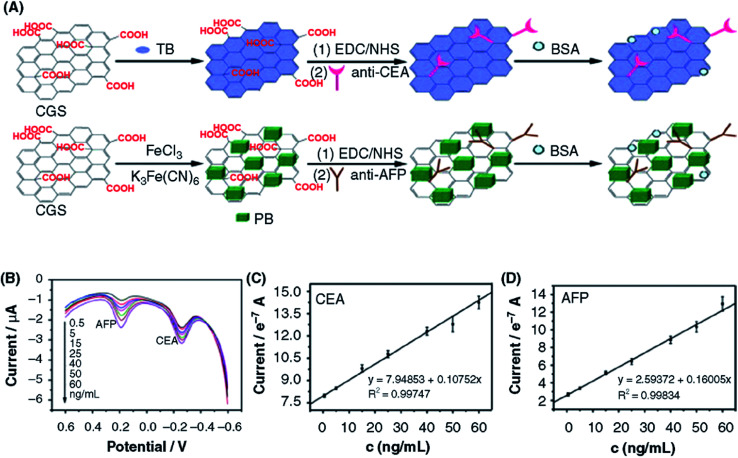
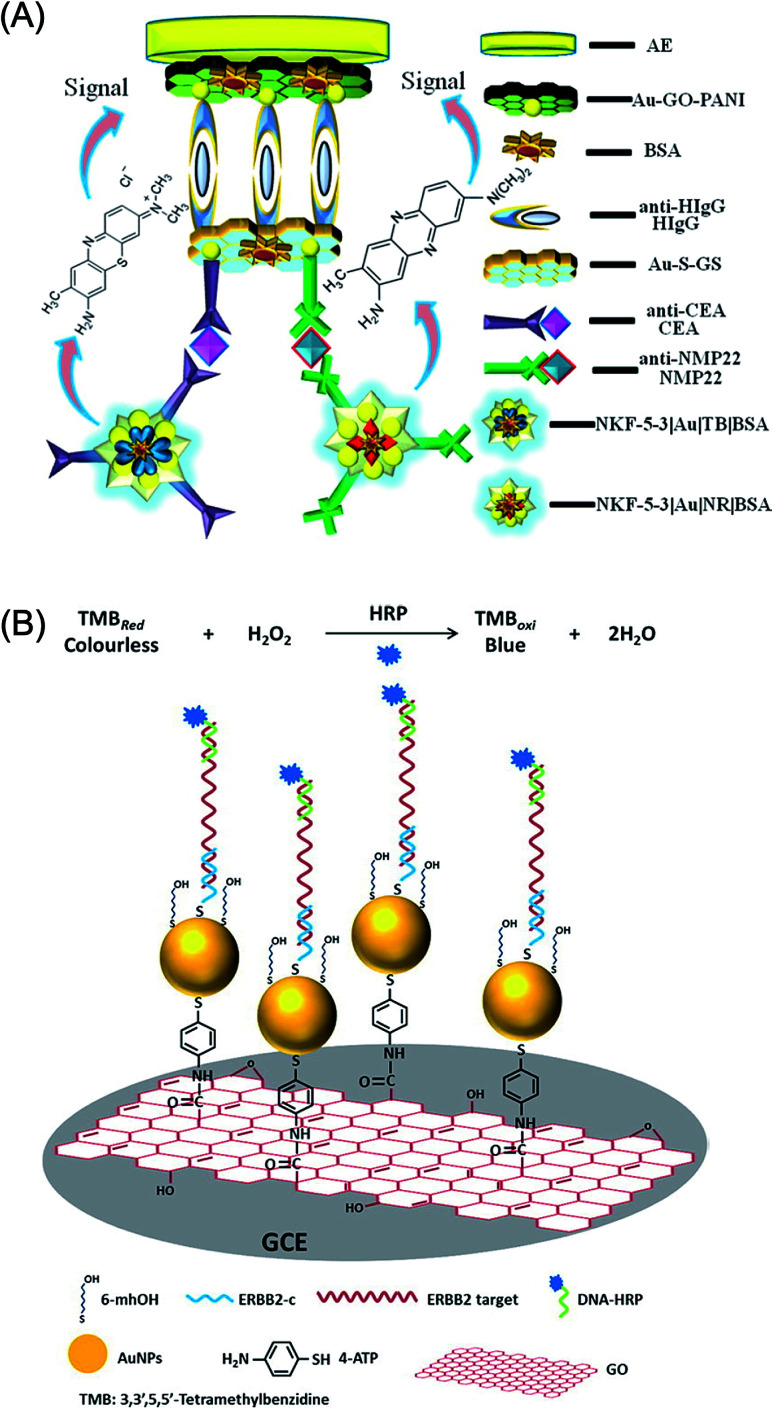
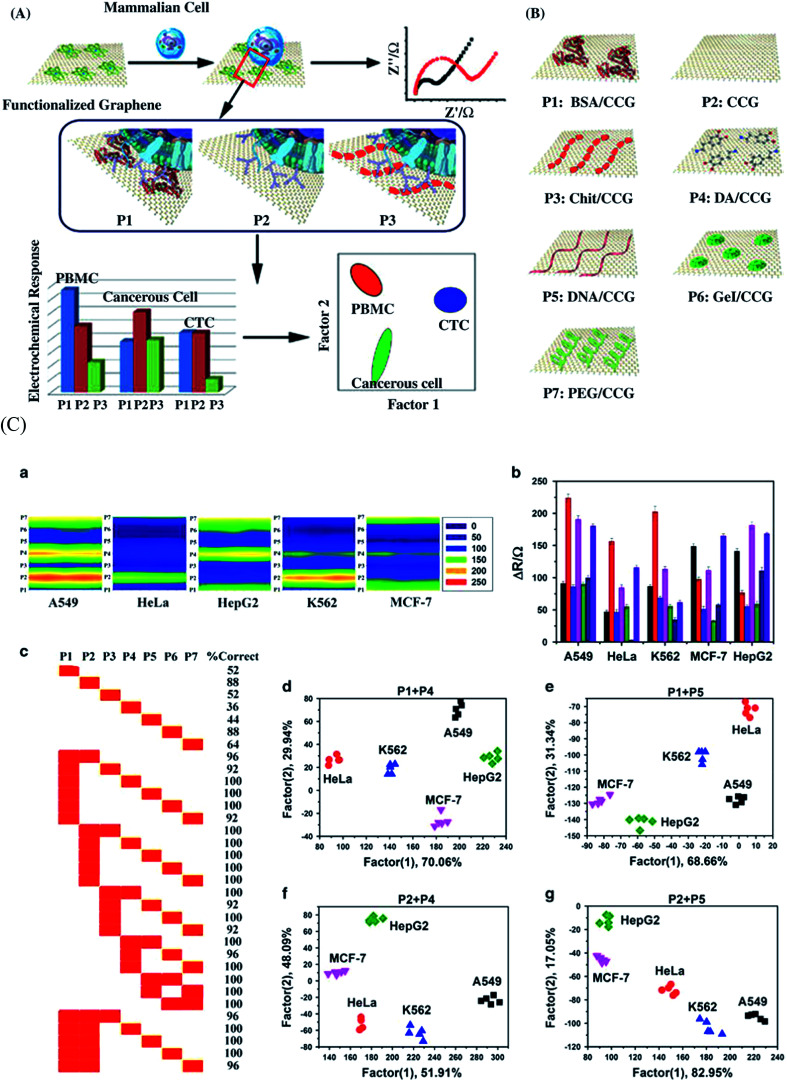
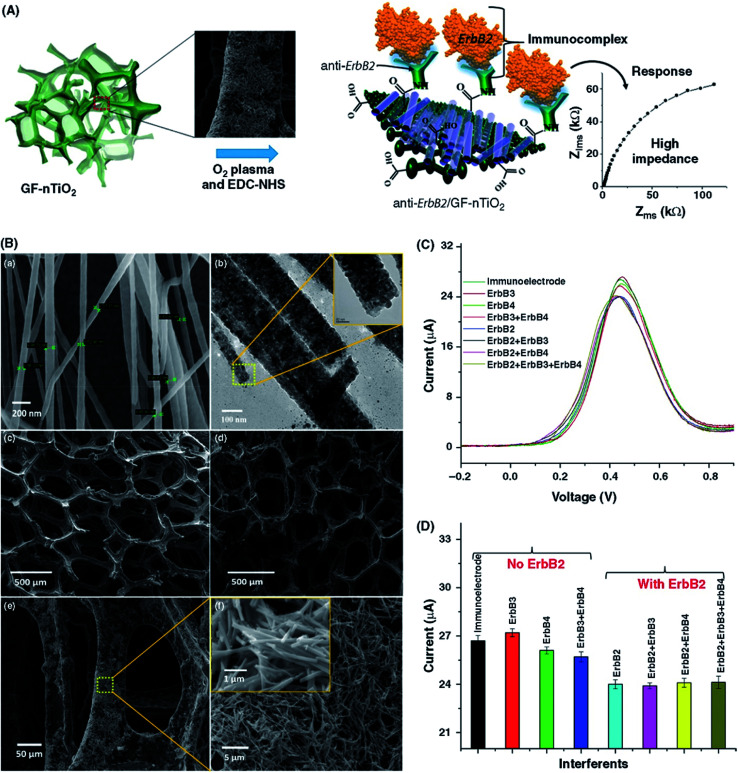
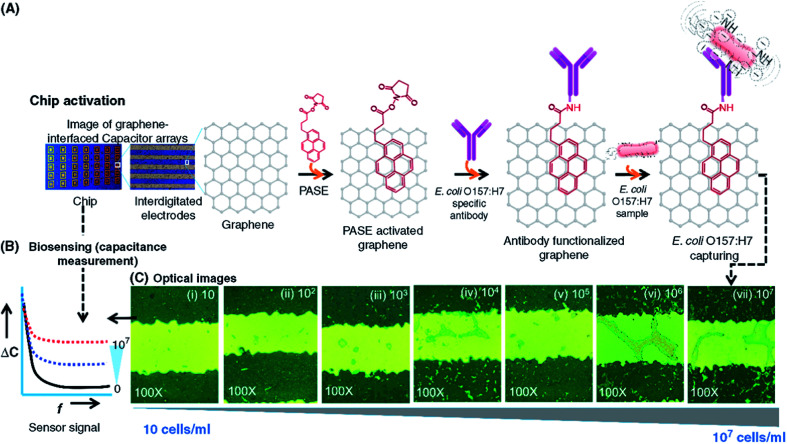
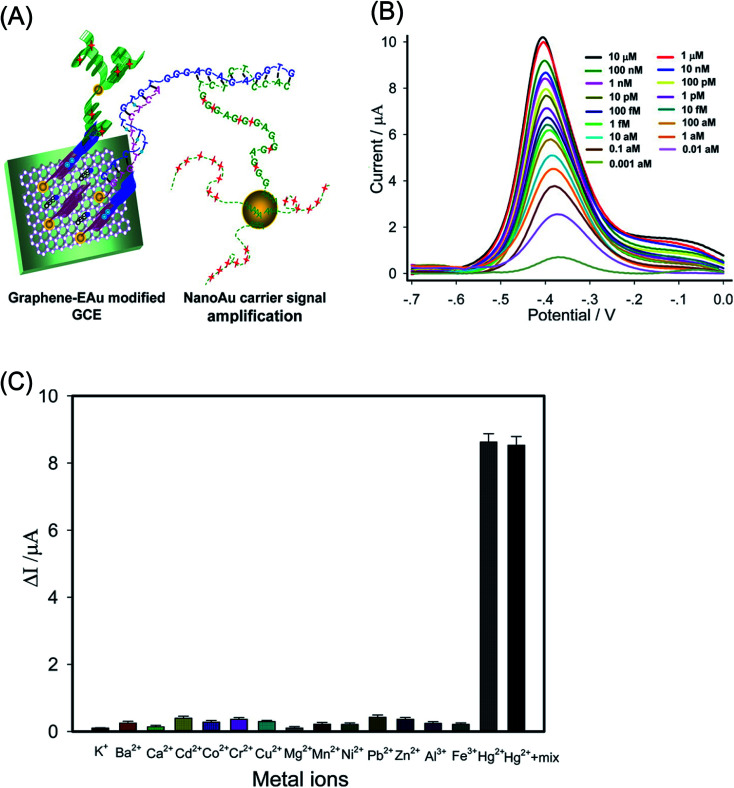
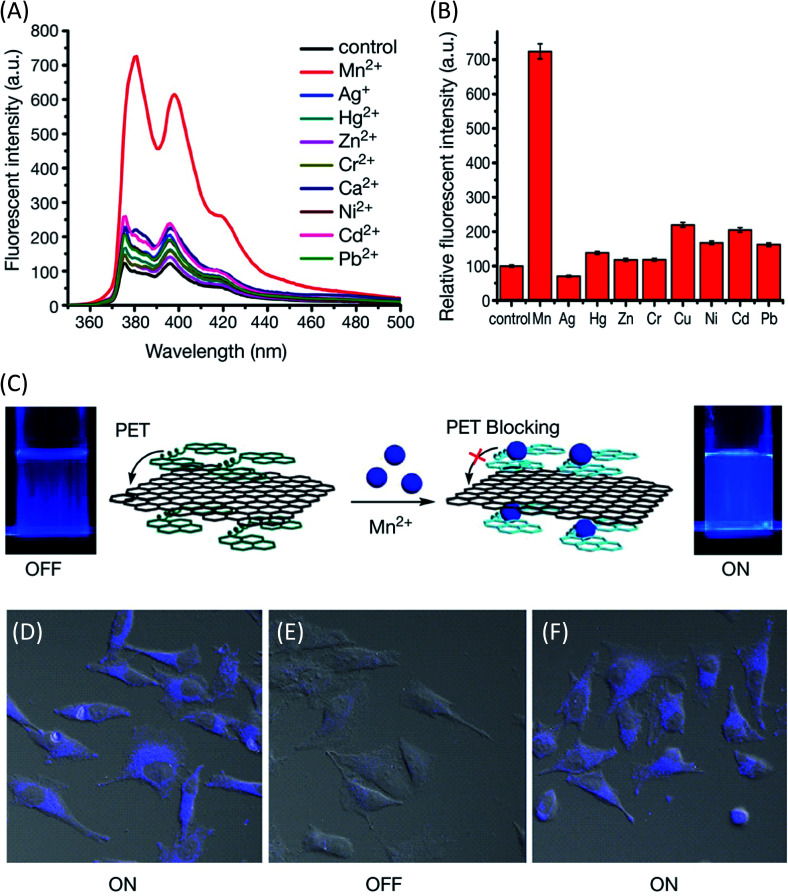
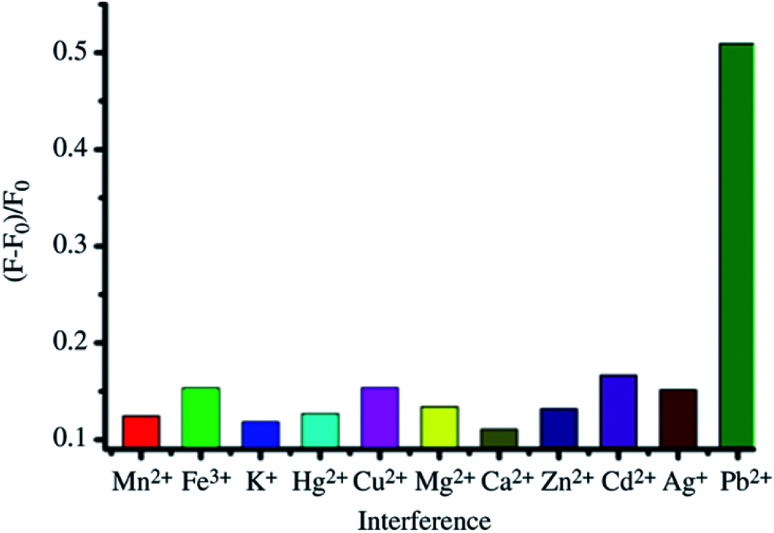
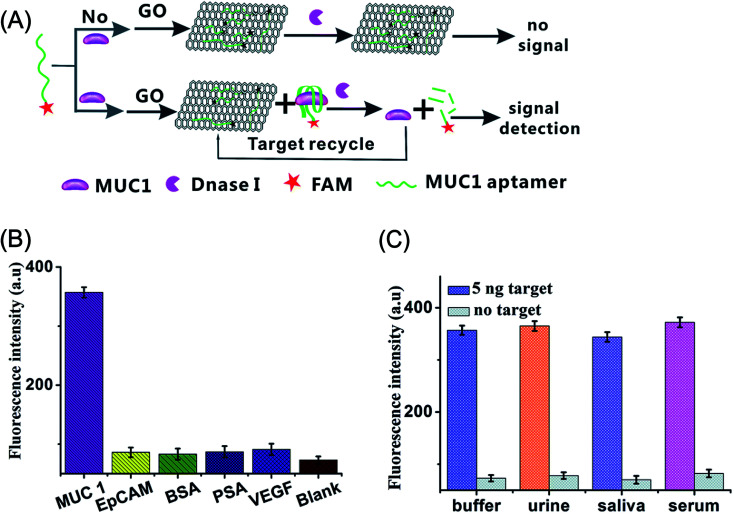
Biosensors with high sensitivity, selectivity and a low limit of detection, reaching nano/picomolar concentrations of biomolecules, are important to the medical sciences and healthcare industry for evaluating physiological and metabolic parameters. Over the last decade, different nanomaterials have been exploited to design highly efficient biosensors for the detection of analyte biomolecules. The discovery of graphene has spectacularly accelerated research on fabricating low-cost electrode materials because of its unique physical properties, including high specific surface area, high carrier mobility, high electrical conductivity, flexibility, and optical transparency. Graphene and its oxygenated derivatives, including graphene oxide (GO) and reduced graphene oxide (rGO), are becoming an important class of nanomaterials in the field of biosensors. The presence of oxygenated functional groups makes GO nanosheets strongly hydrophilic, facilitating chemical functionalization. Graphene, GO and rGO nanosheets can be easily combined with various types of inorganic nanoparticles, including metals, metal oxides, semiconducting nanoparticles, quantum dots, organic polymers and biomolecules, to create a diverse range of graphene-based nanocomposites with enhanced sensitivity for biosensor applications. This review summarizes the advances in two-dimensional (2D) and three-dimensional (3D) graphene-based nanocomposites as emerging electrochemical and fluorescent biosensing platforms for the detection of a wide range of biomolecules with enhanced sensitivity, selectivity and a low limit of detection. The biofunctionalization and nanocomposite formation processes of graphene-based materials and their unique properties, surface functionalization, enzyme immobilization strategies, covalent immobilization, physical adsorption, biointeractions and direct electron transfer (DET) processes are discussed in connection with the design and fabrication of biosensors. The enzymatic and nonenzymatic reactions on graphene-based nanocomposite surfaces for glucose- and cholesterol-related electrochemical biosensors are analyzed. This review covers a very broad range of graphene-based electrochemical and fluorescent biosensors for the detection of glucose, cholesterol, hydrogen peroxide (H2O2), nucleic acids (DNA/RNA), genes, enzymes, cofactors nicotinamide adenine dinucleotide (NADH) and adenosine triphosphate (ATP), dopamine (DA), ascorbic acid (AA), uric acid (UA), cancer biomarkers, pathogenic microorganisms, food toxins, toxic heavy metal ions, mycotoxins, and pesticides. The sensitivity and selectivity of graphene-based electrochemical and fluorescent biosensors are also examined with respect to interfering analytes present in biological systems. Finally, the future outlook for the development of graphene based biosensing technology is outlined.


Conflict of interest statement

The authors declare no competing financial interest.

Figures

Fig. 1
Fig. 1. (A) Schematic illustration of possible methods for the preparation of graphene, GO and rGO from graphite using mechanical cleavage, exfoliation, CVD and reduction methods including chemical, thermal and electrochemical methods. [Reprinted with permission from ref. 89, J. Filip and J. Tkac, Is Graphene Worth Using in Biofuel Cells?, Electrochim. Acta, 2014, 136, 340–354. Copyright© Elsevier.] (B) A schematic representation of the physical cracking of graphite-flake into functionalized graphene derivatives using a ball milling technique. [Reprinted with permission from ref. 90, J. Xu, J. Shui, J. Wang, M. Wang, H.-K. Liu, S. X. Dou, I.-Y. Jeon, J.-M. Seo, J.-B. Baek and L. Dai, Sulfur–Graphene Nanostructured Cathodes via Ball-Milling for High-Performance Lithium–Sulfur Batteries, ACS Nano, 2014, 8, 10920–10930. Copyright© American Chemical Society.]
Fig. 2
Fig. 2. (A) Schematic illustration of the reduction and decoration of GO nanosheets using BSA protein to develop a new platform for biosensing. (B) TEM images show AuNPs-decorated BSA-GO nanosheets with well-controlled AuNPs densities by increasing the concentration of BSA protein from 0.5 mg mL−1 to 20 mg mL−1 during BSA-GO hybrid formation. In (c) the density of AuNPs was further increased by the addition of 0.1 M NaCl to the BSA-GO assembly in (b). NaCl was not used for (a) and (b). [Reprinted with permission from ref. 63, J. Liu, S. Fu, B. Yuan, Y. Li and Z. Deng, Toward a Universal “Adhesive Nanosheet” for the Assembly of Multiple Nanoparticles Based on a Protein-Induced Reduction/Decoration of Graphene Oxide, J. Am. Chem. Soc., 2010, 132, 7279–7281. Copyright© American Chemical Society.]
Fig. 3
Fig. 3. The schematic fabrication of glucose biosensor using AuNP-decorated GO nanosheet. AuNPs were decorated onto GO nanosheet via a benzene bridge using aryldiazonium salt chemistry (GO-Ph-AuNPs) which was thereafter attached to 4-aminophenyl modified GC electrode. The GC/GO-Ph-AuNPs was further functionalized with 4-carboxyphenyl (CP) before covalently attaching GOx via amide bonds to form GC/GO-Ph-AuNPs-CP/GOx based glucose sensor. [Reprinted with permission from ref. 175, M. Qi, Y. Zhang, C. Cao, Y. Lu and G. Liu, Increased Sensitivity of Extracellular Glucose Monitoring Based on AuNP Decorated GO Nanocomposites, RSC Adv., 2016, 6, 39180–39187. Copyright© The Royal Society of Chemistry.]
Fig. 4
Fig. 4. (A) Schematic illustration of DET with GOx adsorption on the ERCGR/GOx/GCE. (B) CVs of the different modified GCEs; (1) bare GCE, (2) GOx/GCE, (3) ERGO/GCE, and (4) GOx/ERGO/GCE in N2-saturated phosphate buffer solution (PBS). [Reprinted with permission from ref. 190, B. Liang, X. Guo, L. Fang, Y. Hu, G. Yang, Q. Zhu, J. Wei and X. Ye, Study of Direct Electron Transfer and Enzyme Activity of Glucose Oxidase on Graphene Surface, Electrochem. Commun., 2015, 50, 1–5. Copyright© Elsevier.]
Fig. 5
Fig. 5. Schematic illustration of the immobilization of GOx enzymes on graphene via pyrene and the subsequent fabrication of single- and multi-layered enzyme electrodes. [Reprinted with permission from ref. 196, J. Liu, N. Kong, A. Li, X. Luo, L. Cui, R. Wang and S. Feng, Graphene Bridged Enzyme Electrodes for Glucose Biosensing Application, Analyst, 2013, 138, 2567–2575. Copyright© Royal Society of Chemistry.]
Fig. 6
Fig. 6. Schematic illustration of the covalent immobilization of Azure A and GOx on the CHO-IL/EC-rGO/SPE platform. [Reprinted with permission from ref. 199, D. Manoj, K. Theyagarajan, D. Saravanakumar, S. Senthilkumar and K. Thenmozhi, Aldehyde Functionalized Ionic Liquid on Electrochemically Reduced Graphene Oxide as a Versatile Platform for Covalent Immobilization of Biomolecules and Biosensing, Biosens. Bioelectron., 2018, 103, 104–112. Copyright© Elsevier.]
Fig. 7
Fig. 7. (A) Schematic illustration of the preparation of 3D-GR-based enzymatic glucose biosensors using CS-mediated electrodeposition. (SWNT = SWCNT.). (B and C) SEM images of 3D-GR foam with low and high magnification. (D and E) SEM images of Fc-CS/SWCNTs/GOx composite film electrodeposited on 3D graphene with low and high magnification. (F) CV curves of the (a) 3D-GR, (b) CS/GOx/3D-GR, (c) Fc-CS/GOx/3D-GR and (d) Fc-CS/SWCNTs/GOx/3D-GR electrodes in PBS (0.1 M, pH 7.0) at a scan rate of 100 mV s−1. (G) Amperometric response of the Fc-CS/SWCNTs/GOx/3D-GR electrode upon the successively added glucose to stirred PBS (0.1 M, pH 7.0) at 0.4 V. Inset (a) shows the magnified curve from 50 to 850 s. Inset (b) shows the calibration plot of the current as a function of the glucose concentration. [Reprinted with permission from ref. 184, J. Liu, X. Wang, T. Wang, D. Li, F. Xi, J. Wang and E. Wang, Functionalization of Monolithic and Porous Three-Dimensional Graphene by One-Step Chitosan Electrodeposition for Enzymatic Biosensor, ACS Appl. Mater. Interfaces, 2014, 6, 19997–20002. Copyright© American Chemical Society.]
Fig. 8
Fig. 8. (A) Schematic illustration of the tannic acid (TA)-assisted preparation of rGO/PtNPs/GOx-GCE-based biosensors for glucose sensing. (B) CV curves of different electrodes; (a) GOx/GCE, (b) GO-GOx/GCE, (c) rGO-GOx/GCE, and (d) rGO-PtNPs-GOx/GCE in deoxygenated PBS (0.1 M, pH 7.4) at a scan rate of 100 mV s−1. (C) CV curves of rGO-PtNPs-GOx/GCE recorded in O2-saturated PBS (0.1 M) at a scan rate of 100 mV s−1 as a function of different concentrations of glucose (0–12 mM). [Reprinted with permission from ref. 187, B. Akkaya, B. Çakiroğlu and M. Özacar, Tannic Acid-Reduced Graphene Oxide Deposited with Pt Nanoparticles for Switchable Bioelectronics and Biosensors Based on Direct Electrochemistry, ACS Sustainable Chem. Eng., 2018, 6, 3805–3814. Copyright© American Chemical Society.]
Fig. 9
Fig. 9. (A) Schematic representation of the formation of PtNiNPs/rGO nanocomposites by electrochemical reduction method. (B) SEM images of the GO nanosheet, PtNiNPs/ERGO, PtNi NPs/CRGO nanocomposites and PtNiNPs/SWCNTs nanocomposites. (C) Amperometric response of PtNiNPs/ERGO/GCE after adding 0.5, 1.0, and 2.0 mM glucose and the calibration curve (inset). (D) Influence of interfering bioanalytes including 0.5 mM ascorbic acid (AA), 0.1 mM uric acid (UA), 0.1 mM urea, 0.5 mM AAP, and 0.5 mM fructose to 5.0 mM glucose at the PtNiNPs/ERGO/GCE. Here, electrochemically and chemically reduced GO are ERGO and CRGO, respectively. [Reprinted with permission from ref. 229, H. Gao, F. Xiao, C. B. Ching and H. Duan, One-Step Electrochemical Synthesis of PtNi Nanoparticle-Graphene Nanocomposites for Nonenzymatic Amperometric Glucose Detection, ACS Appl. Mater. Interfaces, 2011, 3, 3049–3057. Copyright© American Chemical Society.]
Fig. 10
Fig. 10. (A) Schematic illustration of the preparation of graphene-encapsulated CuNPs. (B) DPV responses of graphene-encapsulated CuNPs composites at different concentrations (from a to k: 1– 2000 μM) of glucose in 0.1 M NaOH. (C) Linear relationship between the peak current and the glucose concentration. (D) Normalized DPV peak current of the CuNPs@rGO composites with the addition of 1.0 mM glucose as the control and in the presence of 2.0 mM uric acid (UA), 2.0 mM dopamine (DA), and 2.0 mM ascorbic acid (AA) as interferents and their corresponding mixtures. The CuNPs@rGO composite-based sensor shows high selectivity for detecting glucose. [Reprinted with permission from ref. 279, Q. Zhang, Q. Luo, Z. Qin, L. Liu, Z. Wu, B. Shen and W. Hu, Self-Assembly of Graphene-Encapsulated Cu Composites for Nonenzymatic Glucose Sensing, ACS Omega, 2018, 3, 3420–3428. Copyright© American Chemical Society.]
Fig. 11
Fig. 11. Structural characterization of Cu–Co/rGO nanostructures on a pencil graphite electrode (PGE). (A) SEM images of Cu/PGE (a–c), Cu–Co/PGE (d and e), and Cu–Co/rGO/PGE (f–h). White arrows indicate interspaces with voids, and yellow solid and dotted lines indicate the primary and secondary trunks of dendrites and rGO, respectively. (B) Glucose-sensing performance of the Cu–Co/rGO-PGE-modified electrode. (a) Amperometric response after the successive addition of glucose at 0.4 V vs. Ag/AgCl. (Inset) Amperometric response of Cu–Co/rGO/PGE toward low glucose concentration ranges between 1–100 μM. (C) Calibration plot of Cu–Co/rGO/PGE amperometric responses with respect to glucose concentration. [Reprinted with permission from ref. 277, K. J. Babu, S. Sheet, Y. S. Lee and G. G. Kumar, Three-Dimensional Dendrite Cu–Co/Reduced Graphene Oxide Architectures on a Disposable Pencil Graphite Electrode as an Electrochemical Sensor for Nonenzymatic Glucose Detection, ACS Sustainable Chem. Eng., 2018, 6, 1909–1918. Copyright© American Chemical Society.]
Fig. 12
Fig. 12. (A) Scheme illustrating the biosensor based on Fc-GO on SPE for the detection of cholesterol. (B) CV response of the Fc-GO based biosensors in the (a) absence and (b) presence of cholesterol ester, uric acid and glucose. (C) Amperometric response of the Fc-GO based biosensor for detecting cholesterol and uric acid. Arrows indicate the aliquots of (a) cholesterol ester and (b) uric acids, added at regular intervals into PBS (pH 7.2). Insets show the corresponding calibration plots. [Reprinted with permission from ref. 284, R. S. Dey and C. R. Raj, Redox-Functionalized Graphene Oxide Architecture for the Development of Amperometric Biosensing Platform, ACS Appl. Mater. Interfaces, 2013, 5, 4791–4798. Copyright© American Chemical Society.]
Fig. 13
Fig. 13. (A) Schematic illustration of the preparation of 2D-assembly of AuNPs on GO paper to develop hybrid electrodes. (B) Different magnifications of the SEM images of 2D-assembly of AuNPs transferred on the GO paper where AuNPs formed a highly packed monolayer on the GO paper. [Reprinted with permission from ref. 323, F. Xiao, J. Song, H. Gao, X. Zan, R. Xu and H. Duan, Coating Graphene Paper with 2D-Assembly of Electrocatalytic Nanoparticles: A Modular Approach toward High-Performance Flexible Electrodes, ACS Nano, 2012, 6, 100–110. Copyright© American Chemical Society.]
Fig. 14
Fig. 14. (A) Photographs of 3D-Cu2O-GA fabricated through a freeze-drying process and paper-like 2D Cu2O-rGO-P nanostructure obtained by filtration (C). Schematic illustration of the synthesis of 3D Cu2O-GA composite (B) and paper-like 2D Cu2O-rGO-P nanostructure (D). (E and F) SEM images obtained at different magnifications of the 2D Cu2O-rGO paper without thermal annealing. Inset in (F) shows the dispersion of Cu2O nanocubes in the rGO paper in terms of the size distribution histogram. SEM images of the 2D Cu2O-rGO paper before (G) and after (H) thermal annealing. Amperometric curves of 3D Cu2O-GA/GC composite electrode (I) and paper-like 2D Cu2O-rGO-P/GC composite electrode (J) with H2O2 addition in N2-saturated 0.1 M PBS solution (pH = 7.0) at the applied potential of −0.4 V. The insets in (I) and (J) show the magnified cathodic current response measured at the low H2O2 concentrations. [Reprinted with permission from ref. 364, C. Cheng, C. Zhang, X. Gao, Z. Zhuang, C. Du and W. Chen, 3D Network and 2D Paper of Reduced Graphene Oxide/Cu2O Composite for Electrochemical Sensing of Hydrogen Peroxide, Anal. Chem., 2018, 90, 1983–1991. Copyright© American Chemical Society.]
Fig. 15
Fig. 15. Different graphene nanocomposite-based electrode materials for the detection of H2O2 in living cells. (A) Schematic representation of the in vitro detection of H2O2 using the rGO-PMS@AuNP/GCE. (B) Amperometric response of the rGO-PMS@AuNPs/GC electrode (i) with and (ii) without of HeLa cells after sequential addition of PMA and catalase to 0.1 M PBS at −0.75 V. (C) Cellular assay comparison of H2O2 detection for HEK 293, HeLa, and HepG2 cells. [Reprinted with permission from ref. 330, S. K. Maji, S. Sreejith, A. K. Mandal, X. Ma and Y. Zhao, Immobilizing Gold Nanoparticles in Mesoporous Silica Covered Reduced Graphene Oxide: A Hybrid Material for Cancer Cell Detection through Hydrogen Peroxide Sensing, ACS Appl. Mater. Interfaces, 2014, 6, 13648–13656. Copyright© American Chemical Society.] (D) Schematic of the rGO-PtNPs-modified GCE for detecting H2O2 efflux from cells stimulated with ascorbic acid (AA). [Reprinted with permission from ref. 381, Y. Zhang, X. Bai, X. Wang, K.-K. Shiu, Y. Zhu and H. Jiang, Highly Sensitive Graphene–Pt Nanocomposites Amperometric Biosensor and Its Application in Living Cell H2O2 Detection, Anal. Chem., 2014, 86, 9459–9465. Copyright© American Chemical Society.] (E) Schematic of the rGO/AuFe3O4/PtNPs-modified GCE for detecting H2O2 efflux from cells stimulated with ascorbic acid (AA). (F) Amperometric response upon adding AA in PBS containing HeLa cells at 0 V (red), containing HeLa cells and catalases (blue), or without cells (green). (G) Amount of H2O2 released by L02, HeLa, HepG2, and U87 cells stimulated by 1 μM AA. [Reprinted with permission from ref. 382, L. Wang, Y. Zhang, C. Cheng, X. Liu, H. Jiang and X. Wang, Highly Sensitive Electrochemical Biosensor for Evaluation of Oxidative Stress Based on the Nanointerface of Graphene Nanocomposites Blended with Gold, Fe3O4, and Platinum Nanoparticles, ACS Appl. Mater. Interfaces, 2015, 7, 18441–18449. Copyright© American Chemical Society.]
Fig. 16
Fig. 16. (A) Schematic illustration of graphene/ferric porphyrin (FeTMPyP) based electrochemical sensor for DNA detection as a horseradish peroxidase (HRP)-mimicking trace label. (B) DPV responses at target DNA concentration of 10 fM with (a) FeTMPyP–streptavidin–GO bioconjugate, (b) HRP–streptavidin–GO as trace label, and (c) in the absence of trace label. DPV curves at different target DNA concentrations of (a) 10 pM, (b) 1 pM, (c) 100 fM, (d) 10 fM, (e) 1.0 fM, (f) 100 aM and (g) 0 aM. Inset is a plot of peak versus the logarithm of target DNA concentration. [Reprinted with permission from ref. 433, Q. Wang, J. Lei, S. Deng, L. Zhang and H. Ju, Graphene-Supported Ferric Porphyrin as a Peroxidase Mimic for Electrochemical DNA Biosensing, Chem. Commun., 2013, 49, 916–918. Copyright© Royal Society of Chemistry.]
Fig. 17
Fig. 17. Schematic illustration of the LbL-assembled AuNP-decorated first-generation (G1) PD with rGO core as a label-free biosensor with controllable 3D nanoarchitecture for the rapid detection of DNA hybridization. [Reprinted with permission from ref. 436, K. Jayakumar, M. B. Camarada, V. Dharuman, R. Rajesh, R. Venkatesan, H. Ju, M. Maniraj, A. Rai, S. R. Barman and Y. Wen, Layer-by-Layer-Assembled AuNPs-Decorated First-Generation Poly(amidoamine) Dendrimer with Reduced Graphene Oxide Core as Highly Sensitive Biosensing Platform with Controllable 3D Nanoarchitecture for Rapid Voltammetric Analysis of Ultratrace DNA Hybridization, ACS Appl. Mater. Interfaces, 2018, 10, 21541–21555. Copyright© American Chemical Society.]
Fig. 18
Fig. 18. (A) Schematic illustration for the biosensor fabrication process using graphene/gold nanoclusters (GR/AuNCs) modified GCE with exonuclease III (Exo III) supported target DNA recycling for detecting HIV DNA. (A) The initial signal obtained from the capture probe. (B) DPV of AuNCs/GR/GCE biosensor after incubation with 100 nM, 10 nM, 1 nM, 100 pM, 10 pM, 1 pM, 100 fM, 10 fM, 1 fM, and 0.1 fM concentrations of target HIV gene and Exo III. (C) The linear relationship showing current change as a function of the logarithmic value of the target DNA concentration within a 0.1 fM to 100 nM range. [Reprinted with permission from ref. 399, Y. Wang, X. Bai, W. Wen, X. Zhang and S. Wang, Ultrasensitive Electrochemical Biosensor for HIV Gene Detection Based on Graphene Stabilized Gold Nanoclusters with Exonuclease Amplification, ACS Appl. Mater. Interfaces, 2015, 7, 18872–18879. Copyright© American Chemical Society.]
Fig. 19
Fig. 19. Schematic illustration of the multiply amplified electrochemical biosensor for target DNA detection. (A) Fabrication steps of the functionalized AuNCs/GR nanohybrids; (B) principle of the target-triggered Exo III-assisted cascade target recycling; (C) construction of the biosensor using functionalized AuNC/GR nanohybrids as the interfaces of the enzyme-catalyzed silver deposition reaction. [Reprinted with permission from ref. 401, W. Wang, T. Bao, X. Zeng, H. Xiong, W. Wen, X. Zhang and S. Wang, Ultrasensitive Electrochemical DNA Biosensor Based on Functionalized Gold Clusters/Graphene Nanohybrids Coupling with Exonuclease III-Aided Cascade Target Recycling, Biosens. Bioelectron., 2017, 91, 183–189. Copyright© Elsevier.]
Fig. 20
Fig. 20. (A) Fabrication of the iron nitride (FeN) NPs/NG core–shell hybrid. (B) NADH measurement mechanism involving a FeN NPs/NG core–shell hybrid-based electrode. (C) Selective amperometric response of FeN NPs/NG/GCE after adding (a) 1 mM NADH, (b) 1 mM glucose, (c) UA, (d) dopamine, and (e) AA at an applied potential of +0.35 V. (D) Stability of FeN NPs/NG/GCE based sensor in 0.5 mM NADH at an applied potential of +0.35 V showing 96.18% of initial current retention after 1000 cycles. [Reprinted with permission from ref. 429, J. Balamurugan, T. D. Thanh, N. H. Kim and J. H. Lee, Facile Fabrication of FeN Nanoparticles/Nitrogen-Doped Graphene Core-Shell Hybrid and Its Use as a Platform for NADH Detection in Human Blood Serum, Biosens. Bioelectron., 2016, 83, 68–76. Copyright© Elsevier.]
Fig. 21
Fig. 21. (a) DPV curves of MoS2-PANI/rGO/GCE electrode and (b) the plot of peak currents as a function of AA concentration from 50 μM to 8.0 mM containing 75 μM DA and 75 μM UA. (c) DPV curves of MoS2-PANI/rGO/GCE and (d) the plot of peak currents as a function of DA concentration from 5.0 to 500 μM containing 1.0 mM AA and 75 μM UA. (e) DPV curves of MoS2-PANI/rGO/GCE and (f) the plot of peak currents as a function of UA concentration from 1.0 μM to 500 μM containing 1.0 mM AA and 75 μM DA. The solution used in the measurements was 0.1 M PBS (pH 7.0) containing 0.1 M KCl. [Reprinted with permission from ref. 458, S. Li, Y. Ma, Y. Liu, G. Xin, M. Wang, Z. Zhang and Z. Liu, Electrochemical sensor based on a three dimensional nanostructured MoS2 nanosphere-PANI/reduced graphene oxide composite for simultaneous detection of ascorbic acid, dopamine, and uric acid, RSC Adv., 2019, 9, 2997–3003. Copyright© Royal Society of Chemistry.]
Fig. 22
Fig. 22. (A) Schematic illustration of the ZnO NWAs/GF electrode for the simultaneous detection of UA, DA, and AA. (B–E) SEM images of the ZnO NWAs assembled on the 3D GF recorded at different magnifications. Inset shows the EDX of the ZnO NWAs. (F) SEM images showing the height of ZnO NWAs (∼2 μm). Inset shows the diameter of the ZnO NWAs (∼40 nm). (G–I) DPV curves for UA, DA, and AA measured using a ZnO NWA/GF electrode at different concentrations. The UA concentrations from the bottom are 0–1 μM. The DA concentrations from the bottom are 0–1 μM. The AA concentrations from the bottom are 0–10 μM. Insets show plots of the oxidation peak current as a function of concentration of each biomolecule, showing two slopes for UA and DA. [Reprinted with permission from ref. 493, H. Y. Yue, S. Huang, J. Chang, C. Heo, F. Yao, S. Adhikari, F. Gunes, L. C. Liu, T. H. Lee, E. S. Oh, B. Li, J. J. Zhang, T. Q. Huy, N. V. Luan and Y. H. Lee, ZnO Nanowire Arrays on 3D Hierarchical Graphene Foam: Biomarker Detection of Parkinson's Disease, ACS Nano, 2014, 8, 1639–1646. Copyright© American Chemical Society.]
Fig. 23
Fig. 23. (A) Schematic illustration of the preparation of biofunctional CGS nanocomposites. (B) DPV responses of the proposed immunosensor after incubation with different concentrations of CEA and AFP. (C) and (D) Calibration curves of the multiplex immunoassay toward CEA and AFP in 0.1 M PBS, pH 6.5. [Reprinted with permission from ref. 511, X. Chen, X. Jia, J. Han, J. Ma, Z. Ma, Electrochemical immunosensor for simultaneous detection of multiplex cancer biomarkers based on graphene nanocomposites, Biosens. Bioelectron., 2013, 50, 356–361. Copyright© Elsevier.]
Fig. 24
Fig. 24. (A) Schematic representation of the fabrication of the tri-antibody dual-channel immunological biosensor for detecting cancer biomarkers; nuclear matrix protein 22 (NMP22) and carcino-embryonic antigen (CEA). [Reprinted with permission from ref. 531, X. Ren, H. Ma, T. Zhang, Y. Zhang, T. Yan, B. Du and Q. Wei, Sulfur-Doped Graphene-Based Immunological Biosensing Platform for Multianalysis of Cancer Biomarkers, ACS Appl. Mater. Interfaces, 2017, 9, 37637–37644. Copyright© American Chemical Society]. (B) Schematic presentation of the proposed sandwich-type DNA sensor showing the prepared AuNPs–GO/GCE and the hybridization of target DNA with the specific capture probe and HRP-labeled probe. [Reprinted with permission from ref. 530, A. A. Saeed, J. L. A. Sánchez, C. K. O'Sullivan, M. N. Abbas, DNA Biosensors Based on Gold Nanoparticles-Modified Graphene Oxide for the Detection of Breast Cancer Biomarkers for Early Diagnosis, Bioelectrochemistry, 2017, 118, 91–99. Copyright© Elsevier.]
Fig. 25
Fig. 25. (A) Schematic illustration of the cell detecting system and the molecular interactions between the functionalized graphene (P1, P2, P3) and the different cell types including human peripheral blood mononuclear cells (PBMCs), cancerous cells and circulating tumor cells (CTCs). (B) Illustration of the seven functionalized graphene (P1–P7) derivatives used for the identification of normal, cancerous cells and CTCs. The seven graphene (P1–P7) derivatives include P1: BSA/chemically converted graphene (CCG), P2: CCG, P3: chitosan (Chit)/CCG, P4: polydopamine (DA)/CCG, P5: calf thymus DNA/CCG, P6: gelatin (Gel)/CCG, and P7: polyethylene glycol (PEG)/CCG. (C) Discrimination of different cancerous cell types at a cancer cell density of 100 cells: (a) 2D electrochemistry contour plots of 5 different cancer cell lines including lung (A549), cervical (HeLa), liver (HepG2), leukemia (K562), and breast (MCF-7) to P1–P7 graphene probes; (b) changes in the electron-transfer resistance at the electrolyte/graphene interface measured by the electrochemical impedance spectra for five different cancerous cell lines; A549, HeLa, HepG2, K562 and MCF-7 using P1–P7 graphene derivatives; (c) jackknifed classification recorded using linear discriminant analysis (LDA) for P1–P7 graphene derivatives for A549, HeLa, HepG2, K562 and MCF-7 human cancerous cells; and canonical score plots for the functionalized graphene array-based electrochemical sensor containing P1 + P4 (d), P1 +P5 (e), P2 + P4 (f), and P2 + P5 (g). [Reprinted with permission from ref. 546, L. Wu, H. Ji, Y. Guan, X. Ran, J. Ren and X. Qu, A Graphene-Based Chemical Nose/Tongue Approach for the Identification of Normal, Cancerous and Circulating Tumor Cells, NPG Asia Mater., 2017, 9, e356. Copyright© Nature Publishing Group.]
Fig. 26
Fig. 26. (A) Functionalization of anti-ErbB2 molecules on the outer surfaces of GF and GF–nTiO2 electrodes. (B) FESEM (a) and TEM (b) images of carbon-doped nTiO2. The inset shows a magnified image of a single nTiO2. (c) SEM image of 3D GF. (d–f) SEM images of the GF–nTiO2 nanocomposite. (C) DPV curves of biosensor in the presence of ErbB3 and ErbB4 antigens. (D) Histogram displaying the peak current of the biosensor in the presence of different interfering bionanalytes. [Reprinted with permission from ref. 518, M. A. Ali, K. Mondal, Y. Jiao, S. Oren, Z. Xu, A. Sharma and L. Dong, Microfluidic Immuno-Biochip for Detection of Breast Cancer Biomarkers Using Hierarchical Composite of Porous Graphene and Titanium Dioxide Nanofibers, ACS Appl. Mater. Interfaces, 2016, 8, 20570–20582. Copyright© American Chemical Society.]
Fig. 27
Fig. 27. (A) (Left) Photographs of a real graphene-interfaced chip. (Right) The PASE activation and antibody immobilization processes. (B) On-chip biosensing of E. coli O157:H7 through capacitance change measured between Au microelectrodes. (C) Optical micrographs of captured E. coli O157:H7 cells on graphene-interface chips through targeted antibodies that are covalently attached to the surfaces of the chips. [Reprinted with permission from ref. 564, A. Pandey, Y. Gurbuz, V. Ozguz, J. H. Niazi and A. Qureshi, Graphene-Interfaced Electrical Biosensor for Label-Free and Sensitive Detection of Foodborne Pathogenic E. coli O157:H7, Biosens. Bioelectron., 2017, 91, 225–231. Copyright© Elsevier.]
Fig. 28
Fig. 28. (A) Schematic illustration of the sensing strategy for the detection of Hg2+ using a graphene/nano-Au composite for signal amplification. (B) Square wave voltammograms (SWV) of mercuric biosensor as a function of Hg2+ ions concentration in the 10 μm to 0.001 aM range in 20 mL Tris having 10 mM KCl. (C) Mercuric biosensor showing the selectivity of Hg2+ ions among various interfering metal ions measured using 10 nM of Hg2+, 500 nM of interfering metal ions K+, Ba2+, Ca2+, Cd2+, Co2+, Cr2+, Cu2+, Mg2+, Mn2+, Ni2+, Pb2+, Zn2+, Al3+, Fe3+, and their corresponding mixture having 10 nM of Hg2+ respectively. [Reprinted with permission from ref. 594, Y. Zhang, G. M. Zeng, L. Tang, J. Chen, Y. Zhu, X. X. He and Y. He, Electrochemical Sensor Based on Electrodeposited Graphene-Au Modified Electrode and NanoAu Carrier Amplified Signal Strategy for Attomolar Mercury Detection, Anal. Chem., 2015, 87, 989–996. Copyright© American Chemical Society.]
Fig. 29
Fig. 29. (A–C) A comparison of DPV curves recorded with different electrodes including vertically ordered mesoporous silica-nanochannel film (VMSF)/ITO electrode, OH-GQD@VMSF/ITO and NH2-GQD@VMSF/ITO electrodes for detecting Hg2+ (0.5 μM), Cu2+ (1.0 μM), and Cd2+ (1.0 μM), respectively. (D and E) DPV curves recorded as a function of different concentrations of Hg2+ and Cu2+ using OH-GQD@VMSF/ITO electrode. (F) DPV curves obtained as a function of different concentrations of Cd2+ using NH2-GQD@VMSF/ITO electrode. The (D)–(F) insets show linear curves obtained in a very low concentration range. [Reprinted with permission from ref. 598, L. Lu, L. Zhou, J. Chen, F. Yan, J. Liu, X. Dong, F. Xi and P. Chen, Nanochannel-Confined Graphene Quantum Dots for Ultrasensitive Electrochemical Analysis of Complex Samples, ACS Nano, 2018, 12, 12673–12681. Copyright© American Chemical Society.]
Fig. 30
Fig. 30. DPVs at the glassy carbon electrode GCE on the PLaE–Chit/AuNPs–GN nanocomposite for (a) 10 ppb of methyl parathion and then 10 ppb of methyl parathion mixed with (b) 10 ppb of carbendazim, (c) 10 ppb of lindane, (d) 1 ppm of Fe3+, (e) 1 ppm of Zn2+, (f) 1 ppm of Cu2+, (g) 1 ppm of Pb2+, (h) 1 ppm of K+, (i) 1 ppm of NO3−, (j) 1 ppm of PO43−, (k) 1 ppm of SO42−, (l) 0.5 mM glucose, or (m) 0.5 mM citric acid. [Reprinted with permission from ref. 659, J. Bao, C. Hou, M. Chen, J. Li, D. Huo, M. Yang, X. Luo and Y. Lei, Plant Esterase–Chitosan/Gold Nanoparticles–Graphene Nanosheet Composite-Based Biosensor for the Ultrasensitive Detection of Organophosphate Pesticides, J. Agric. Food Chem., 2015, 63, 10319–10326. Copyright© 2018 American Chemical Society.]
Fig. 31
Fig. 31. (A) Schematic illustration of phosphotriesterase (PTE) enzyme functionalization on the PtNPs–inkjet maskless lithography–PGE (PtNP–IML–PGE) surface using glutaraldehyde (GA). Hydrolysis of paraoxon into p-nitrophenol by the immobilized PTE enzyme and thereafter, successive oxidation of p-nitrophenol at the surface of graphene electrode at a working potential of +0.95 V vs. Ag/AgCl. (B) Enzyme progress of p-nitrophenol production rate for varying paraoxon concentrations using enzyme inks created using 2 nM (black), 4 nM (green), and 20 nM (red) concentrations of PTE. [Reprinted with permission from ref. 663, J. A. Hondred, J. C. Breger, N. J. Alves, S. A. Trammell, S. A. Walper, I. L. Medintz and J. C. Claussen, Printed Graphene Electrochemical Biosensors Fabricated by Inkjet Maskless Lithography for Rapid and Sensitive Detection of Organophosphates, ACS Appl. Mater. Interfaces, 2018, 10, 11125–11134. Copyright© 2018 American Chemical Society.]
Fig. 32
Fig. 32. (a) Schematic illustration of fluorescence detection scheme using tyramine-functionalized GQDs (TYR-GQDs). (b) Photoluminescence (PL) spectra of 0.1 mg mL−1 TYR-GQD in PBS (pH 7.0) containing 2.5 μM glucose oxidase and at different concentrations of glucose. (c) PL spectra of spectra of 0.1 mg mL−1 TYR-GQD in PBS (pH 7.0) containing 10 μM cholesterol oxidase and at different concentrations of cholesterol. (d) PL spectra of 0.1 mg mL−1 TYR-GQD in PBS (pH 7.0) containing 5 μM lactate oxidase and at different concentrations of l-lactate. [Reprinted with permission from ref. 670, N. Li, A. Than, X. Wang, S. Xu, L. Sun, H. Duan, C. Xu and P. Chen, Ultrasensitive Profiling of Metabolites Using Tyramine-Functionalized Graphene Quantum Dots, ACS Nano, 2016, 10, 3622–3629. Copyright© American Chemical Society.]
Fig. 33
Fig. 33. (A) Schematic illustration showing the multicolored P-QD- and N, S-codoped rGO-(N, S-rGO) based DNA biosensor for the sensitive detection of HBV DNA and HIV DNA. [Reprinted with permission from ref. 711, L. Chen, L. Song, Y. Zhang, P. Wang, Z. Xiao, Y. Guo and F. Cao, Nitrogen and Sulfur Codoped Reduced Graphene Oxide as a General Platform for Rapid and Sensitive Fluorescent Detection of Biological Species, ACS Appl. Mater. Interfaces, 2016, 8, 11255–11261. Copyright© American Chemical Society.] (B) Schematic illustration of the FRET-based biosensing platform using GQDs and pyrene-functionalized molecular beacon probes for miRNA detection. [Reprinted with permission from ref. 712, H. Zhang, Y. Wang, D. Zhao, D. Zeng, J. Xia, A. Aldalbahi, C. Wang, L. San, C. Fan, X. Zuo and X. Mi, Universal Fluorescence Biosensor Platform Based on Graphene Quantum Dots and Pyrene-Functionalized Molecular Beacons for Detection of MicroRNAs, ACS Appl. Mater. Interfaces, 2015, 7, 16152–16156. Copyright© American Chemical Society.] (C) Aptamer biosensor based on a NA/AgNC/GO hybrid system for the detection of thrombin. [Reprinted with permission from ref. 681, X. Liu, F. Wang, R. Aizen, O. Yehezkeli and I. Willner, Graphene Oxide/Nucleic-Acid-Stabilized Silver Nanoclusters: Functional Hybrid Materials for Optical Aptamer Sensing and Multiplexed Analysis of Pathogenic DNAs, J. Am. Chem. Soc., 2013, 135, 11832–11839. Copyright© American Chemical Society.] (D) Schematic representation showing the mechanism of UC NPs/GO in the presence and absence of complementary DNA. [Reprinted with permission from ref. 713, P. Alonso-Cristobal, P. Vilela, A. El-Sagheer, E. Lopez-Cabarcos, T. Brown, O. L. Muskens, J. Rubio-Retama, A. G. Kanaras, Highly Sensitive DNA Sensor Based on Upconversion Nanoparticles and Graphene Oxide, ACS Appl. Mater. Interfaces, 2015, 7, 12422–12429. Copyright© American Chemical Society.]
Fig. 34
Fig. 34. (A) Schematic illustration of the rGO-aptamer-RCA based sensing probe. (B) Analysis of RCA products using 0.6% agarose gel electrophoresis. Each reaction was conducted at 30 °C for 1 h in 60 μL of target binding buffer (4,5,6,7-tetrabromobenzotriazole (TBB), 20 mM PBS, 150 mM NaCl, 20 mM KCl, and 5 mM MgCl2 at pH 7.5) having components of rGO-adsorbed functional thrombin probe TP1 (250 nM), circular DNA template (CDT1) (8 nM), and thrombin (Thr; 200 nM). (C) Time-dependent fluorescence response of rGO-adsorbed FAM-labeled TP1 (250 nM) in the presence of Thr (200 nM), CDT1 (8 nM), or both. Excitation wavelength (λex)/emission wavelength (λem) = 494 nm/518 nm. [Reprinted with permission from ref. 716, M. Liu, J. Song, S. Shuang, C. Dong, J. D. Brennan and Y. A. Li, Graphene-Based Biosensing Platform Based on the Release of DNA Probes and Rolling Circle Amplification, ACS Nano, 2014, 8, 5564–5573. Copyright© American Chemical Society.] (D) Illustration of the GO-based platform coupled with hybridization chain reactions (HCR) for biothiol analysis. [Reprinted with permission from ref. 724, J. Ge, Z.-M. Huang, Q. Xi, R.-Q. Yu, J.-H. Jiang and X. Chu, A Novel Graphene Oxide Based Fluorescent Nanosensing Strategy with Hybridization Chain Reaction Signal Amplification for Highly Sensitive Biothiol Detection, Chem. Commun., 2014, 50, 11879–11882. Copyright© Royal Society of Chemistry.]
Fig. 35
Fig. 35. (A) Schematic representation of the immobilization of ochratoxin A (OTA) aptamers and fumonisin B1 (FB1) aptamers and their multiplex upconversion FRET between aptamer-UCNPs and GO for detecting OTA and FB1. (B) Fluorescence signal change for different mycotoxins at a concentration of 10 ng mL−1. FB1 and OTA show a significant increase in fluorescence intensity compared with other mycotoxin homologs, including AFB1, AFB2, AFG1, AFG2, fumonisin B2 (FB2) and zearalenone (ZEN), which are commonly found in foods. [Reprinted with permission from ref. 682, S. Wu, N. Duan, X. Ma, Y. Xia, H. Wang, Z. Wang and Q. Zhang, Multiplexed Fluorescence Resonance Energy Transfer Aptasensor between Upconversion Nanoparticles and Graphene Oxide for the Simultaneous Determination of Mycotoxins, Anal. Chem., 2012, 84, 6263–6270. Copyright© American Chemical Society.]
Fig. 36
Fig. 36. (A) Fe3+ ions sensing platform showing GQD fluorescence quenching by Fe3+ ions and the selectivity of Fe3+ ions by GQDs among other interfering metal ions. (B) TEM and HETEM images of the GQDs. Inset shows the lattice fringes of GQDs. (C) SEM image of GQD aggregation induced after adding Fe3+ ions. (D) PL intensity of GQDs in different concentrations of Fe3+ ranging from 0 to 60 μM. Inset shows a linear calibration plot for detecting Fe3+ ions. (E) Selectivity of GQDs toward Fe3+ ions over 10 other common interfering metal ions at identical concentrations of 5 μM for all metal ions. [Reprinted with permission from ref. 700, X. Zhu, Z. Zhang, Z. Xue, C. Huang, Y. Shan, C. Liu, X. Qin, W. Yang, X. Chen and T. Wang, Understanding the Selective Detection of Fe3+ Based on Graphene Quantum Dots as Fluorescent Probes: The Ksp of a Metal Hydroxide-Assisted Mechanism, Anal. Chem., 2017, 89, 12054–12058. Copyright© American Chemical Society.]
Fig. 37
Fig. 37. (A) Fluorescence spectra of 5.0 μM 5,10,15,20-tetrakis(1-methyl-4-pyridinio)porphyrin tetra(p-toluenesulfonate) (TMPyP) after the addition of 20 μg L−1 N-GQDs, 40 μM MnII, and different concentrations of HgII ranging from 0 to 200 nM. (B) Plot of the fluorescence ratio (I490/I658) vs. HgII concentrations (0–200 nM) in the presence or absence (HgII concentrations of 0 to 1400 nM) of N-GQDs. Inset shows photographs corresponding to the HgII concentrations and the plot of (I490/I658) vs. HgII concentration (0–100 nM) in the presence of N-GQDs. (C) Absorption spectra of 5.0 μM TMPyP after the addition of 40 μM MnII, 20 μg L−1 N-GQDs, and different concentrations of HgII; inset shows plots of A462/A422vs. HgII concentration with and without N-GQDs. (D) The selectivity for HgII among different interfering analytes. The fluorescence quenching efficiency (I490/I658) of 5.0 μM TMPyP after the addition of 40 μM MnII, 100 nM HgII and 20 μg L−1 N-GQDs and other interfering ions, including BaII, CdII, CoII, CuII, FeII, NiII, PbII, ZnII, HCO3, Cl at 500 nM concentration; MgII, SO42−, NO3 at 100 μM concentration; and CaII at 200 μM concentration; inset shows photographs of the fluorescence changes under 365 nm UV light. [Reprinted with permission from ref. 705, D. Peng, L. Zhang, R.-P. Liang and J.-D. Qiu, Rapid Detection of Mercury Ions Based on Nitrogen-Doped Graphene Quantum Dots Accelerating Formation of Manganese Porphyrin, ACS Sens., 2018, 3, 1040–1047. Copyright© American Chemical Society.]
Fig. 38
Fig. 38. Amplified fluorescent sensing mechanism of detecting Hg2+ through HCR. In the absence of Hg2+, GO absorbs the DNA probes (helper DNA, HP1, and HP2) via noncovalent interactions and quenches the fluorescence of HP1. However, in the presence of Hg2+, the helper DNA opens HP1 because of the formation of stable T–Hg2+–T structures and consequently induces continuous HP1–HP2 hybridizations, which cannot adsorb on GO, leading to the generation of amplified fluorescence. [Reprinted with permission from ref. 602, J. Huang, X. Gao, J. Jia, J.-K. Kim and Z. Li, Graphene Oxide-Based Amplified Fluorescent Biosensor for Hg2+ Detection through Hybridization Chain Reactions, Anal. Chem., 2014, 86, 3209–3215. Copyright© American Chemical Society.]
Fig. 39
Fig. 39. (A) Fluorescence (FL) intensity of GQDs-MnO2 sensor with varying concentrations of glutathione (GSH) from 0 to 100 μmol L−1. Inset shows the FL intensity ratio trend varying concentrations of GSH. (B) Plot of FL intensity ratio (FR/FR0) against the logarithm of the concentration of GSH. (C) Selectivity of the GQD–MnO2-based fluorescence sensor toward glutathione pesticide. Fluorescence (FL) intensities of the GQD–MnO2 and GQD–MnO2–glutathione (GSH) sensors measured in the presence of 21 different interfering analytes. The concentration was 100 μg mL−1 for protein analytes, including bovine serum albumin (BSA), tyrosinase (TYR), glucose oxidase (GOx), acetyl cholinesterase (AChE), and trypsin (TRY), and 500 μmol L−1 for nonprotein analytes, including the inorganic salts KCl, Na2SO4, CaCl2, MgCl2, and MnCl2 as well as aspartic acid, tyrosine, glycine, glucose and fructose. The fluorescence intensities increased only after the addition of GSH to the GQD–MnO2 system and also showed recovery (blank column). [Reprinted with permission from ref. 737, X. Yan, Y. Song, C. Zhu, J. Song, D. Du, X. Su and Y. Lin, Graphene Quantum Dot–MnO2 Nanosheet Based Optical Sensing Platform: A Sensitive Fluorescence “Turn off–on” Nanosensor for Glutathione Detection and Intracellular Imaging, ACS Appl. Mater. Interfaces, 2016, 8, 21990–21996. Copyright© American Chemical Society.]
Fig. 40
Fig. 40. (A) Fluorescence spectra of N-doped GQDs decorated with V2O5 nanosheets (N-GQD@V2O5) of cysteine in the concentration range of 0–125 μM. (B) The change of fluorescence intensity as a function of cysteine concentration in the range of 0–125 μM. The inset shows a linear relationship in the 0–15 μM concentration range. (C) Selectivity of the N-GQD@V2O5 biosensors in the presence of 22 common interfering electrolytes and biological analytes, including metal ions, inorganic salts, amino acids, sugar, reducing agents, proteins, and glucose oxidase (GOx). Reprinted with permission from ref. 750, A. B. Ganganboina, A. D. Chowdhury and R.-A. Doong, N-Doped Graphene Quantum Dots-Decorated V2O5 Nanosheet for Fluorescence Turn Off–On Detection of Cysteine, ACS Appl. Mater. Interfaces, 2017, 10, 614–624. Copyright© 2018 American Chemical Society.
Fig. 41
Fig. 41. Schematic representation of nGO-based biosensor array. (a) GO–protein binding and interactions showing GO as a quencher for fluorophores. The fluorescence is restored by the displacement of quenched fluorophores due to the interactions between GO and the analyte proteins. Statistical analysis of the displaced fluorophores using LDA to examine differences in the GO–protein interactions between conventional GO and nGO flakes (20 nm diameter). (b) LDA patterns showed enhanced fluorescent restoration from a three sensor array of nGO flakes compared to that obtained with conventional GO. The nGO showed a high fluorescence response due to increased protein interactions compared with those observed for conventional GO flakes. (c) Chemical structures of the five fluorophores, including acridine orange, pyronine Y (PY), rhodamine B, rhodamine 6G (R6G) and His-tagged emerald green fluorescent protein (eGFP), used for the fluorescent sensor array. Reprinted with permission from ref. 753, S. S. Chou, M. De, J. Luo, V. M. Rotello, J. Huang, V. P. Dravid, Nanoscale Graphene Oxide (nGO) as Artificial Receptors: Implications for Biomolecular Interactions and Sensing, J. Am. Chem. Soc., 2012, 134, 16725–16733. Copyright© 2018 American Chemical Society.
Fig. 42
Fig. 42. (A) Fluorescence response patterns measured using nGO-based sensor arrays to selectively identify eight different analyte proteins, including ribonuclease A (Rib-A), histone (His), β-galactosidase (β-Gal), hemoglobin (Hemo), lysozyme (Lys), myoglobin, lipase (Lip), and BSA at 10 nM concentrations. Three different fluorophores, pyronine Y (PY), rhodamine 6G (R6G), and His-tagged emerald green fluorescent protein (eGFP), were used in the biosensing arrays. (B) The canonical score plot obtained by the LDA method using the nGO sensor array showed 95% accurate classification of all proteins. (C) The fluorescence response patterns measured using the conventional GO-based sensor array at 10 nM protein concentration. (D) The corresponding canonical score plot for the conventional GO-based sensor array, revealing an unclear classification. Reprinted with permission from ref. 753, S. S. Chou, M. De, J. Luo, V. M. Rotello, J. Huang and V. P. Dravid, Nanoscale Graphene Oxide (nGO) as Artificial Receptors: Implications for Biomolecular Interactions and Sensing, J. Am. Chem. Soc., 2012, 134, 16725–16733. Copyright© American Chemical Society.
Fig. 43
Fig. 43. (A) Schematic illustration of AIE/GO complex-based fluorescent sensor array showing competitive biomolecular interaction among AIE, microbes and GO. AIE is represented as AIEgen in the illustration. (B) Principal component analysis (PCA) plot showing three separate patterns formed from six microbial lysates where each test was conducted five times. The AIE/GO complex-based fluorescent sensor array identified six microbial lysates with 100% (F1 = 61.3% + F2 = 29.9%) efficiency. Reprinted with permission from ref. 760, J. Shen, R. Hu, T. Zhou, Z. Wang, Y. Zhang, S. Li, C. Gui, M. Jiang, A. Qin and B. Z. Tang, Fluorescent Sensor Array for Highly Efficient Microbial Lysate Identification through Competitive Interactions, ACS Sensors, 2018, 3, 2218–2222. Copyright© American Chemical Society.
Fig. 44
Fig. 44. Selectivity of PtNPs-graphene/CDP-MWCNTs/GCE electrochemical biosensor toward catechol (CC) and hydroquinone (HQ) against 21 different interfering analytes. The buffer was 0.1 M PBS (pH 6.0) at 50 mV s−1 scan rate. The concentrations of HQ and CC were 50 μM. Reprinted with permission from ref. 762, X. Huang, X. Deng, W. Qi and D. Wu, Simultaneous Detection of Hydroquinone and Catechol Using Platinum Nanoparticles Decorated Graphene/Poly-Cyclodextrin/Multiwalled Carbon Nanotubes (MWCNTs) Nanocomposite Based Biosensor, J. Nanosci. Nanotechnol., 2018, 18, 8118–8123. Copyright© American Scientific Publishers.
Fig. 45
Fig. 45. (A) Fluorescence intensity of 1,2-bis-(2-pyren-1-ylmethylamino-ethoxy)ethane (NPEY)/graphene nanosheets (GNs) hybrid system to different metal ions. (B) The changes of fluorescence intensity of NPEY/GNs hybrid measured at 376 nm after adding different heavy metal ions. (C) Schematic illustration of fluorescence “Turn-On” mechanism for detecting Mn2+ using NPEY/GNs hybrid; change in fluorescence emission with NPEY/GNs (left) and NPEY/GNs in the presence of Mn2+ (right) under 365 nm UV light illumination. The GNs quenched fluorescence emission due to the π–π stacking interactions between NPEY molecules and GNs via photoinduced electron transfer (PET) process. (D) Confocal fluorescence microscopy images of HeLa cells with NPEY only (E) NPEY/GNs, and (F) NPEY/GN with Mn2+ after extensive washing of HeLa cells with PBS. [Reprinted with permission from ref. 766, X. Mao, H. Su, D. Tian, H. Li and R. Yang, Bipyrene-functionalized graphene as a “turn-on” fluorescence sensor for manganese(ii) ions in living cells, ACS Appl. Mater. Interfaces, 2013, 5, 592–597. Copyright© American Chemical Society.]
Fig. 46
Fig. 46. Selectivity for Pb2+ ions (50 nM) using a “turn-on” fluorescence sensor based on GQD/AuNP conjugates in the presence of interfering analytes including Mn2+, Fe3+, K+, Hg2+, Cu2+ Mg2+, Ca2+, Zn2+, Cd2+, and Ag+ ions (200 nM). Reprinted with permission from ref. 704, X. Niu, Y. Zhong, R. Chen, F. Wang, Y. Liu, D. A. Luo, “Turn-on” Fluorescence Sensor for Pb2+ Detection Based on Graphene Quantum Dots and Gold Nanoparticles, Sens. Actuators, B, 2018, 255, 1577–1581. Copyright© Elsevier.
Fig. 47
Fig. 47. (A) Schematic representation of a fluorescent aptasensor assay based on GO-probe for detecting mucin 1 protein (MUC1) (5′-FAM-CCCGTCTTCCAGACAAGAGTGCAGGG-3′) by using deoxyribonuclease I (DNase I)-mediated target cyclic amplification. The formation of GO-probe/MUC1 complex results in the fluorescence signal detection. (B) Fluorescence intensity of the GO-based aptasensor in the presence of MUC1 (5 ng mL−1), epithelial cell adhesion molecule (EpCAM) (50 ng mL−1), serum albumin (BSA) (50 ng mL−1), prostate-specific antigen (PSA) (50 ng mL−1), vascular endothelial growth factor (VEGF) (50 ng mL−1), and black, respectively. (C) Fluorescence intensity of the GO-based aptasensor for detection of MUC1 protein in buffer and blank biological samples of human urine, saliva and serum. Reprinted with permission from ref. 775, J. Zhang, F. Ran, W. Zhou, B. Shang, F. Yu, L. Wu, W. Hu, X. He and Q. Chen, Ultrasensitive fluorescent aptasensor for MUC1 detection based on deoxyribonuclease I-aided target recycling signal amplification, RSC Adv., 2018, 8, 32009–32015. Copyright© The Royal Society of Chemistry.

References

    1. Malhotra B. D. Chaubey A. Biosensors for Clinical Diagnostics Industry. Sens. Actuators, B. 2003;91:117–127. doi: 10.1016/S0925-4005(03)00075-3. - DOI
    1. Velasco-Garcia M. N. Mottram T. Biosensor Technology Addressing Agricultural Problems. Biosyst. Eng. 2003;84:1–12. doi: 10.1016/S1537-5110(02)00236-2. - DOI
    1. Thakur M. S. Ragavan K. V. Biosensors in Food Processing. J. Food Sci. Technol. 2013;50:625–641. doi: 10.1007/s13197-012-0783-z. - DOI - PMC - PubMed
    1. Rodriguezmozaz S. Alda M. Marco M. Barcelo D. Biosensors for Environmental Monitoring A Global Perspective. Talanta. 2005;65:291–297. - PubMed
    1. Su S. Chen S. Fan C. Recent Advances in Two-Dimensional Nanomaterials-Based Electrochemical Sensors for Environmental Analysis. Green Energy & Environment. 2018;3:97–106.