

Drug-target affinity prediction using graph neural network and contact maps
- PMID: 35517730
- PMCID: PMC9054320
- DOI: 10.1039/d0ra02297g
Drug-target affinity prediction using graph neural network and contact maps
Abstract
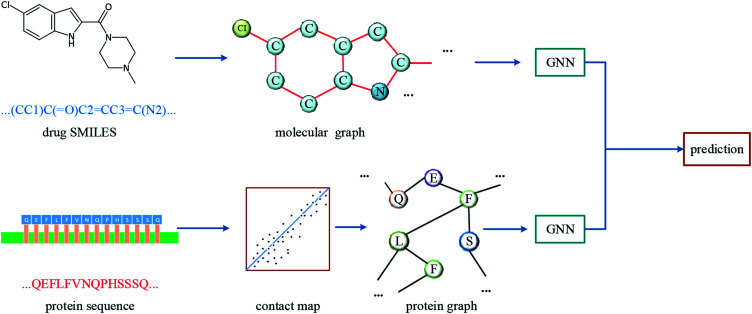
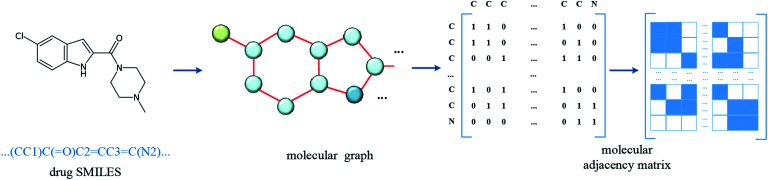
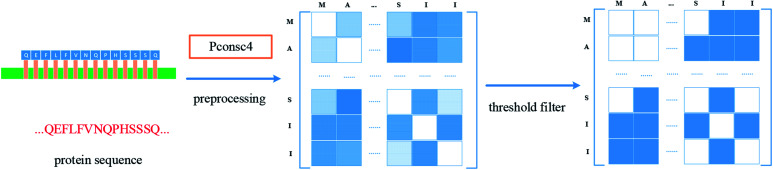
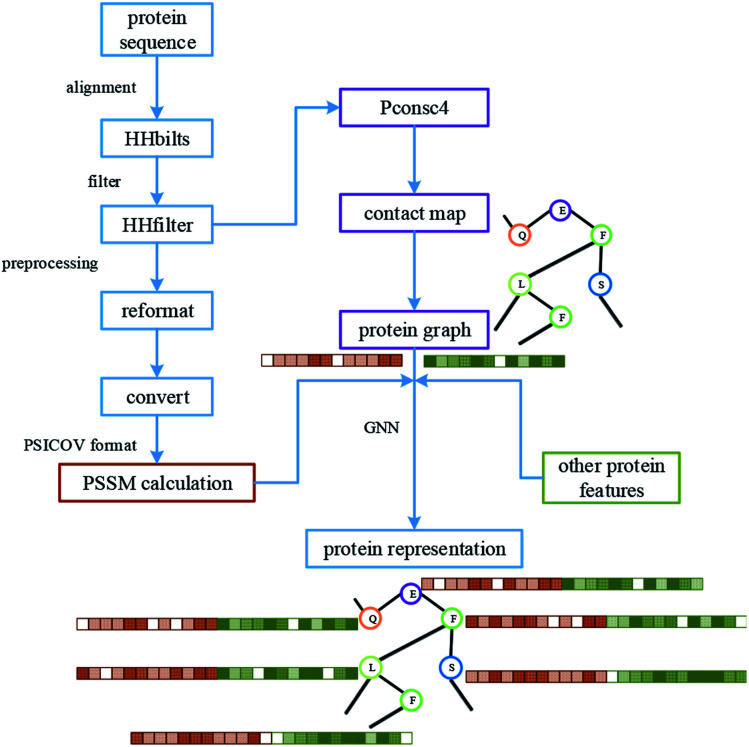
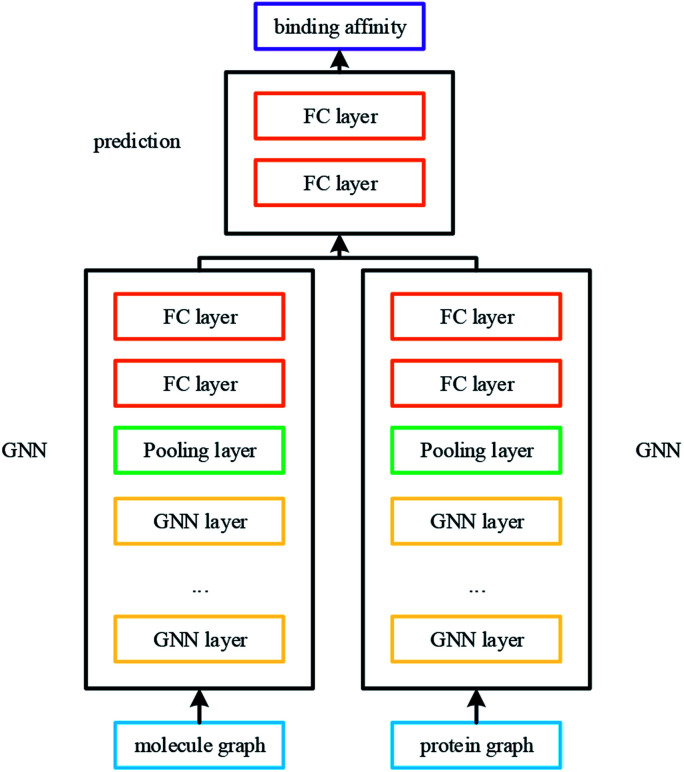
Computer-aided drug design uses high-performance computers to simulate the tasks in drug design, which is a promising research area. Drug-target affinity (DTA) prediction is the most important step of computer-aided drug design, which could speed up drug development and reduce resource consumption. With the development of deep learning, the introduction of deep learning to DTA prediction and improving the accuracy have become a focus of research. In this paper, utilizing the structural information of molecules and proteins, two graphs of drug molecules and proteins are built up respectively. Graph neural networks are introduced to obtain their representations, and a method called DGraphDTA is proposed for DTA prediction. Specifically, the protein graph is constructed based on the contact map output from the prediction method, which could predict the structural characteristics of the protein according to its sequence. It can be seen from the test of various metrics on benchmark datasets that the method proposed in this paper has strong robustness and generalizability.
This journal is © The Royal Society of Chemistry.
Conflict of interest statement
There are no conflicts to declare.
Figures
Similar articles
-
Drug-target affinity prediction with extended graph learning-convolutional networks.BMC Bioinformatics. 2024 Feb 16;25(1):75. doi: 10.1186/s12859-024-05698-6. BMC Bioinformatics. 2024. PMID: 38365583 Free PMC article.
-
Sequence-based drug-target affinity prediction using weighted graph neural networks.BMC Genomics. 2022 Jun 17;23(1):449. doi: 10.1186/s12864-022-08648-9. BMC Genomics. 2022. PMID: 35715739 Free PMC article.
-
Drug-target binding affinity prediction method based on a deep graph neural network.Math Biosci Eng. 2023 Jan;20(1):269-282. doi: 10.3934/mbe.2023012. Epub 2022 Sep 30. Math Biosci Eng. 2023. PMID: 36650765
-
A survey of drug-target interaction and affinity prediction methods via graph neural networks.Comput Biol Med. 2023 Sep;163:107136. doi: 10.1016/j.compbiomed.2023.107136. Epub 2023 Jun 7. Comput Biol Med. 2023. PMID: 37329615 Review.
-
A comprehensive review of the recent advances on predicting drug-target affinity based on deep learning.Front Pharmacol. 2024 Apr 2;15:1375522. doi: 10.3389/fphar.2024.1375522. eCollection 2024. Front Pharmacol. 2024. PMID: 38628639 Free PMC article. Review.
Cited by
-
A Novel Method to Predict Drug-Target Interactions Based on Large-Scale Graph Representation Learning.Cancers (Basel). 2021 Apr 27;13(9):2111. doi: 10.3390/cancers13092111. Cancers (Basel). 2021. PMID: 33925568 Free PMC article.
-
Calibrated geometric deep learning improves kinase-drug binding predictions.Nat Mach Intell. 2023 Dec;5(12):1390-1401. doi: 10.1038/s42256-023-00751-0. Epub 2023 Nov 6. Nat Mach Intell. 2023. PMID: 38962391 Free PMC article.
-
Estimation of Particle Location in Granular Materials Based on Graph Neural Networks.Micromachines (Basel). 2023 Mar 23;14(4):714. doi: 10.3390/mi14040714. Micromachines (Basel). 2023. PMID: 37420946 Free PMC article.
-
MSGNN-DTA: Multi-Scale Topological Feature Fusion Based on Graph Neural Networks for Drug-Target Binding Affinity Prediction.Int J Mol Sci. 2023 May 5;24(9):8326. doi: 10.3390/ijms24098326. Int J Mol Sci. 2023. PMID: 37176031 Free PMC article.
-
iNGNN-DTI: prediction of drug-target interaction with interpretable nested graph neural network and pretrained molecule models.Bioinformatics. 2024 Mar 4;40(3):btae135. doi: 10.1093/bioinformatics/btae135. Bioinformatics. 2024. PMID: 38449285 Free PMC article.
References
-
- Salomon-Ferrer R. Case D. A. Walker R. C. Wiley Interdiscip. Rev.: Comput. Mol. Sci. 2013;3:198–210.
LinkOut - more resources
Full Text Sources
Other Literature Sources