Evaluation of Potential Herb-Drug Interactions Between Shengmai Injection and Losartan Potassium in Rat and In Vitro
- PMID: 35517807
- PMCID: PMC9065348
- DOI: 10.3389/fphar.2022.878526
Evaluation of Potential Herb-Drug Interactions Between Shengmai Injection and Losartan Potassium in Rat and In Vitro
Abstract
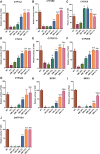
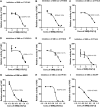
Aim: The present study aimed to explore the potential herb-drug interactions (HDI) between Shengmai injection (SMI) and losartan potassium (LOS) based on the expression profiles of cytochromes P450 (CYP450) and drug transporters in rat and in vitro. Methods: Different concentrations of SMI were used to explore the influence of SMI on the antihypertensive efficacy of LOS in the hypertension rat model established by N (omega)-nitro-L-arginine methyl ester (L-NAME) for 4 weeks. Subsequently, the serum concentration levels of LOS and losartan carboxylic acid (EXP3174) were determined by Liquid Chromatography Mass Spectrometry (LC-MS) and pharmacokinetic analysis. Human liver microsomes, human multidrug resistance protein 1 (MDR1/P-gp), and breast cancer resistance protein (BCRP) vesicles, human embryonic kidney 293 cell line with stable expression of the organic anion transporting polypeptide 1B1 (HEK293-OATP1B1 cells) and mock-transfected HEK293 (HEK293-MOCK) cells were used to verify the effects of SMI on CYP450 enzymes and drug transporters in vitro. Results: Low, medium, and high concentrations of SMI increased the antihypertensive efficacy of LOS to varying degrees. The high dose SMI increased the half-life (t 1/2 ), the maximum plasma concentration (C max), the area under the plasma concentration-time curve (AUC) from time zero to the time of the last measurable plasma concentration (AUC 0-t ), AUC from time zero to infinity (AUC 0-∞ ), and mean residence time (MRT) values of LOS and decreased its apparent volume of distribution (Vd) and clearance (CL) values. The AUC 0-t , AUC 0-∞ , and MRT of LOS were increased, whereas the CL was decreased by the medium concentration of SMI. In addition, the high, medium, and low doses of SMI increased the relative bioavailability (Frel) of LOS. SMI exhibited no significant effects on the pharmacokinetics of EXP3174. In vitro, SMI exhibited different suppressive effects on the enzyme activity levels of CYP1A2 (6.12%), CYP2B6 (2.72%), CYP2C9 (14.31%), CYP2C19 (12.96%), CYP2D6 (12.26%), CYP3A4 (3.72%), CYP2C8 (10.00-30.00%), MDR1 (0.75%), OATP1B1(2.03%), and BCRP (0.15%). Conclusion: In conclusion, SMI improved the antihypertensive efficacy of LOS in the L-NAME-induced hypertension rat model by increasing the concentration of LOS, while leaving the concentration of EXP3174 intact. SMI affected the pharmacokinetic properties of LOS by decreasing the elimination of LOS. These effects might partly be attributed to the inhibition of the activities of CYP3A4, CYP2C9, and of the drug transporters (P-gp, BCRP, and OATP1B1) by SMI, which need further scrutiny.
Keywords: CYP 450; drug transporters; hypertension; losartan potassium; shengmai injections.
Copyright © 2022 Niu, Qiang, Lin, Li, Wang, Wang and Wang.
Conflict of interest statement
The authors declare that the research was conducted in the absence of any commercial or financial relationships that could be construed as a potential conflict of interest.
Figures


Similar articles
-
Organic anion transporter 3- and organic anion transporting polypeptides 1B1- and 1B3-mediated transport of catalposide.Drug Des Devel Ther. 2015 Jan 22;9:643-53. doi: 10.2147/DDDT.S75400. eCollection 2015. Drug Des Devel Ther. 2015. PMID: 25653502 Free PMC article.
-
In Vitro Interaction of AB-FUBINACA with Human Cytochrome P450, UDP-Glucuronosyltransferase Enzymes and Drug Transporters.Molecules. 2020 Oct 8;25(19):4589. doi: 10.3390/molecules25194589. Molecules. 2020. PMID: 33050066 Free PMC article.
-
Effects of berberine on the pharmacokinetics of losartan and its metabolite EXP3174 in rats and its mechanism.Pharm Biol. 2016 Dec;54(12):2886-2894. doi: 10.1080/13880209.2016.1190762. Epub 2016 Jun 21. Pharm Biol. 2016. PMID: 27327872
-
Clinical pharmacology of axitinib.Clin Pharmacokinet. 2013 Sep;52(9):713-25. doi: 10.1007/s40262-013-0068-3. Clin Pharmacokinet. 2013. PMID: 23677771 Review.
-
Lopinavir/ritonavir: a review of its use in the management of HIV infection.Drugs. 2003;63(8):769-802. doi: 10.2165/00003495-200363080-00004. Drugs. 2003. PMID: 12662125 Review.
Cited by
-
The effect of Shengmai injection in patients with coronary heart disease in real world and its personalized medicine research using machine learning techniques.Front Pharmacol. 2023 Sep 14;14:1208621. doi: 10.3389/fphar.2023.1208621. eCollection 2023. Front Pharmacol. 2023. PMID: 37781710 Free PMC article.
-
Pharmacokinetic and Pharmacodynamic Drug-Drug Interactions: Research Methods and Applications.Metabolites. 2023 Jul 29;13(8):897. doi: 10.3390/metabo13080897. Metabolites. 2023. PMID: 37623842 Free PMC article. Review.
-
Effects of a Losartan-Antioxidant Hybrid (GGN1231) on Vascular and Cardiac Health in an Experimental Model of Chronic Renal Failure.Nutrients. 2023 Apr 10;15(8):1820. doi: 10.3390/nu15081820. Nutrients. 2023. PMID: 37111038 Free PMC article.
References
-
- Ahad A., Raish M., Bin Jardan Y. A., Alam M. A., Al-Mohizea A. M., Al-Jenoobi F. I. (2020b). Effect of Hibiscus sabdariffa and Zingiber Officinale on the Antihypertensive Activity and Pharmacokinetic of Losartan in Hypertensive Rats. Xenobiotica 50, 847–857. 10.1080/00498254.2020.1729446 - DOI - PubMed
-
- Ahad A., Raish M., Bin Jardan Y. A., Alam M. A., Al-Mohizea A. M., Al-Jenoobi F. I. (2020a). Potential Pharmacodynamic and Pharmacokinetic Interactions of Nigella Sativa and Trigonella Foenum-Graecum with Losartan in L-NAME Induced Hypertensive Rats. Saudi J. Biol. Sci. 27, 2544–2550. 10.1016/j.sjbs.2020.05.009 - DOI - PMC - PubMed
-
- Bai Q., Liu H., Xun Q. (2018). Effect of Shengmai Injection Combined with Enalapril and Amlodipine on Blood Pressure, Vascular Endothelial Function and Levels of sICAM-1 in Elderly Patients with Isolated Systolic Hypertension. Pract. J. Card. Cereb. Pneum. Vasc. Dis. 26, 225–228. 10.3969/j.issn.1008-5971.2018.12.001 - DOI
-
- Bin Jardan Y. A., Ahad A., Raish M., Alam M. A., Al-Mohizea A. M., Al-Jenoobi F. I. (2021). Effects of Garden Cress, Fenugreek and Black Seed on the Pharmacodynamics of Metoprolol: an Herb-Drug Interaction Study in Rats with Hypertension. Pharm. Biol. 59, 1088–1097. 10.1080/13880209.2021.1961817 - DOI - PMC - PubMed
LinkOut - more resources
Full Text Sources
Research Materials
Miscellaneous

