

Mathematical Modeling of Complement Pathway Dynamics for Target Validation and Selection of Drug Modalities for Complement Therapies
- PMID: 35517827
- PMCID: PMC9061988
- DOI: 10.3389/fphar.2022.855743
Mathematical Modeling of Complement Pathway Dynamics for Target Validation and Selection of Drug Modalities for Complement Therapies
Abstract
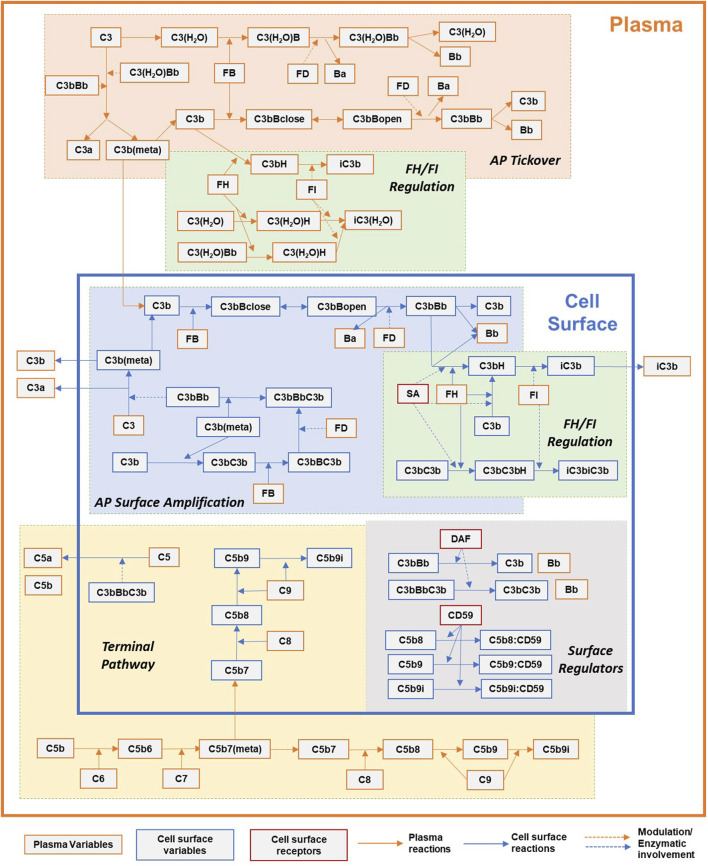
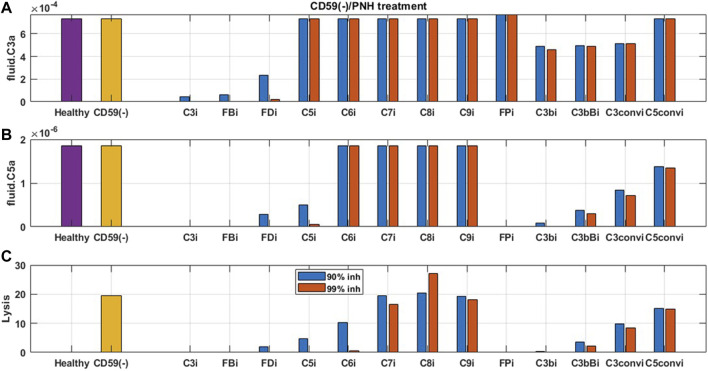
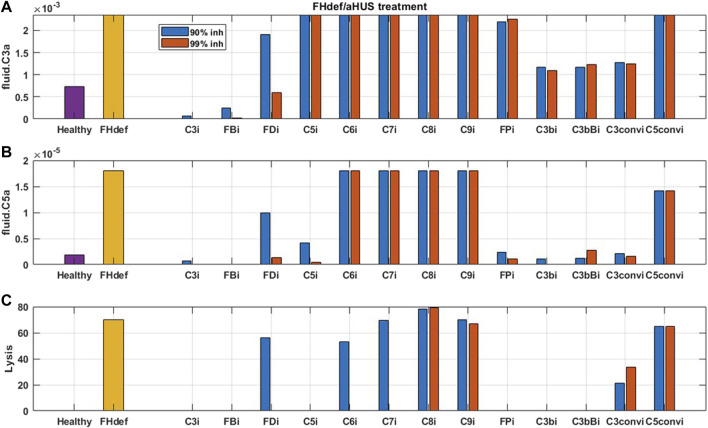
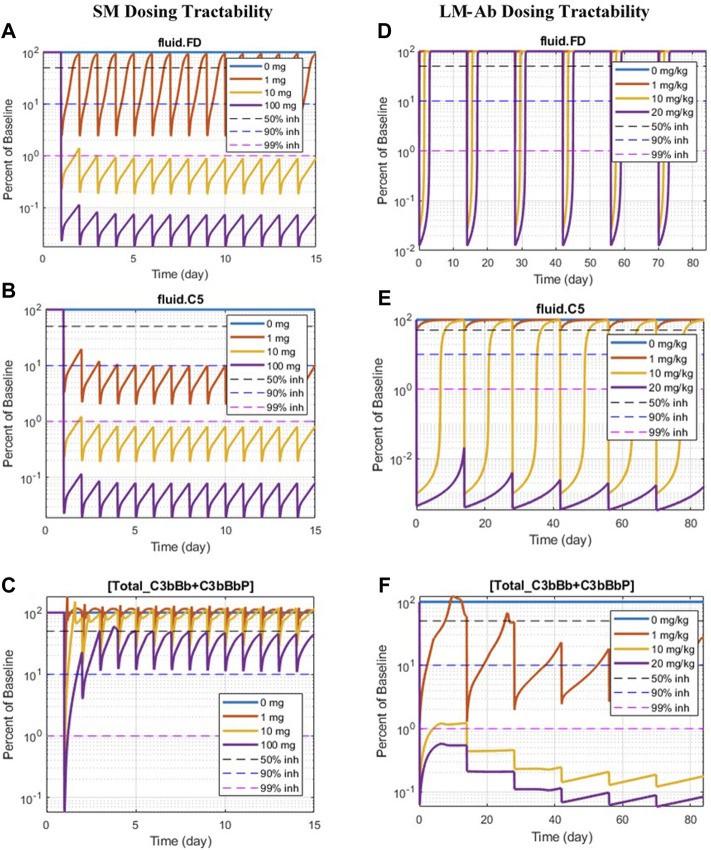
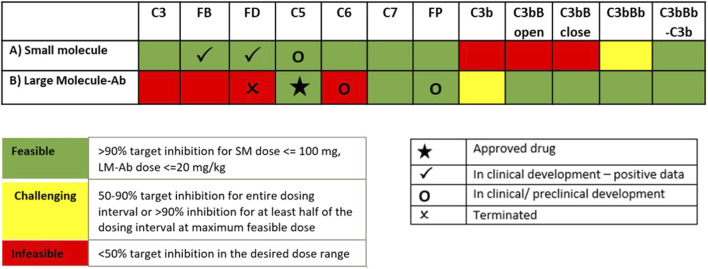
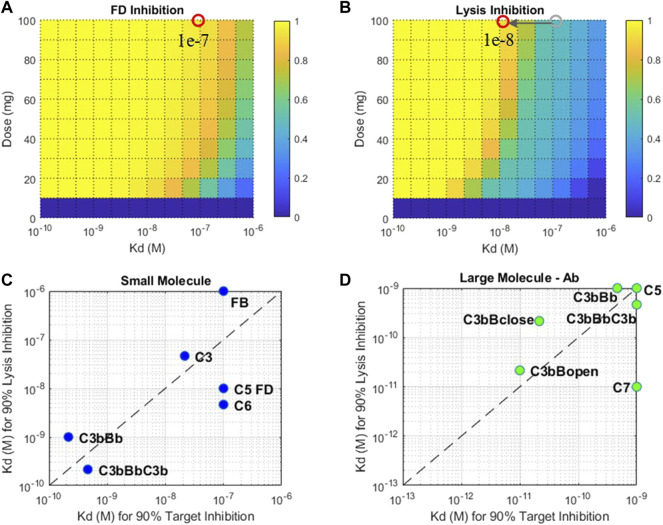
Motivation: The complement pathway plays a critical role in innate immune defense against infections. Dysregulation between activation and regulation of the complement pathway is widely known to contribute to several diseases. Nevertheless, very few drugs that target complement proteins have made it to the final regulatory approval because of factors such as high concentrations and dosing requirements for complement proteins and serious side effects from complement inhibition. Methods: A quantitative systems pharmacology (QSP) model of the complement pathway has been developed to evaluate potential drug targets to inhibit complement activation in autoimmune diseases. The model describes complement activation via the alternative and terminal pathways as well as the dynamics of several regulatory proteins. The QSP model has been used to evaluate the effect of inhibiting complement targets on reducing pathway activation caused by deficiency in factor H and CD59. The model also informed the feasibility of developing small-molecule or large-molecule antibody drugs by predicting the drug dosing and affinity requirements for potential complement targets. Results: Inhibition of several complement proteins was predicted to lead to a significant reduction in complement activation and cell lysis. The complement proteins that are present in very high concentrations or have high turnover rates (C3, factor B, factor D, and C6) were predicted to be challenging to engage with feasible doses of large-molecule antibody compounds (≤20 mg/kg). Alternatively, complement fragments that have a short half-life (C3b, C3bB, and C3bBb) were predicted to be challenging or infeasible to engage with small-molecule compounds because of high drug affinity requirements (>1 nM) for the inhibition of downstream processes. The drug affinity requirements for disease severity reduction were predicted to differ more than one to two orders of magnitude than affinities needed for the conventional 90% target engagement (TE) for several proteins. Thus, the QSP model analyses indicate the importance for accounting for TE requirements for achieving reduction in disease severity endpoints during the lead optimization stage.
Keywords: Quantitative Systems Pharmacology; complement pathway; dose prediction; drug modality selection; mathematical modeling; target validation.
Copyright © 2022 Bansal, Nichols, Howsmon, Neisen, Bessant, Cunningham, Petit-Frere, Ludbrook and Damian.
Conflict of interest statement
LB, E-MN, JN, CB, FC, S-PF, SL and VD were employed GSK. The remaining author declares that the research was conducted in the absence of any commercial or financial relationships that could be construed as a potential conflict of interest.
Figures
Similar articles
-
Insights into the Effects of Complement Factor H on the Assembly and Decay of the Alternative Pathway C3 Proconvertase and C3 Convertase.J Biol Chem. 2016 Apr 8;291(15):8214-30. doi: 10.1074/jbc.M115.693119. Epub 2016 Feb 22. J Biol Chem. 2016. Retraction in: J Biol Chem. 2017 Apr 14;292(15):6094. doi: 10.1074/jbc.A115.693119. PMID: 26903516 Free PMC article. Retracted.
-
3D structure of the C3bB complex provides insights into the activation and regulation of the complement alternative pathway convertase.Proc Natl Acad Sci U S A. 2009 Jan 20;106(3):882-7. doi: 10.1073/pnas.0810860106. Epub 2009 Jan 9. Proc Natl Acad Sci U S A. 2009. PMID: 19136636 Free PMC article.
-
Pathways of complement activation in membranoproliferative glomerulonephritis and allograft rejection.Transplant Proc. 1977 Mar;9(1):729-39. Transplant Proc. 1977. PMID: 325806 Review.
-
The role of properdin in the assembly of the alternative pathway C3 convertases of complement.J Biol Chem. 2006 Jan 27;281(4):2128-32. doi: 10.1074/jbc.M508928200. Epub 2005 Nov 21. J Biol Chem. 2006. PMID: 16301317
-
The Immunopathology of Complement Proteins and Innate Immunity in Autoimmune Disease.Clin Rev Allergy Immunol. 2020 Apr;58(2):229-251. doi: 10.1007/s12016-019-08774-5. Clin Rev Allergy Immunol. 2020. PMID: 31834594 Review.
Cited by
-
Assessing the performance of QSP models: biology as the driver for validation.J Pharmacokinet Pharmacodyn. 2024 Oct;51(5):533-542. doi: 10.1007/s10928-023-09871-x. Epub 2023 Jun 29. J Pharmacokinet Pharmacodyn. 2024. PMID: 37386340 Free PMC article. Review.
-
Low-molecular weight inhibitors of the alternative complement pathway.Immunol Rev. 2023 Jan;313(1):339-357. doi: 10.1111/imr.13143. Epub 2022 Oct 11. Immunol Rev. 2023. PMID: 36217774 Free PMC article. Review.
-
Unravelling the impact of SARS-CoV-2 on hemostatic and complement systems: a systems immunology perspective.Front Immunol. 2025 Jan 13;15:1457324. doi: 10.3389/fimmu.2024.1457324. eCollection 2024. Front Immunol. 2025. PMID: 39885991 Free PMC article.
-
Artificial intelligence-driven rational design of ionizable lipids for mRNA delivery.Nat Commun. 2024 Dec 30;15(1):10804. doi: 10.1038/s41467-024-55072-6. Nat Commun. 2024. PMID: 39738043 Free PMC article.
-
Editorial: Model-informed decision making in the preclinical stages of pharmaceutical research and development.Front Pharmacol. 2023 Apr 12;14:1184914. doi: 10.3389/fphar.2023.1184914. eCollection 2023. Front Pharmacol. 2023. PMID: 37124233 Free PMC article. No abstract available.
References
-
- Alper C. A., Rosen F. S. (1984). “Metabolism of Radiolabelled Complement Proteins in Health and Disease,” in Pathophysiology of Plasma Protein Metabolism (Heidelberg, Germany: Springer Link; ), 195–220. 10.1007/978-1-349-06680-3_10 - DOI
LinkOut - more resources
Full Text Sources
Miscellaneous