. 2022 Apr 21:66.
doi: 10.29219/fnr.v66.8224. eCollection 2022.

Resveratrol regulates Hsp60 in HEK 293T cells during activation of SIRT1 revealed by nascent protein labeling strategy

Affiliations

Resveratrol regulates Hsp60 in HEK 293T cells during activation of SIRT1 revealed by nascent protein labeling strategy

Tian Su et al. Food Nutr Res. .

Abstract

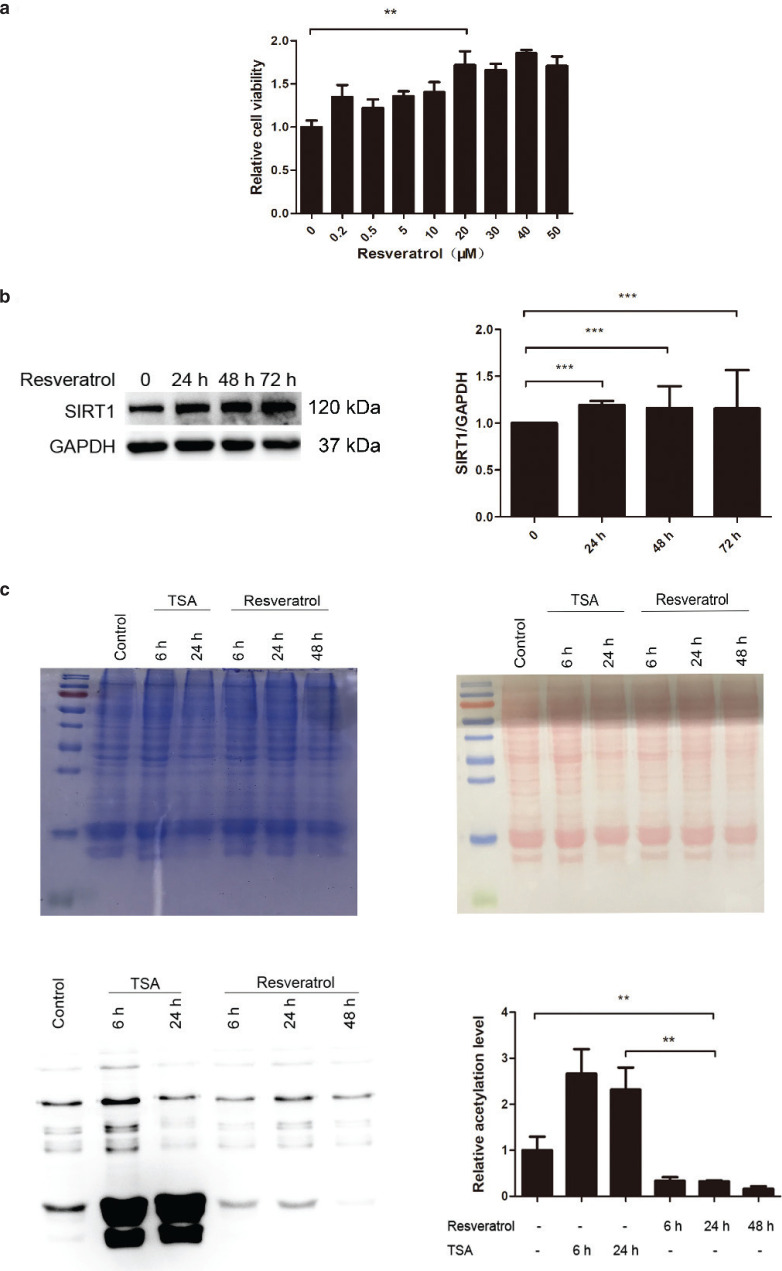
Background: Resveratrol, a well-known natural compound and nutrient, activates the deacetylation ability of SIRT1, demonstrating p53-dependent apoptosis functions in many diseases. However, the nascent proteomic fluctuation caused by resveratrol is still unclear.

Objective: In this study, we investigated the effect of resveratrol on the nascent proteome and transcriptome initiated by SIRT1 activation, and we explored the mechanism of resveratrol in HEK 293T cells.

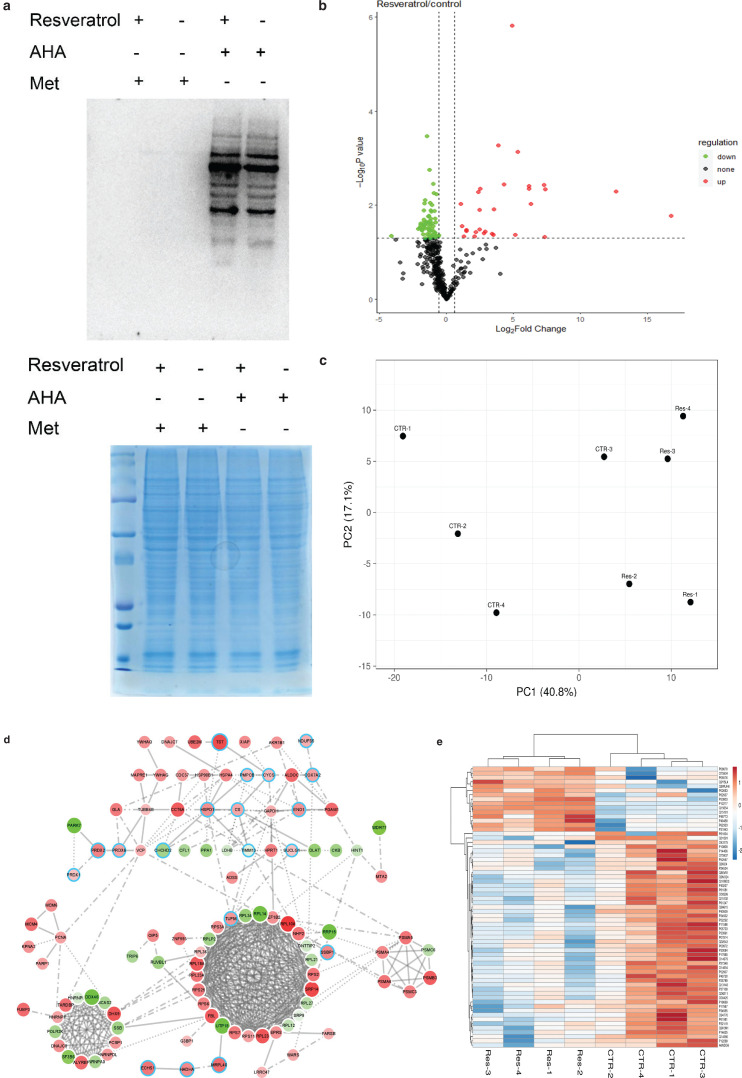
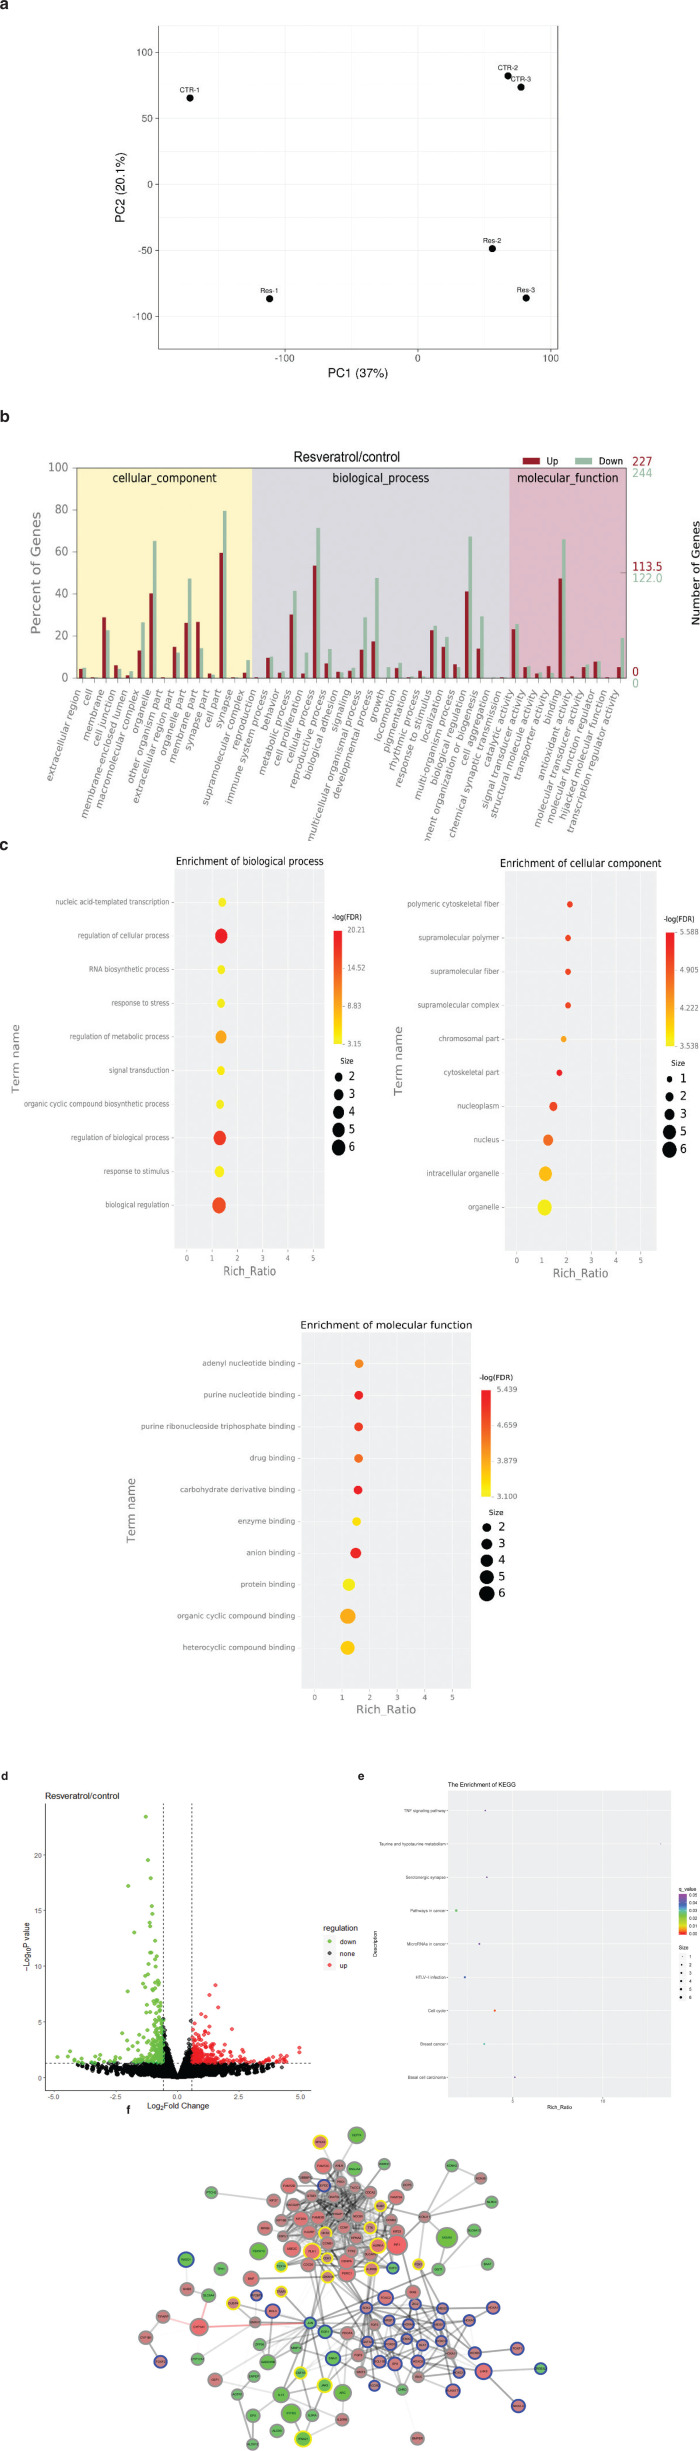
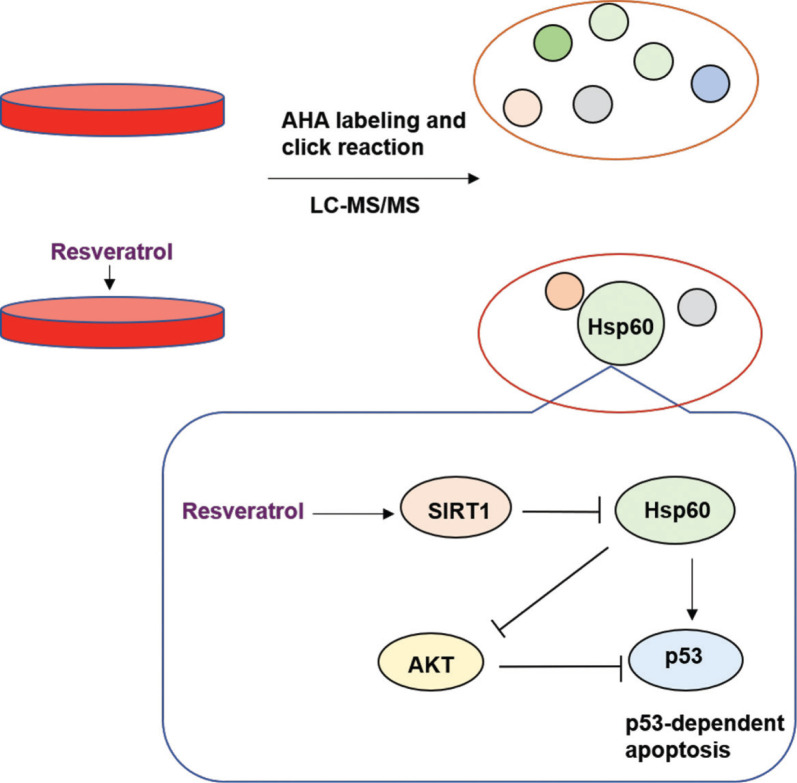
Methods: Bioorthogonal noncanonical amino acid tagging (BONCAT) is a method used to metabolically label nascent proteins. In this strategy, L-azidohomoalanine (AHA) was used to replace methionine (Met) under different conditions. Taking advantage of the click reaction between AHA and terminal alkyne- and disulfide-functionalized agarose resin (TAD resin), we were able to efficiently separate stimulation responsive proteins from the pre-existing proteome. Resveratrol responsive proteins were identified by Liquid Chromatograph-Mass Spectrometer/Mass Spectrometer (LC-MS/MS). Furthermore, changes in mRNA levels were analyzed by transcriptome sequencing.

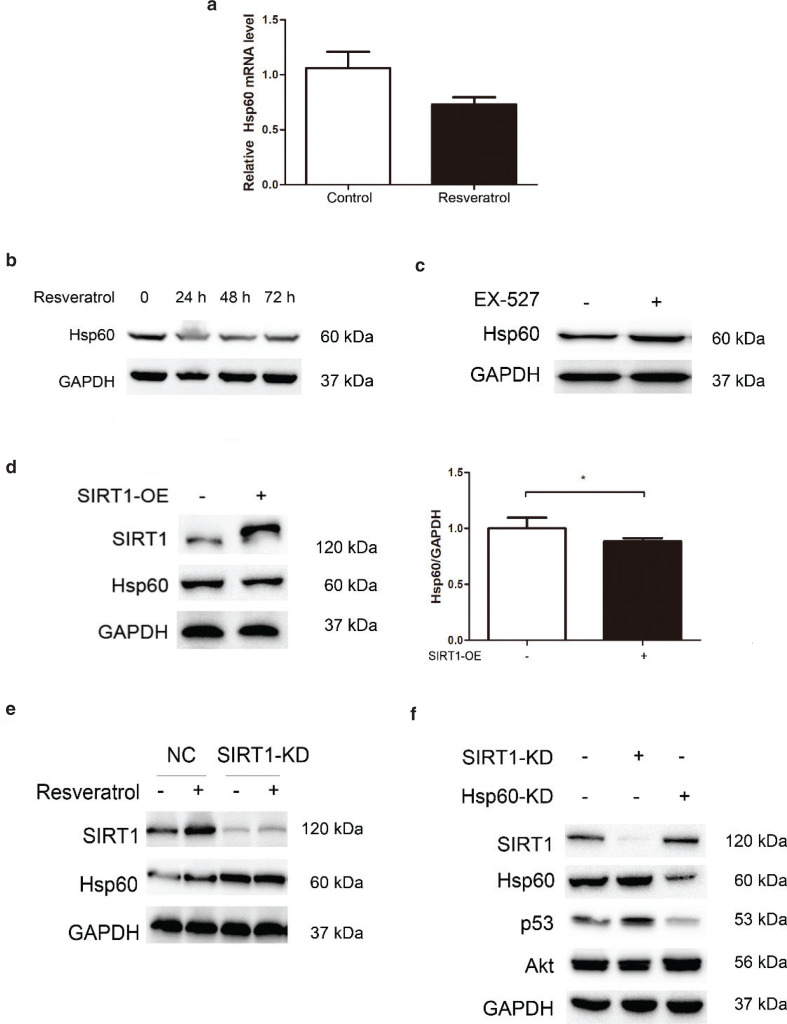
Results: Integrational analysis revealed a resveratrol response in HEK 293T cells and showed that Hsp60 was downregulated at both the nascent protein and mRNA levels. Knockdown of SIRT1 and Hsp60 provides evidence that resveratrol downregulated Hsp60 through SIRT1 and that Hsp60 decreased p53 through the Akt pathway.

Conclusions: This study revealed dynamic changes in the nascent proteome and transcriptome in response to resveratrol in HEK 293T cells and demonstrated that resveratrol downregulates Hsp60 by activating SIRT1, which may be a possible mechanism by which resveratrol prevents p53-dependent apoptosis by regulating Hsp60.

Keywords: Hsp60; SIRT1; nascent proteome; resveratrol; transcriptome.


Conflict of interest statement

The authors declare no conflict of interest. This research was supported by research grants from the National Natural Science Foundation of China (grant number 31670781) and Innovation Capability Support Program of Shaanxi Province (grant numbers 2018PT-28, 2017KTPT-04).

Figures

Fig. 1
Fig. 1
Effects of resveratrol on cell viability, SIRT1 expression, and global acetylation in HEK 293T cells. (a) Cell viability was detected by MTT assay. (b) Resveratrol increased SIRT1 protein levels after resveratrol treatment. (c) Resveratrol decreased global acetylation. The pooled data are shown here as the mean ± SEM, and the significant differences compared to control cells are shown by P < 0.01 (**) and P < 0.001 (***).
Fig. 2
Fig. 2
Effects of resveratrol on the nascent proteome. (a) Western blotting for streptavidin horseradish peroxidase (HRP). (b) Volcano plot showing newly synthesized protein with significant changes in mass spectrometry results. The abscissa is the logarithm of the fold change in differential protein expression in the comparison group. Each point represents a specific protein. Significantly upregulated proteins are labeled with red, and significantly downregulated proteins are labeled with green. Proteins that were not significantly differentially expressed are labeled with black. (c) PCA-SVD with imputation was used to calculate principal components. CTR: control. Res: resveratrol. (d) Dramatic changes in nascent proteins were visualized by STRING database. The cutoff was set as 1.5-fold change and P < 0.05. The nascent protein level reduced by resveratrol is shown in red, and the nascent protein level increased by resveratrol is shown in green. The size of the circle indicates the fold change, and the large circle indicates a higher fold change. Mitochondrial or redox proteins are highlighted in blue. (e) Heatmap of nascent proteins quantified from cells with different treatments.
Fig. 3
Fig. 3
RNA sequencing (RNA-seq) reveals the transcriptome in response to resveratrol. (a) PCA-SVD with imputation was used to calculate principal components. CTR: control. Res: resveratrol. (b) Enrichment of the significantly upregulated or downregulated genes at the secondary GO terms. The abscissa is the GO term. The left ordinate is the percentage of the number of genes, and the right ordinate is the number of genes. (c) GO analysis. The abscissa represents the enrichment ratio, and the ordinate represents different GO items. (d) Volcano plot showing genes with significant changes in RNA sequencing. The abscissa is the logarithm of the fold change in differential protein expression in the comparison group. Each point represents a specific gene. Genes that were significantly upregulated are labeled with red, and genes that were significantly downregulated are labeled with green. Genes that were not significantly differentially expressed are labeled with black. (e) KEGG analysis. The abscissa is the enriching ratio, and the ordinate represents the name of the KEGG pathway. The size of the dot represents the number of differential genes in this pathway, and the color represents the degree of enrichment of the KEGG entry. (f) Genes showing dramatic changes were visualized by STRING database. The cutoff was set as 1.5-fold change and P < 0.05. The mRNA level reduced by resveratrol is shown in red, and the mRNA level increased by resveratrol is shown in green. The size of the circle indicates the fold change, and the large circle indicates a higher fold change. Transcriptional regulatory genes are highlighted by blue circles, and the kinases are highlighted by yellow circles.
Fig. 4
Fig. 4
Resveratrol decreases Hsp60 through SIRT1 regulation. (a) The mRNA level of Hsp60 was decreased. (b) Resveratrol decreased Hsp60 expression. (c) Inhibition of SIRT1 activity increased Hsp60 expression. (d) Hsp60 was decreased in SIRT1-OE cells. The pooled data are shown here as the mean ± SEM, and the significant differences compared to the control cells are shown by P < 0.05 (*). (e) Hsp60 was increased in SIRT1-KD cells. (f) Effects of knocking down Hsp60 on Akt and p53 protein expression.
Fig. 5
Fig. 5
Resveratrol decreases Hsp60 expression via regulation of SIRT1 as revealed by a nascent protein labeling strategy. Resveratrol-induced activation of SIRT1 leads to a reduction in Hsp60. The reduction in Hsp60 influenced Akt and p53 expression, suggesting that Hsp60 affects p53-dependent apoptosis.

Similar articles

Cited by

References

    1. Tyagi A, Singh RP, Agarwal C, Siriwardana S, Sclafani RA, Agarwal R. Resveratrol causes Cdc2-tyr15 phosphorylation via ATM/ATR–Chk1/2–Cdc25C pathway as a central mechanism for S phase arrest in human ovarian carcinoma Ovcar-3 cells. Carcinogenesis 2005; 26(11): 1978–87. doi: 10.1093/carcin/bgi165 - DOI - PubMed
    1. Rauf A, Imran M, Butt MS, Nadeem M, Peters DG, Mubarak MS. Resveratrol as an anti-cancer agent: a review. Crit Rev Food Sci Nutr 2018; 58(9): 1428–47. doi: 10.1080/10408398.2016.1263597 - DOI - PubMed
    1. Le Corre L, Chalabi N, Delort L, Bignon YJ, Bernard-Gallon DJ. Resveratrol and breast cancer chemoprevention: molecular mechanisms. Mol Nutr Food Res 2005; 49(5): 462–71. doi: 10.1002/mnfr.200400094 - DOI - PubMed
    1. Zhang Y, Chen ML, Zhou Y, Yi L, Gao YX, Ran L, et al. . Resveratrol improves hepatic steatosis by inducing autophagy through the cAMP signaling pathway. Mol Nutr Food Res 2015; 59(8): 1443–57. doi: 10.1002/mnfr.201500016 - DOI - PubMed
    1. Cheng Z, Schmelz EM, Liu D, Hulver MW. Targeting mitochondrial alterations to prevent type 2 diabetes – evidence from studies of dietary redox-active compounds. Mol Nutr Food Res 2014; 58(8): 1739–49. doi: 10.1002/mnfr.201300747 - DOI - PubMed