

Identification of Tumor Microenvironment and DNA Methylation-Related Prognostic Signature for Predicting Clinical Outcomes and Therapeutic Responses in Cervical Cancer
- PMID: 35517856
- PMCID: PMC9061945
- DOI: 10.3389/fmolb.2022.872932
Identification of Tumor Microenvironment and DNA Methylation-Related Prognostic Signature for Predicting Clinical Outcomes and Therapeutic Responses in Cervical Cancer
Abstract
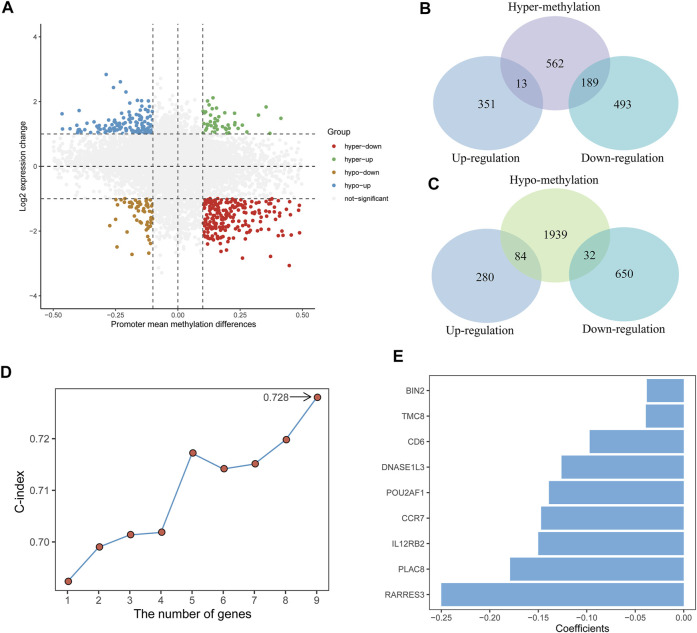
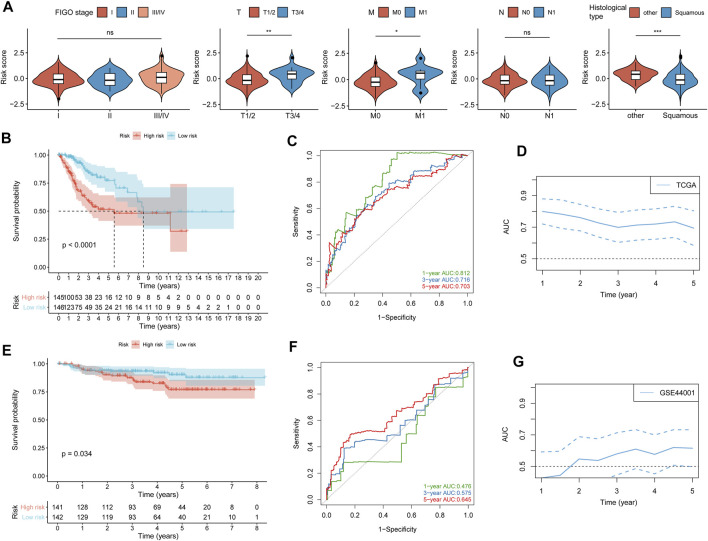
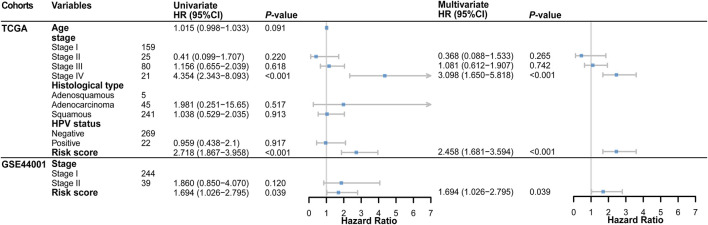
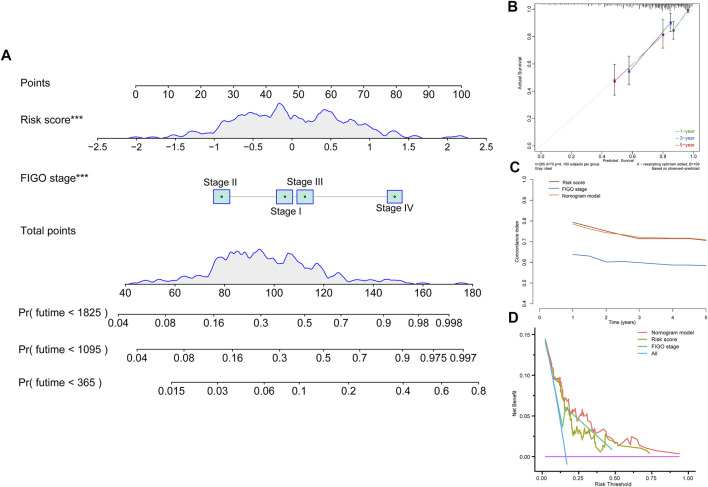
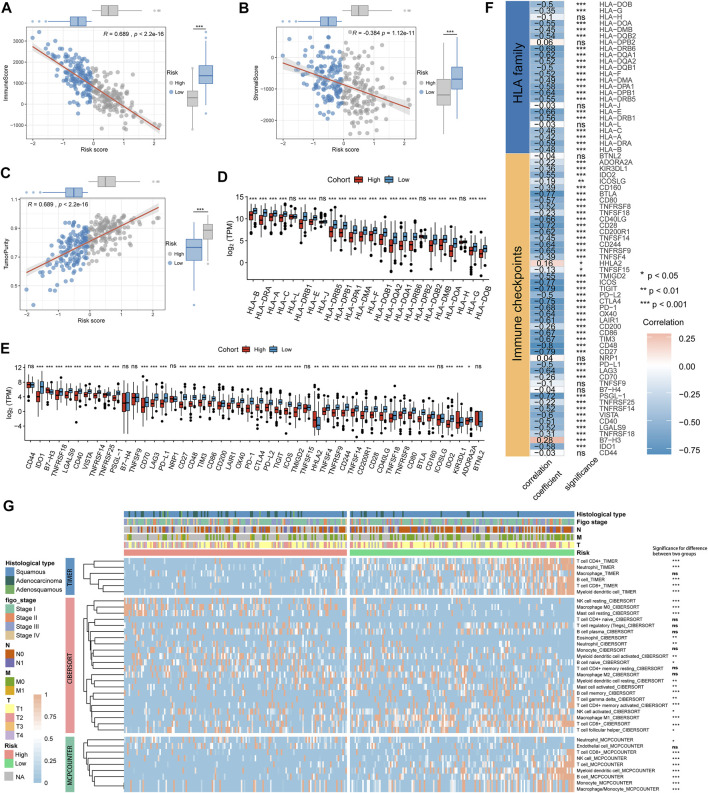
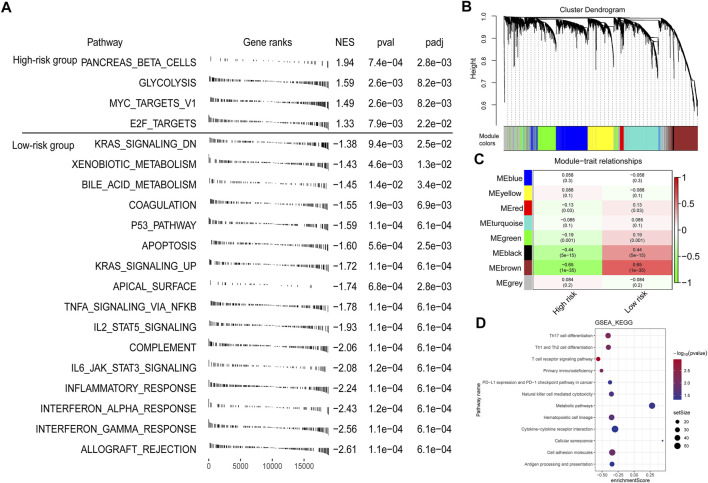
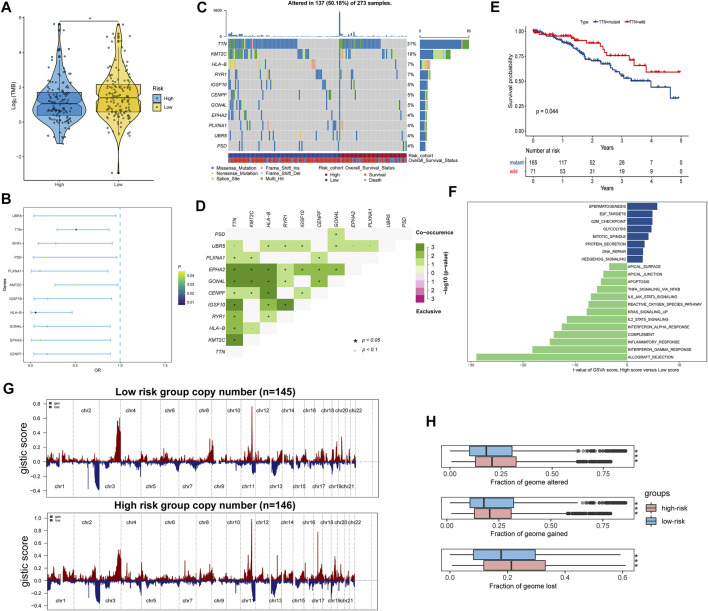
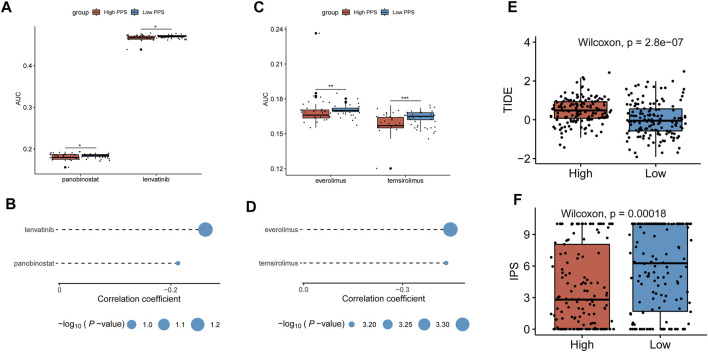
Background: Tumor microenvironment (TME) has been reported to have a strong association with tumor progression and therapeutic outcome, and epigenetic modifications such as DNA methylation can affect TMB and play an indispensable role in tumorigenesis. However, the potential mechanisms of TME and DNA methylation remain unclear in cervical cancer (CC). Methods: The immune and stromal scores of TME were generated by the ESTIMATE algorithm for CC patients in The Cancer Genome Atlas (TCGA) database. The TME and DNA methylation-related genes were identified by the integrative analysis of DNA promoter methylation and gene expression. The least absolute shrinkage and selection operator (LASSO) Cox regression was performed 1,000 times to further identify a nine-gene TME and DNA methylation-related prognostic signature. The signature was further validated in Gene Expression Omnibus (GEO) dataset. Then, the identified signature was integrated with the Federation International of Gynecology and Obstetrics (FIGO) stage to establish a composite prognostic nomogram. Results: CC patients with high immunity levels have better survival than those with low immunity levels. Both in the training and validation datasets, the risk score of the signature was an independent prognosis factor. The composite nomogram showed higher accuracy of prognosis and greater net benefits than the FIGO stage and the signature. The high-risk group had a significantly higher fraction of genome altered than the low-risk group. Eleven genes were significantly different in mutation frequencies between the high- and low-risk groups. Interestingly, patients with mutant TTN had better overall survival (OS) than those with wild type. Patients in the low-risk group had significantly higher tumor mutational burden (TMB) than those in the high-risk group. Taken together, the results of TMB, immunophenoscore (IPS), and tumor immune dysfunction and exclusion (TIDE) score suggested that patients in the low-risk group may have greater immunotherapy benefits. Finally, four drugs (panobinostat, lenvatinib, everolimus, and temsirolimus) were found to have potential therapeutic implications for patients with a high-risk score. Conclusions: Our findings highlight that the TME and DNA methylation-related prognostic signature can accurately predict the prognosis of CC and may be important for stratified management of patients and precision targeted therapy.
Keywords: DNA methylation; cervical cancer; drug response; immunotherapy response; prognostic model; tumor microenvironment.
Copyright © 2022 Liu, Zhai, Wang, Liu, Liu, Zhu, Wang, Tian and Zhang.
Conflict of interest statement
The authors declare that the research was conducted in the absence of any commercial or financial relationships that could be construed as a potential conflict of interest.
Figures
Similar articles
-
Identification and validation of a dysregulated TME-related gene signature for predicting prognosis, and immunological properties in bladder cancer.Front Immunol. 2023 Oct 27;14:1213947. doi: 10.3389/fimmu.2023.1213947. eCollection 2023. Front Immunol. 2023. PMID: 37965307 Free PMC article.
-
Computational construction of TME-related lncRNAs signature for predicting prognosis and immunotherapy response in clear cell renal cell carcinoma.J Clin Lab Anal. 2022 Aug;36(8):e24582. doi: 10.1002/jcla.24582. Epub 2022 Jul 8. J Clin Lab Anal. 2022. PMID: 35808868 Free PMC article.
-
Identification of prognostic gene signature associated with microenvironment of lung adenocarcinoma.PeerJ. 2019 Nov 29;7:e8128. doi: 10.7717/peerj.8128. eCollection 2019. PeerJ. 2019. PMID: 31803536 Free PMC article.
-
Construction of a neutrophil extracellular trap formation-related gene model for predicting the survival of lung adenocarcinoma patients and their response to immunotherapy.Transl Lung Cancer Res. 2024 Dec 31;13(12):3407-3425. doi: 10.21037/tlcr-24-463. Epub 2024 Dec 27. Transl Lung Cancer Res. 2024. PMID: 39830760 Free PMC article.
-
Prognostic Biomarkers for Survival in Nasopharyngeal Carcinoma: A Systematic Review of the Literature.Cancers (Basel). 2022 Apr 24;14(9):2122. doi: 10.3390/cancers14092122. Cancers (Basel). 2022. PMID: 35565251 Free PMC article. Review.
Cited by
-
Candidate Genes and Pathways in Cervical Cancer: A Systematic Review and Integrated Bioinformatic Analysis.Cancers (Basel). 2023 Jan 30;15(3):853. doi: 10.3390/cancers15030853. Cancers (Basel). 2023. PMID: 36765810 Free PMC article. Review.
-
Panobinostat (LBH589) combined with AM1241 induces cervical cancer cell apoptosis through autophagy pathway.BMC Pharmacol Toxicol. 2023 Sep 22;24(1):45. doi: 10.1186/s40360-023-00686-7. BMC Pharmacol Toxicol. 2023. PMID: 37740231 Free PMC article.
-
Aberrant DNA methylation as a key modulator of cell death pathways: insights into cancer progression and other diseases.Funct Integr Genomics. 2025 Mar 1;25(1):50. doi: 10.1007/s10142-025-01552-x. Funct Integr Genomics. 2025. PMID: 40024973 Review.
-
The role of epigenetics in women's reproductive health: the impact of environmental factors.Front Endocrinol (Lausanne). 2024 Sep 13;15:1399757. doi: 10.3389/fendo.2024.1399757. eCollection 2024. Front Endocrinol (Lausanne). 2024. PMID: 39345884 Free PMC article. Review.
-
Integrated genomic analysis defines molecular subgroups in dilated cardiomyopathy and identifies novel biomarkers based on machine learning methods.Front Genet. 2023 Feb 7;14:1050696. doi: 10.3389/fgene.2023.1050696. eCollection 2023. Front Genet. 2023. PMID: 36824437 Free PMC article.
References
LinkOut - more resources
Full Text Sources