Review
. 2020 Oct 1;10(60):36337-36348.
doi: 10.1039/d0ra08003a.

G-Protein coupled receptors: structure and function in drug discovery

Affiliations
Review

G-Protein coupled receptors: structure and function in drug discovery

Chiemela S Odoemelam et al. RSC Adv. .

Abstract

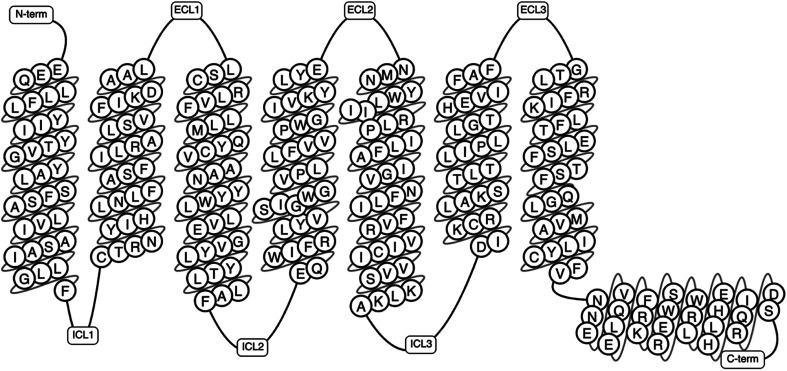
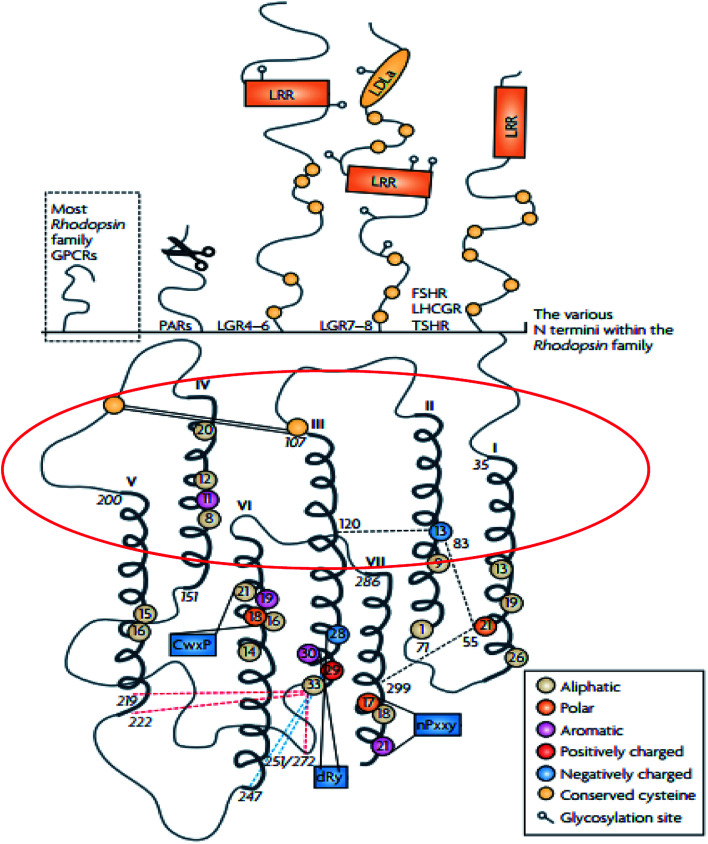
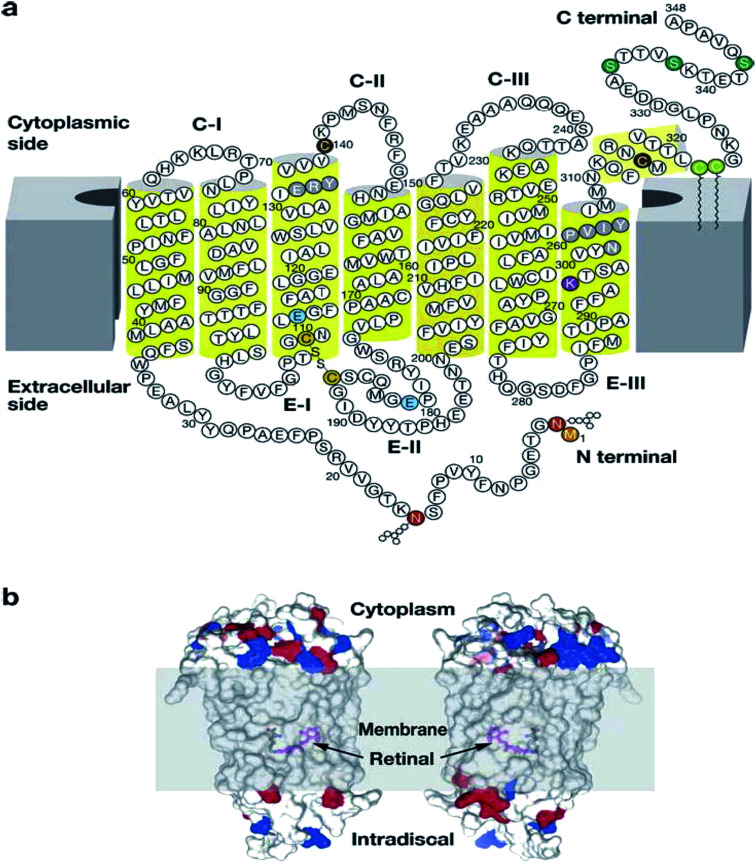
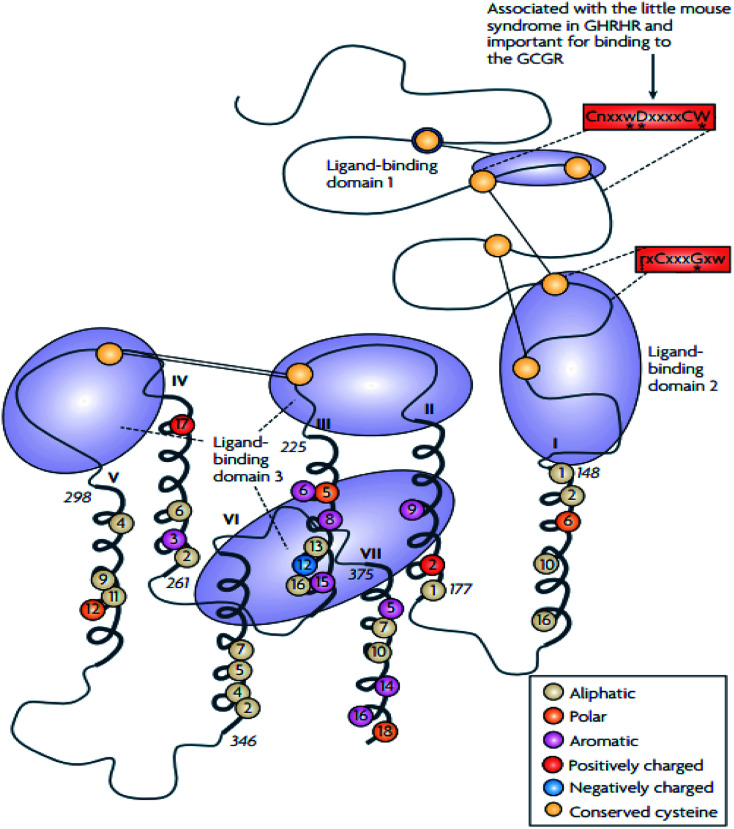
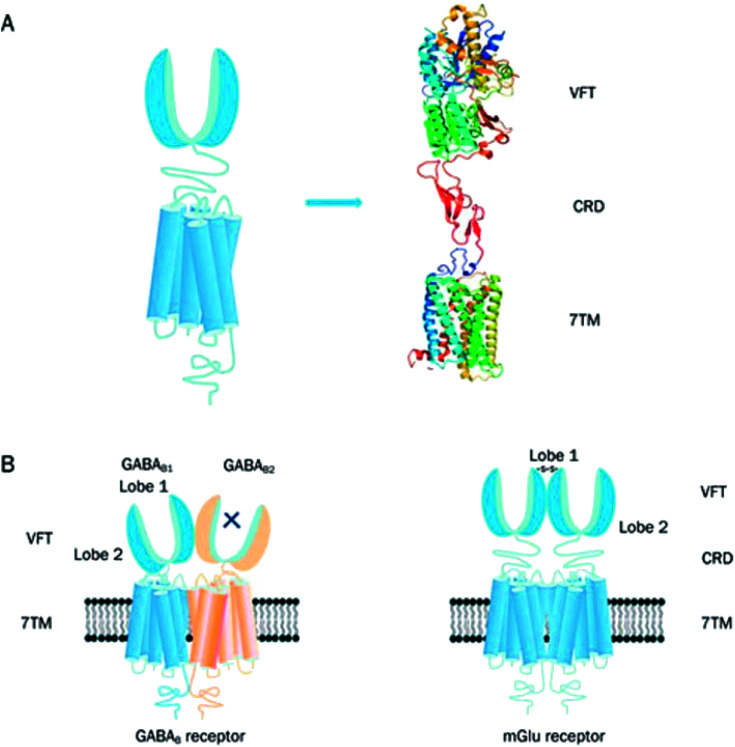
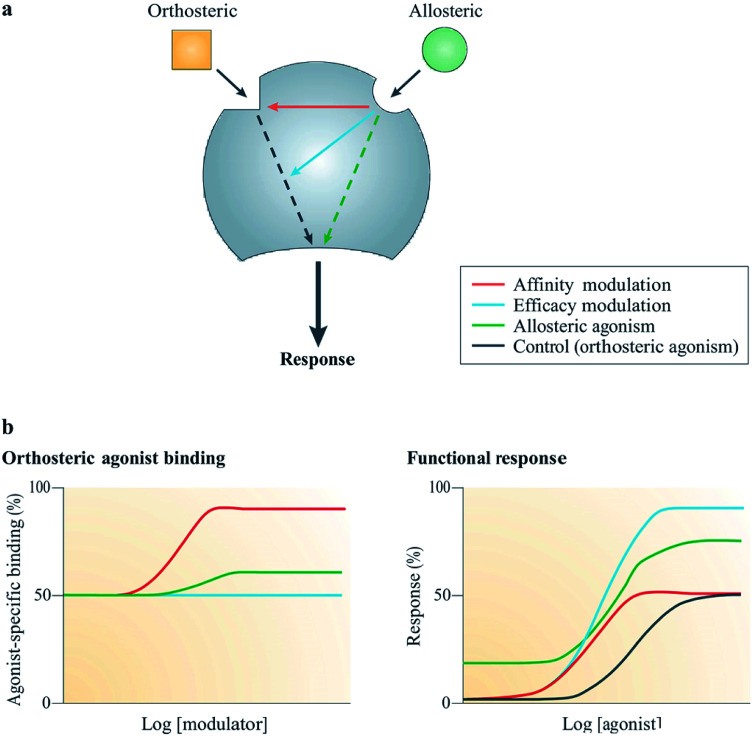
The G-protein coupled receptors (GPCRs) superfamily comprise similar proteins arranged into families or classes thus making it one of the largest in the mammalian genome. GPCRs take part in many vital physiological functions making them targets for numerous novel drugs. GPCRs share some distinctive features, such as the seven transmembrane domains, they also differ in the number of conserved residues in their transmembrane domain. Here we provide an introductory and accessible review detailing the computational advances in GPCR pharmacology and drug discovery. An overview is provided on family A-C GPCRs; their structural differences, GPCR signalling, allosteric binding and cooperativity. The dielectric constant (relative permittivity) of proteins is also discussed in the context of site-specific environmental effects.


Conflict of interest statement

There are no conflicts to declare.

Figures

Fig. 1
Fig. 1. A schematic representation of a GPCR showing the transmembrane domains, N-terminus, C-terminus, the intracellular and extracellular loops (generated using GPCRDB Tools, https://gpcrdb.org/).
Fig. 2
Fig. 2. Schematic diagram showing the structure of family A GPCRs generated using ClustalW. Reprinted with permission from Springer Nature: Springer Nature, Nature Reviews Drug Discovery, Structural diversity of G protein-coupled receptors and significance for drug discovery, M. C. Lagerström and H. B. Schiöth, Copyright (2008). The upper section of shows the differences in the secondary structure of the N termini of the family A receptors. The scissor image indicates the cleavage site of the protease activated receptors whilst in the lower part of the image, the schematic TMD regions show the consensus of an alignment generated using ClustalW 1.82. In addition, the area circled in red describes the elliptical orientation. Residues conserved in all eight sequences are displayed as circles in which conserved aromatic residues are shown in purple, polar in orange, aliphatic residues are shown in beige, positively charged in red and negatively charged in blue.
Fig. 3
Fig. 3. Illustration showing the modification of rhodopsin and its orientation in membranes. Reprinted with permission from Annual Reviews: Annual Reviews, Annual review of biochemistry, G protein–coupled receptor rhodopsin, K. Palczewski, Copyright (2006). (a) Two-dimensional illustration of rhodopsin. The polypeptide of rhodopsin is seen to cross the membrane seven times with C-I, C-II, C-III comparable to the cytoplasmic loops and E-I, E-II, E-III to the extracellular loops. The yellow cylinders represent the transmembrane region (b) depicts the location of the chromophore and the charges on the extracellular and cytoplasmic surface of rhodopsin. Red and blue colours represent negative and positive charged residues respectively, while the location of the chromophore is revealed by deleting fragments of the transmembrane helices.
Fig. 4
Fig. 4. Schematic diagram showing the structure of family B GPCRs generated using ClustalW. Reprinted with permission from Springer Nature: Springer Nature, Nature Reviews Drug Discovery, Structural diversity of G protein-coupled receptors and significance for drug discovery, M. C. Lagerström and H. B. Schiöth, Copyright (2008). The residues conserved in all 15 sequences are displayed as circles, the conserved polar residues are shown in orange, the aromatic residues in purple, the aliphatic residues in beige, the positively and negatively charged residues are shown in red and blue respectively. The uppercase letters show the completely conversed positions, the lowercase letters show the well-conserved positions (>50%) while the letter “x” show the variable positions. The conserved sequence motifs which are found in the TMD of the family B GPCRs are surrounded by red boxes. The conserved cysteine residues are depicted as yellow circles, the cysteine bridges between EL1 and EL2 are shown as two straight lines while the N-terminal cysteine bridges are drawn as lines.
Fig. 5
Fig. 5. Graphical illustration of family C GPCR structure. Reprinted with permission from Springer Nature: Springer Nature, Acta Pharmacologica Sinica, Structure and ligand recognition of class C GPCRs, L. Chun, W.-h. Zhang and J.-f. Liu (2012). (A) Represents the structural organisation of family C GPCRs. Family C GPCRs have a peculiar structure which comprises of VFT with two lobes separated by an orthosteric binding pocket, a CRD and a TMD except for GABAB receptor. (B) Graphical illustration of two members family C GPCRs; GABAB receptor (heterodimer) and mGlu receptor (homodimer). There is a direct link between VFT and TMD in the GABAB receptors and the two subunits, GABAB1 and GABAB2 make an obligatory heterodimer while the VFT connects to TMD using CRD in the mGlu receptors. The mGlu receptors form homodimers which can potentially offer two other orthosteric binding pocket per dimer.
Fig. 6
Fig. 6. Mechanism of action of allosteric modulators. Reprinted with permission from Springer Nature: Springer Nature, Nature Reviews Drug Discovery, Allosteric modulators of GPCRs: a novel approach for the treatment of CNS disorders, P. J. Conn, A. Christopoulos and C. W. Lindsley, Copyright (2009). (a) Allosteric ligands bind to an alternative binding site on a receptor to modulate the activities of an orthosteric ligand efficacy (blue) and/or affinity (red). A number of allosteric ligands can also directly disrupt signalling in their own right (green). (b) Results from simulation show the effects on the function (right) or binding (left) of an orthosteric agonist mediated by three allosteric potentiators depicted in red, blue and green; red enhanced orthosteric agonist affinity only, blue enhanced only the efficacy, green was observed to modestly enhance both efficacy and affinity, as well as showing allosteric agonism.

References

    1. Dijkman P. M. Castell O. K. Goddard A. D. Munoz-Garcia J. C. de Graaf C. Wallace M. I. Watts A. Nat. Commun. 2018;9:1710. doi: 10.1038/s41467-018-03727-6. - DOI - PMC - PubMed
    1. Kroeze W. K. Sheffler D. J. Roth B. L. J. Cell Sci. 2003;116:4867. doi: 10.1242/jcs.00902. - DOI - PubMed
    1. Fredriksson R. Lagerström M. C. Lundin L.-G. Schiöth H. B. Mol. Pharmacol. 2003;63:1256. doi: 10.1124/mol.63.6.1256. - DOI - PubMed
    1. Schiöth H. B. Fredriksson R. Gen. Comp. Endocrinol. 2005;142:94–101. doi: 10.1016/j.ygcen.2004.12.018. - DOI - PubMed
    1. Ghosh E. Kumari P. Jaiman D. Shukla A. K. Nat. Rev. Mol. Cell Biol. 2015;16:69–81. doi: 10.1038/nrm3933. - DOI - PubMed