

Association of a wide range of individual chronic diseases and their multimorbidity with brain volumes in the UK Biobank: A cross-sectional study
- PMID: 35518119
- PMCID: PMC9065617
- DOI: 10.1016/j.eclinm.2022.101413
Association of a wide range of individual chronic diseases and their multimorbidity with brain volumes in the UK Biobank: A cross-sectional study
Abstract
Background: Little is known regarding associations of conventional and emerging diseases and their multimorbidity with brain volumes.
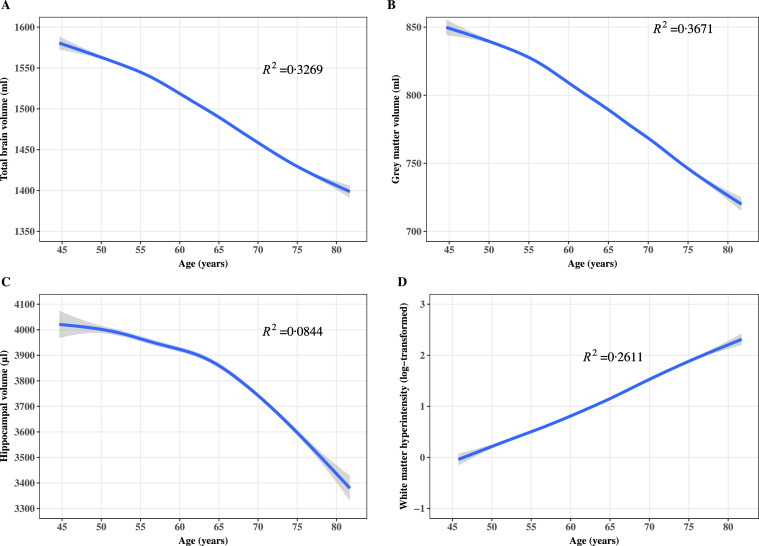
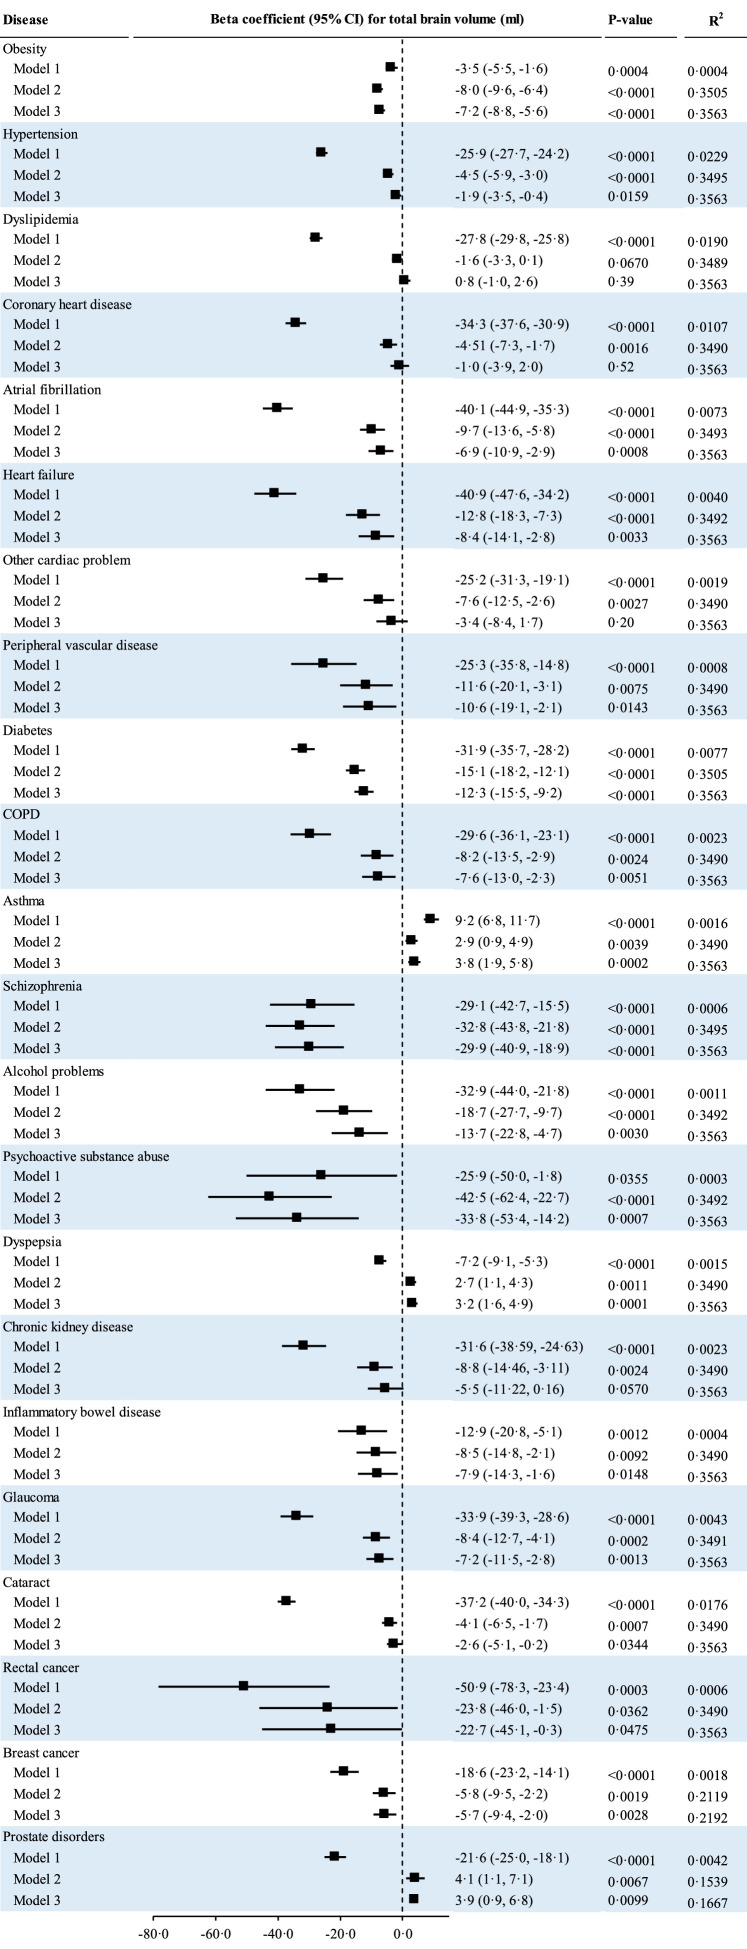
Methods: This cross-sectional study included 36,647 European ancestry individuals aged 44-81 years with brain magnetic resonance imaging data from UK Biobank. Brain volumes were measured between 02 May 2014 and 31 October 2019. General linear regression models were used to associate 57 individual major diseases with brain volumes. Latent class analysis was used to identify multimorbidity patterns. A multimorbidity score for brain volumes was computed based on the estimates for individual groups of diseases.
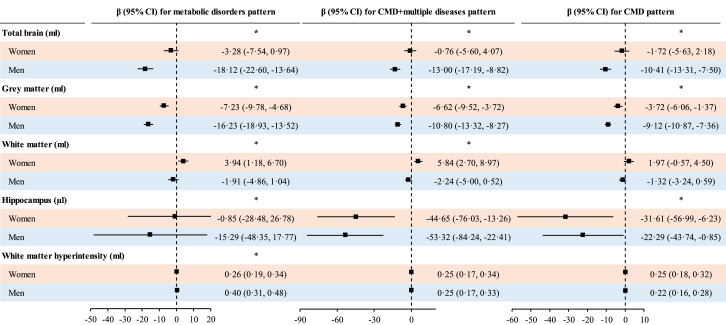
Findings: Out of 57 major diseases, 16 were associated with smaller volumes of total brain, 14 with smaller volumes of grey matter, and six with smaller hippocampus volumes, and four major diseases were associated with higher white matter hyperintensity (WMH) load after adjustment for all other diseases. The leading contributors to the variance of total brain volume were hypertension (R2=0·0229), dyslipidemia (0·0190), cataract (0·0176), coronary heart disease (0·0107), and diabetes (0·0077). We identified six major multimorbidity patterns and multimorbidity patterns of cardiometabolic disorders (CMD), and CMD-multiple disorders, and metabolic disorders were independently associated with smaller volumes of total brain (β (95% CI): -6·6 (-8·9, -4·3) ml, -7·3 (-10·4, -4·1) ml, and -10·4 (-13·5, -7·3) ml, respectively), grey matter (-7·1 (-8·5, -5·7) ml, -9·0 (-10·9, -7·1) ml, and -11·8 (-13·6, -9·9) ml, respectively), and higher WMH load (0·23 (0·19, 0·27), 0·25 (0·19, 0·30), and 0·33 (0·27, 0·39), respectively) after adjustment for geographic, socioeconomic, and lifestyle factors (all P-values<0·0001). The percentage of the variance of total brain volume explained by multimorbidity patterns, multimorbidity defined by the number of diseases, and multimorbidity score was 1·2%, 3·1%, and 7·2%, respectively. Associations between CMD-multiple disorders pattern, and metabolic disorders pattern and volumes of total brain, grey matter, and WMH were stronger in men than in women. Associations between multimorbidity and brain volumes were stronger in younger than in older individuals.
Interpretation: Besides conventional diseases, we found an association between numerous emerging diseases and smaller brain volumes. CMD-related multimorbidity patterns are associated with smaller brain volumes. Men or younger adults with multimorbidity are more in need of care for promoting brain health. These findings are from an association study and will need confirmation.
Funding: The Fundamental Research Funds of the State Key Laboratory of Ophthalmology, Project of Investigation on Health Status of Employees in Financial Industry in Guangzhou, China (Z012014075), Science and Technology Program of Guangzhou, China (202,002,020,049).
Keywords: AD, Alzheimer’s disease; APOE4, Apolipoprotein E ε4; BMI, body mass index; Brain volume; CHD, coronary heart disease; CI, confidence interval; CKD, chronic kidney disease; CMD, cardiometabolic disorders; COPD, chronic obstructive pulmonary disease; CVD, cardiovascular disease; FDR, false discovery rate; Grey matter; Hippocampus; Major diseases; Moderation analysis; Multimorbidity; OLS, ordinary least squares; WMH, white matter hyperintensity; White matter hyperintensity.
© 2022 The Author(s).
Conflict of interest statement
The authors have no conflicts of interest to declare that are relevant to the content of this article.
Figures
Similar articles
-
Association of a wide range of chronic diseases and apolipoprotein E4 genotype with subsequent risk of dementia in community-dwelling adults: A retrospective cohort study.EClinicalMedicine. 2022 Mar 13;45:101335. doi: 10.1016/j.eclinm.2022.101335. eCollection 2022 Mar. EClinicalMedicine. 2022. PMID: 35299656 Free PMC article.
-
Characterization of brain morphology associated with metabolic dysfunction-associated steatotic liver disease in the UK Biobank.Diabetes Obes Metab. 2025 Jun;27(6):3419-3430. doi: 10.1111/dom.16362. Epub 2025 Apr 2. Diabetes Obes Metab. 2025. PMID: 40171859
-
Statin use is associated with higher white matter hyperintensity volumes and lower grey matter volumes.Brain Commun. 2024 Nov 20;6(6):fcae417. doi: 10.1093/braincomms/fcae417. eCollection 2024. Brain Commun. 2024. PMID: 39619332 Free PMC article.
-
Associations between cardiometabolic multimorbidity and cerebrospinal fluid biomarkers of Alzheimer's disease pathology in cognitively intact adults: the CABLE study.Alzheimers Res Ther. 2024 Feb 6;16(1):28. doi: 10.1186/s13195-024-01396-w. Alzheimers Res Ther. 2024. PMID: 38321520 Free PMC article.
-
Folic acid supplementation and malaria susceptibility and severity among people taking antifolate antimalarial drugs in endemic areas.Cochrane Database Syst Rev. 2022 Feb 1;2(2022):CD014217. doi: 10.1002/14651858.CD014217. Cochrane Database Syst Rev. 2022. PMID: 36321557 Free PMC article.
Cited by
-
Essential New Complexity-Based Themes for Patient-Centered Diagnosis and Treatment of Dementia and Predementia in Older People: Multimorbidity and Multilevel Phenomenology.J Clin Med. 2024 Jul 18;13(14):4202. doi: 10.3390/jcm13144202. J Clin Med. 2024. PMID: 39064242 Free PMC article. Review.
-
Association of mild and complex multimorbidity with structural brain changes in older adults: A population-based study.Alzheimers Dement. 2024 Mar;20(3):1958-1965. doi: 10.1002/alz.13614. Epub 2024 Jan 3. Alzheimers Dement. 2024. PMID: 38170758 Free PMC article.
-
Grip Strength and Age-Related Ocular Diseases: Insights from Observational, Mendelian Randomization, and Mediation Analyses.Ophthalmol Sci. 2025 May 21;5(5):100831. doi: 10.1016/j.xops.2025.100831. eCollection 2025 Sep-Oct. Ophthalmol Sci. 2025. PMID: 40636510 Free PMC article.
-
Multimorbidity in dementia: Current perspectives and future challenges.Alzheimers Dement. 2025 Aug;21(8):e70546. doi: 10.1002/alz.70546. Alzheimers Dement. 2025. PMID: 40755143 Free PMC article. Review.
-
Prevalence of Use of Potentially Inappropriate Medications Among Older Adults Worldwide: A Systematic Review and Meta-Analysis.JAMA Netw Open. 2023 Aug 1;6(8):e2326910. doi: 10.1001/jamanetworkopen.2023.26910. JAMA Netw Open. 2023. PMID: 37531105 Free PMC article.
References
-
- United Nations Department of Economic and Social Affairs, Population Division . United Nations Department of Economic and Social Affairs; New York: United Nations: 2020. World Population Ageing 2020 Highlights: Living arrangements of Older Persons.https://www.un.org/development/desa/pd/sites/www.un.org.development.desa... Accessed 23 September 2020.
-
- Hou Y., Dan X., Babbar M., et al. Ageing as a risk factor for neurodegenerative disease. Nat Rev Neurol. 2019;15(10):565–581. - PubMed
-
- Dekkers I.A., Jansen P.R., Lamb H.J. Obesity, brain volume, and white matter microstructure at MRI: a cross-sectional UK Biobank study. Radiology. 2019;291(3):763–771. - PubMed
Grants and funding
LinkOut - more resources
Full Text Sources
