. 2020 Aug 13;10(50):29885-29899.
doi: 10.1039/d0ra05414c. eCollection 2020 Aug 10.

Characterization of insulin cross-seeding: the underlying mechanism reveals seeding and denaturant-induced insulin fibrillation proceeds through structurally similar intermediates

Affiliations

Characterization of insulin cross-seeding: the underlying mechanism reveals seeding and denaturant-induced insulin fibrillation proceeds through structurally similar intermediates

Mohsen Akbarian et al. RSC Adv. .

Abstract

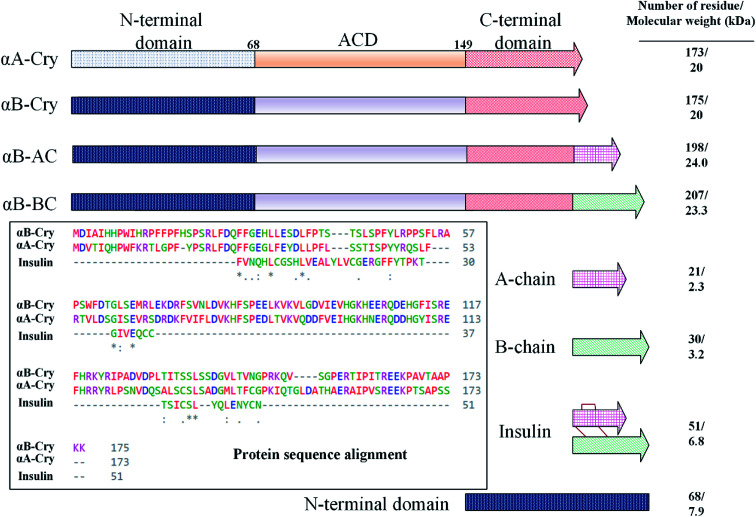
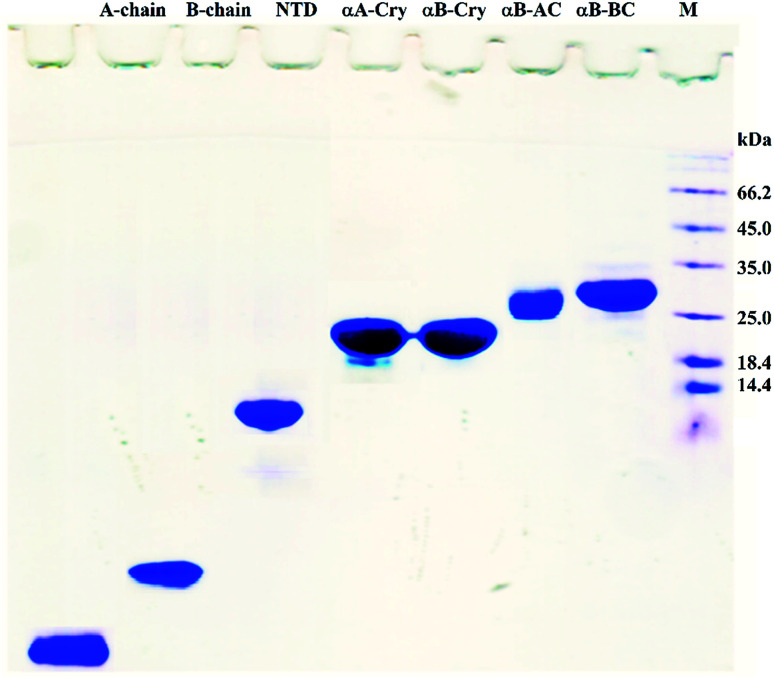
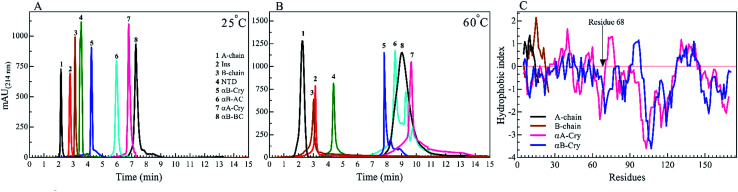
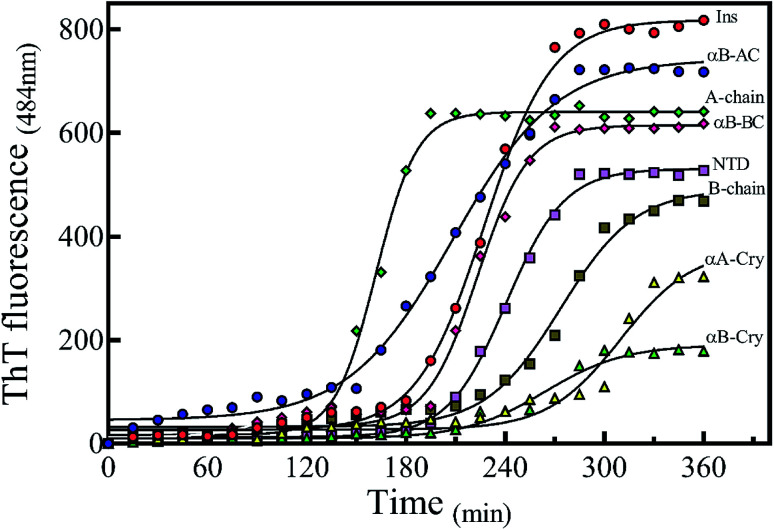
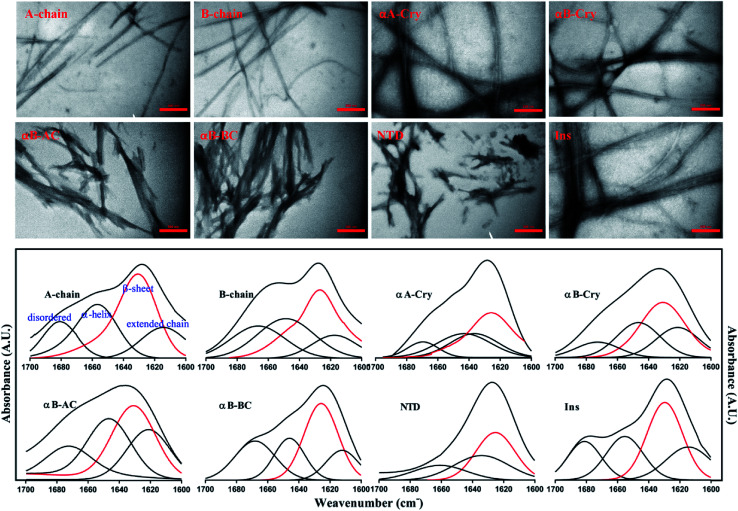
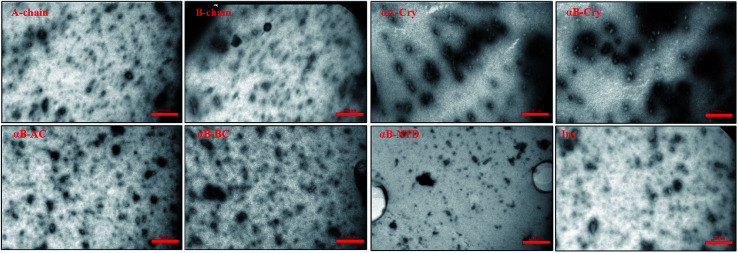
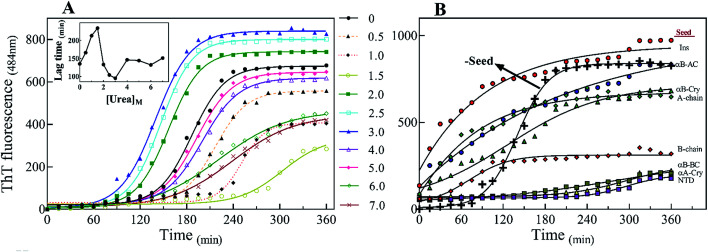
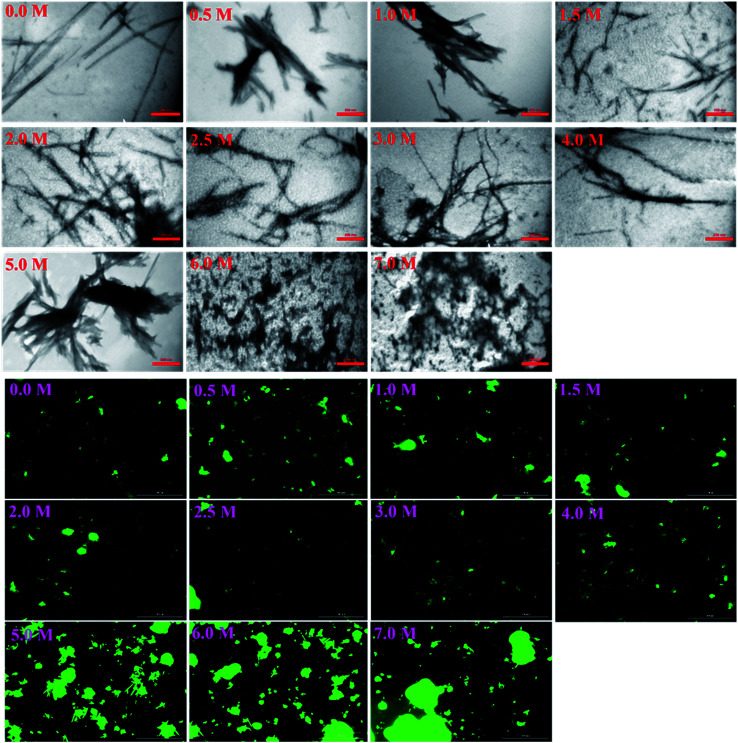
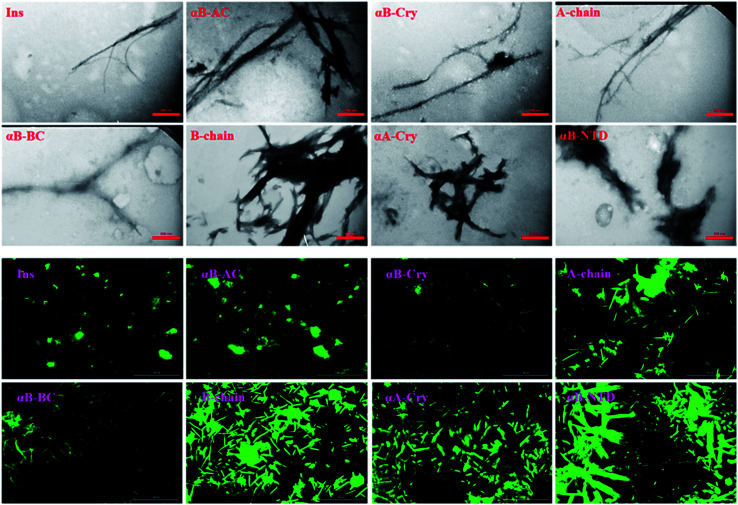
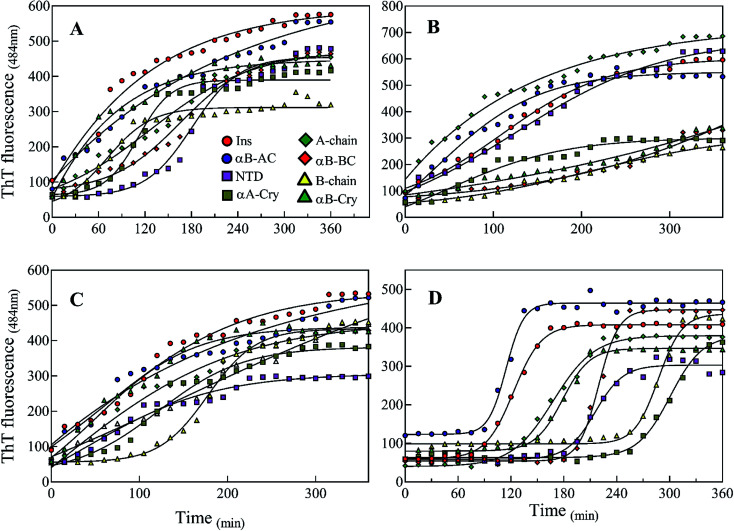
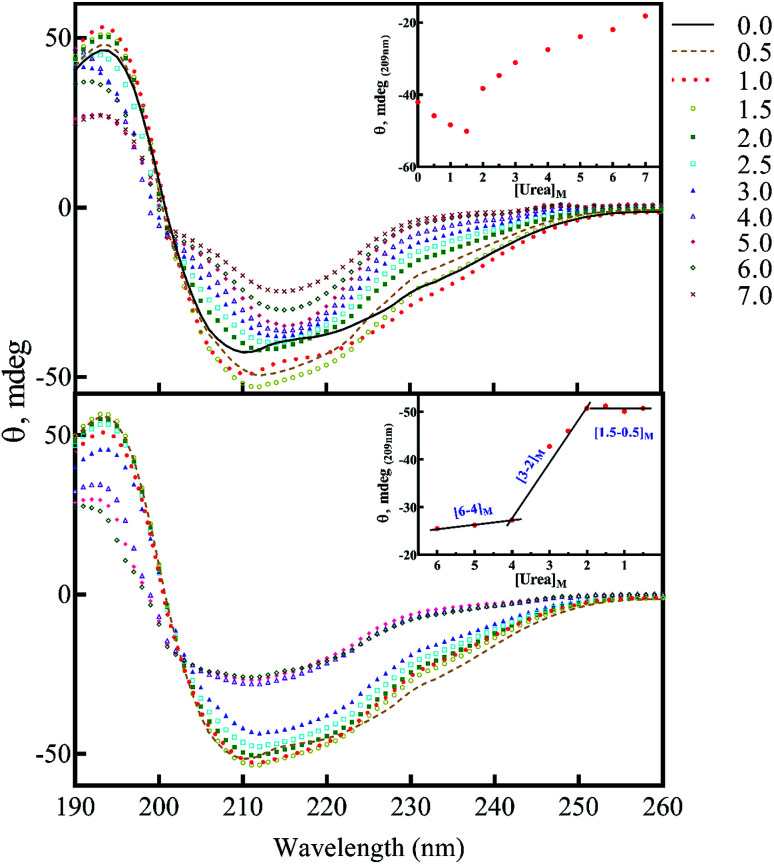
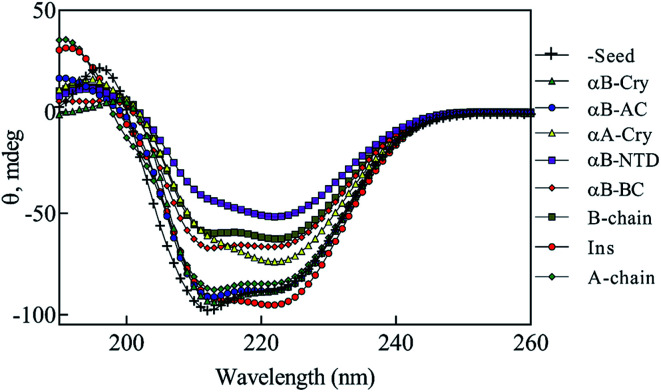
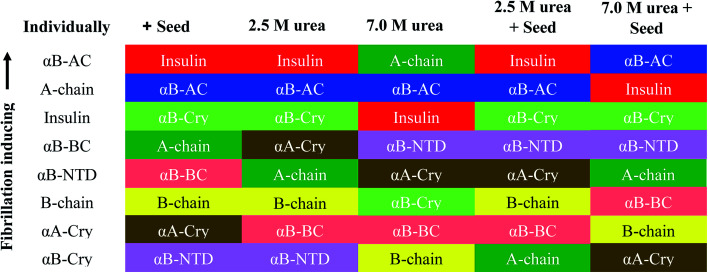
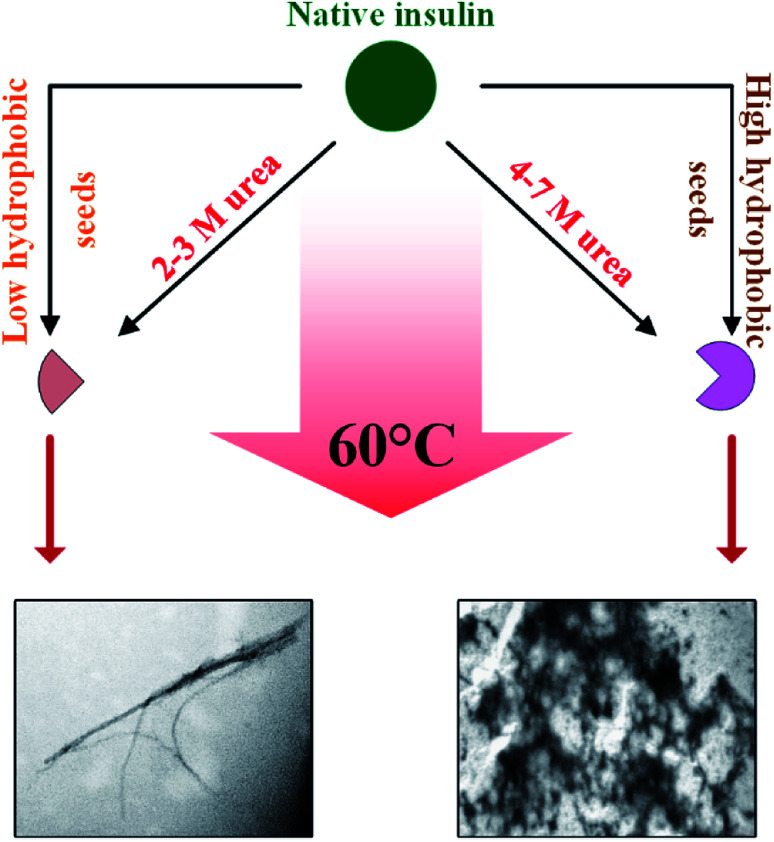
Insulin rapidly fibrillates in the presence of amyloid seeds from different sources. To address its cross-reactivity we chose the seeds of seven model proteins and peptides along with the seeds of insulin itself. Model candidates were selected/designed according to their size, amino acid sequence, and hydrophobicity. We found while some seeds provided catalytic ends for inducing the formation of non-native insulin conformers and increase fibrillation, others attenuated insulin fibrillation kinetics. We also observed competition between the intermediate insulin conformers which formed with urea and amyloid seeds in entering the fibrillogenic pathway. Simultaneous incubation of insulin with urea and amyloid seeds resulted in the formation of nearly similar insulin intermediate conformers which synergistically enhance insulin fibrillation kinetics. Given these results, it is highly likely that, structurally, there is a specific intermediate in different pathways of insulin fibrillation that governs fibrillation kinetics and morphology of the final mature fibril. Overall, this study provides a novel mechanistic insight into insulin fibrillation and gives new information on how seeds of different proteins are capable of altering insulin fibrillation kinetics and morphology. This report, for the first time, tries to answer an important question that why fibrillation of insulin is either accelerated or attenuated in the presence of amyloid fibril seeds from different sources.


Conflict of interest statement

The authors declare that they have no conflicts of interest with the contents of this article.

Figures

Scheme 1
Scheme 1. The schematic illustration of the seed-forming proteins and peptides. Selected eight protein and peptide models on the fibrillation of human insulin. As depicted, these models vary in their molecular masses and the number of residues. Human αA-Cry and αB-Cry share over 50% sequence similarity (multiple sequence alignment was done using Clustal Omega tool), also, both possess three structural regions – hydrophobic N-terminal domain (NTD), α-Cry domain (ACD) and C-terminal domain (CTD).
Fig. 1
Fig. 1. SDS-PAGE analyses for purification of the selected proteins and peptides. Human insulin A- and B-chain were purified by gel filtration chromatography. Human αB-Cry, human αA-Cry, human αB-BC, and human αB-AC were purified as described in published literature.
Fig. 2
Fig. 2. RP-HPLC analysis of the seed forming proteins and peptides at 25 °C and 60 °C. A 20 μL of each protein and peptides (2.0 mg mL−1) in the starting buffer (24% acetonitrile in water) was subjected to the column and run gradient over 15 min (1.0 mL min−1) using 24–60% acetonitrile in water. The hydrophobicity was analyzed by the Knauer HPLC system. The absorbance signals were recorded at 214 nm, using DAD 2.1 UV-Visible detector (Knauer, Germany). The experiments were conducted at 25 °C (A) and 60 °C (B). The hydrophobicity index versus amino acid residues is shown for insulin A-chain, insulin B-chain, human αA-Cry and human αB-Cry (C).
Fig. 3
Fig. 3. Monitoring the kinetics of protein and peptide models fibril formation by ThT fluorescence assessment. The fibril formation by different proteins and peptides was monitored by ThT fluorescence intensity. The concentration of each sample was fixed at 2.0 mg mL−1 with 10 μM ThT in 20% acetic acid at pH 2.0, containing 50 mM NaCl. The samples were incubated at 60 °C for 360 min to induce fibril formation. Also, at the desired time intervals, the analyses were conducted. The excitation wavelength of the protein/peptide samples was fixed at 450 nm, while the emission was recorded at 484 nm. The results were average of three independent experiments.
Fig. 4
Fig. 4. The morphological and structural assessments of the peptide and protein fibrils by TEM and FTIR spectroscopy. TEM (top panel) and FTIR spectroscopy analysis (down panel) of amyloid fibrils were carried out on the samples that were incubated for 6.0 h under the fibrillogenic conditions. All scale bars are 350 nm.
Fig. 5
Fig. 5. TEM images of the seeds. Seeds were prepared by sonication and then TEM imaging was conducted. The scale bares are 350 nm. The average length of all seeds was approximately 50 nm.
Fig. 6
Fig. 6. The impact of urea and seeding on the kinetics of insulin fibrillation. (A) Insulin fibril formation in the presence of different concentrations of urea. Insulin (2.0 mg mL−1) was incubated by urea in different concentrations (0.5–7.0 M). (B) Effect of seeding on insulin fibrillation. The seeds of different origins were added at 5% (W/W). The experiments were conducted under acidic conditions (20% acetic acid, pH 2.0) containing 50 mM NaCl at 60 °C. The plots are an average of three independent experiments.
Fig. 7
Fig. 7. The TEM micrographs and fluorescence microscopic assessments of insulin in the presence of different concentrations of urea. Insulin fibrils were grown at pH 2.0 in different concentrations of urea. The scale bars for TEM micrograph and fluorescence images were 200 nm and 100 μm, respectively.
Fig. 8
Fig. 8. The electron micrograph and fluorescence images of insulin fibrils generated in the presence of different seeds. The images show the morphology of fibrils in the presence of different seeds at pH 2.0. The scale bars were 200 nm and 100 μm for EM and fluorescence images, respectively.
Fig. 9
Fig. 9. Kinetics of insulin fibrillation at pH 2.0 monitoring by ThT fluorescence assay. Co-incubation of the monomeric insulin (2 mg mL−1) with the seeds of different proteins and peptides (5% W/W) at 2.5 M (A) and 7 M urea (B). Also, before adding the seeds, insulin was pre-incubated at 2.5 M (C) and 7 M (D) urea and after that, the seeds were added to the mixtures.
Fig. 10
Fig. 10. The secondary structural analyses of human insulin in the presence of different concentrations of urea. Human insulin (2.0 mg mL−1) was incubated (15 min) with different concentrations of urea (0.5–7.0 M), then the far UV-CD spectra were collected (A). The effect of decreasing concentration of urea on insulin secondary structure was also assessed (B). The dilution was carried out with a final insulin concentration of 2.0 mg mL−1 and different concentrations of urea. Before the dilution, insulin was incubated for 15 min. Then, upon dilution, the protein was incubated with the lower concentrations of urea for 15 min to equilibrate. The experiments were conducted at 60 °C, in 20% acetic acid, pH 2.0.
Fig. 11
Fig. 11. The seed-induced structural transition of human insulin. The far UV-CD analysis of human insulin (2.0 mg mL−1) in the presence of different seeds was done. Given 5% (w/w) seeds to insulin concentration, the final concentration of the seeds was 0.1 mg mL−1. Before collecting the spectra, insulin was incubated for 15 min in the presence of each seed. The experiments were conducted in 20% acetic acid containing 50 mM NaCl, 60 °C, at pH 2.0.
Fig. 12
Fig. 12. Comparative seeding effect on human insulin. The seeding effect was compared based on T1/2 value obtained in each condition and arranged in the decreasing order of T1/2 obtained in each seeding or cross seeding sample. The colors correspond to the seed used.
Scheme 2
Scheme 2. A proposed mechanism for the cross-templating insulin fibrillation. Native insulin in the presence of 2–3 M urea forms the intermediate conformers which subsequently produce ordered aggregates (amyloid fibrils), while urea at the higher concentration (4–7 M) induces the amorphous aggregation. The produced seeds with low hydrophobicity, similar to low urea level, are capable of inducing insulin intermediates-conformers that form long and distinguishable fibrils. Also, the seeds with high hydrophobicity, similar to high urea levels, were able to induce the entire unfolding of insulin, producing amorphous aggregates.

Similar articles

Cited by

References

    1. Brange J. Andersen L. Laursen E. D. Meyn G. Rasmussen E. J. Pharm. Sci. 1997;86:517–525. doi: 10.1021/js960297s. - DOI - PubMed
    1. Dische F. Wernstedt C. Westermark G. Westermark P. Pepys M. Rennie J. Gilbey S. Watkins P. Diabetologia. 1988;31:158–161. doi: 10.1007/BF00276849. - DOI - PubMed
    1. Akbarian M. Ghasemi Y. Uversky V. N. Yousefi R. Int. J. Pharm. 2018;547(1–2):450–468. doi: 10.1016/j.ijpharm.2018.06.023. - DOI - PubMed
    1. Ahmad A. Uversky V. N. Hong D. Fink A. L. J. Biol. Chem. 2005;280:42669–42675. doi: 10.1074/jbc.M504298200. - DOI - PubMed
    1. Ivanova M. I. Sievers S. A. Sawaya M. R. Wall J. S. Eisenberg D. Proc. Natl. Acad. Sci. U. S. A. 2009;106:18990–18995. doi: 10.1073/pnas.0910080106. - DOI - PMC - PubMed