Review
. 2022 Apr 3;14(4):e23795.
doi: 10.7759/cureus.23795. eCollection 2022 Apr.

Where Are We Heading With Fluid Responsiveness and Septic Shock?

Affiliations
Review

Where Are We Heading With Fluid Responsiveness and Septic Shock?

Mohammed Megri et al. Cureus. .

Abstract

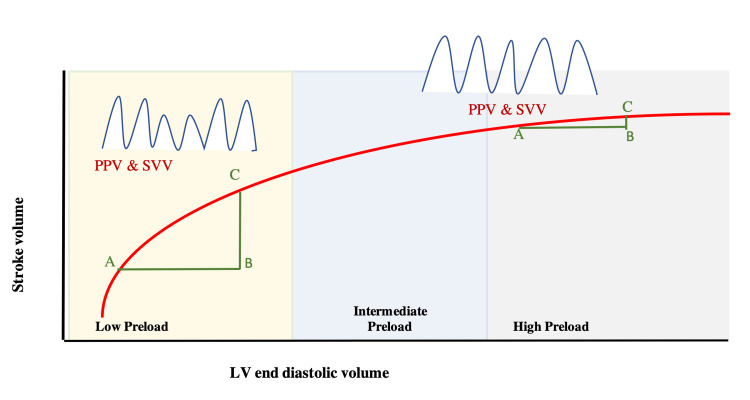
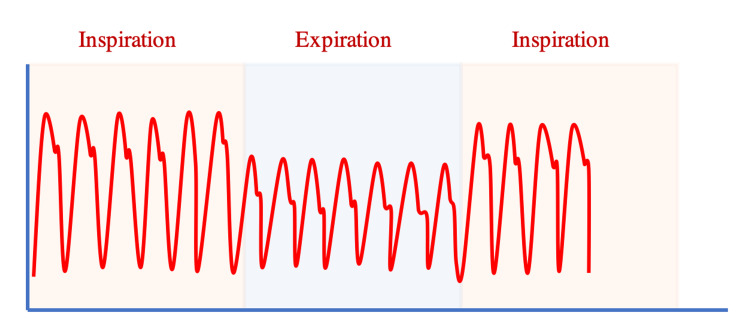
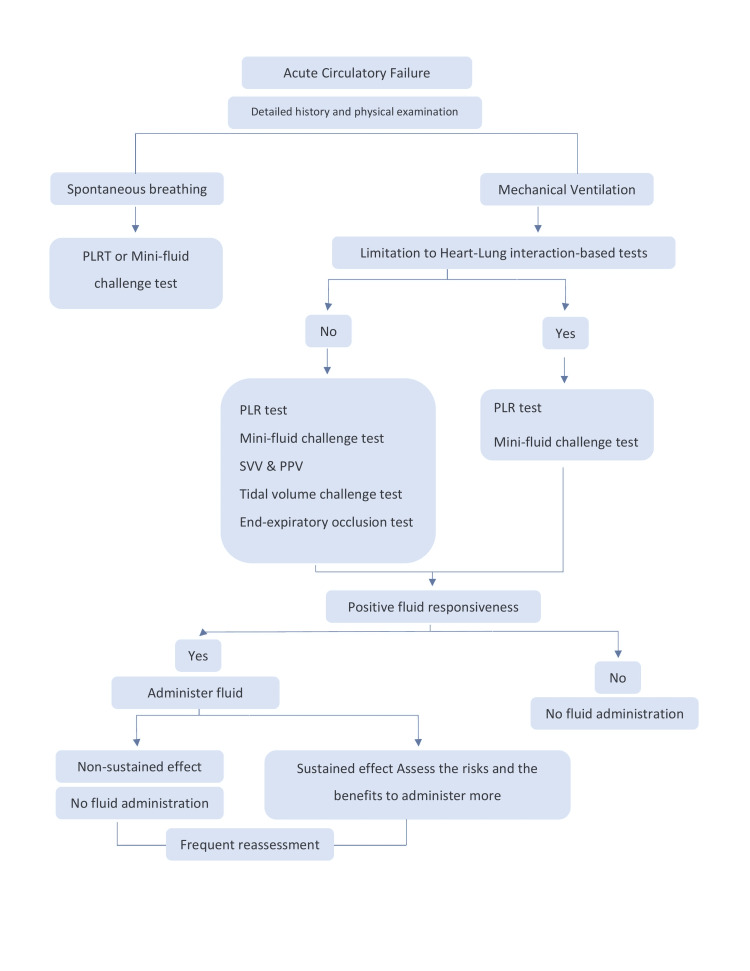
When hypovolemia is left uncorrected, it can lead to poor tissue oxygenation and organ dysfunction. On the other hand, excessive fluid administration can increase the risk of complications. Assessing volume responsiveness in critically ill patients is therefore crucial. In this article we summarized the literature addressing the most sensitive and specific dynamic predictors for fluid responsiveness, to help clarify the best way to guide clinicians in managing patients with shock. Data were collected from PubMed and EMBASE of high-quality articles, randomized controlled trials (RCTs), retrospective research, and metanalyses; articles were identified from January 2000 to February 2021. We identified and critically reviewed the published peer-reviewed literature investigating the dynamic predictors to assess fluid responsiveness. Evidence suggests that the traditional use of static predictors for fluid responsiveness should be abandoned. Over the last 20 years, a number of dynamic tests have been developed. These tests are based on the principle of inducing short-term changes in cardiac preload using heart-lung interactions. However, in routine practice the conditions to meet the requirements of these dynamic parameters are frequently not met. Therefore, more dynamic predictors that do not depend on heart-lung interaction have developed such as the mini fluid challenge test and passive leg raising test These tests have fewer limitations and higher sensitivity and specificity compared to the other tests.

Keywords: fluid responsiveness; liberal vs restricted approach to fluid resuscitation in septic shock; passive leg raising; pocus; pulse pressure variation.


Conflict of interest statement

The authors have declared that no competing interests exist.

Figures

Figure 1
Figure 1. Cardiac function curves: Graphical analysis of the venous return function and cardiac output, with superimposition of the venous return function curve (purple) and the Frank-Starling (cardiac output) curve (red). The intersection between these two curves in an equilibrated system is RAP. Venous return reaches its maximum when the RAP is near zero. The venous return function curve intersects the x axis at zero blood flow, where it represents the MSFP. In the case of volume responsiveness, the VR function curve is shifted upwards and to the right and reaches a new equilibrium (dotted purple line with resulting grey RAP). With spontaneous inspiration, pleural pressure and RAP drop (blue arrow), while transmural RAP will rise. The Starling curve is shifted to the left (dotted blue curve). A new equilibrium point is reached (dark blue RAP), cardiac output will rise despite lower RAP. With mechanical inspiration and positive intrathoracic pressure, the opposite happens (dotted green line). Lower cardiac output despite a higher RAP (dark green) is observed.
VR = venous return, CO = cardiac output, MSFP = mean systemic filling pressure, RAP = right atrial pressure Adapted from reference [5].
Figure 2
Figure 2. Frank-Starling curve showing the relation between LV stroke volume and left LV end-diastolic volume. At the low preload zone, giving fluid from point A-B increased the SV from point A-C. Giving a fluid bolus in the high preload zone (A-B) made minimal changes in SV (A-C)
PPV: Pulse Pressure Variation, SVV: Stroke Volume Variation, LV: left ventricle, SV: stroke volume
Figure 3
Figure 3. Pulse pressure (PP) variation in an intubated patient during a respiratory cycle. [(Max PP -Minimum PP)/PPmean]x100
Figure 4
Figure 4. LEFT: Apical five chamber view with illustration of how to measure the LVOT VTI. RIGHT: Parasternal long axis view measuring the LVOT diameter. By using the LVOT VTI and LVOT diameter, stroke volume and cardiac output can be measured [SV = VTI x CSA]. [CSA = 0.785 x (LVOT diameter)].
LVOT: left ventricular out flow, VTI: velocity time interval, SV: stroke volume, CSA: Cross-sectional area
Figure 5
Figure 5. LEFT: Subcostal view of the IVC, hepatic vein, a portion of the liver, and the RA with IVC diameter measured. RIGHT: Using M-Mode to measure the distensibility of the IVC.
IVC: inferior vena cava, RA: right atrium, HV: hepatic vein
Figure 6
Figure 6. Jugular vein variation in intubated patient showing distensibility index of 13%, which suggests that the patient is not fluid responsive
Figure 7
Figure 7. A: Initial position before the passive leg raising (PLR) test. B: Position of the patient at the end of PLR
Figure 8
Figure 8. Approach to predict fluid responsiveness in critically ill patients
PPV: Pulse pressure variation, SVV: stroke volume variation, PLR: Passive leg raising

Similar articles

Cited by

References

    1. Predicting fluid responsiveness in ICU patients: a critical analysis of the evidence. Michard F, Teboul JL. Chest. 2002;121:2000–2008. - PubMed
    1. Fluid resuscitation in septic shock: a positive fluid balance and elevated central venous pressure are associated with increased mortality. Boyd JH, Forbes J, Nakada TA, Walley KR, Russell JA. Crit Care Med. 2011;39:259–265. - PubMed
    1. Comparison of two fluid-management strategies in acute lung injury. Wiedemann HP, Wheeler AP, Bernard GR, et al. N Engl J Med. 2006;354:2564–2575. - PubMed
    1. Heart-lung interactions during mechanical ventilation: the basics. Mahmood SS, Pinsky MR. Ann Transl Med. 2018;6:349. - PMC - PubMed
    1. Basic concepts of heart-lung interactions during mechanical ventilation. Grübler MR, Wigger O, Berger D, Blöchlinger S. Swiss Med Wkly. 2017;147:0. - PubMed

LinkOut - more resources